Banking in Bolivia as of September 2026: Nominal Expansion, Short-Term Liquidity, and Greater Exposure to the Public Sector

Introduction
As has become customary in this column, we will examine the performance of the banking system in recent months using information published by the Financial System Supervisory Authority (Autoridad de Supervisión del Sistema Financiero, ASFI). The analysis is based exclusively on the financial statements and other banking data series published by ASFI.
With that introduction, let us turn to a nominal analysis of the Bolivian banking system’s financial statements.
Overview of the System: Balance Sheet and Currency Composition
The balance sheet provides a snapshot of an institution’s financial position at a particular point in time, showing the composition of its assets, liabilities, and equity.
In the banking system, assets represent the resources in which banks have invested, such as loans granted, deposits held with other financial institutions, and physical assets such as buildings and equipment. Liabilities, by contrast, represent banks’ obligations, including customer deposits, borrowing from other financial institutions, and other sources of funding. Finally, equity is the difference between assets and liabilities, representing the institution’s shareholders’ own funds.
Balance-Sheet Structure
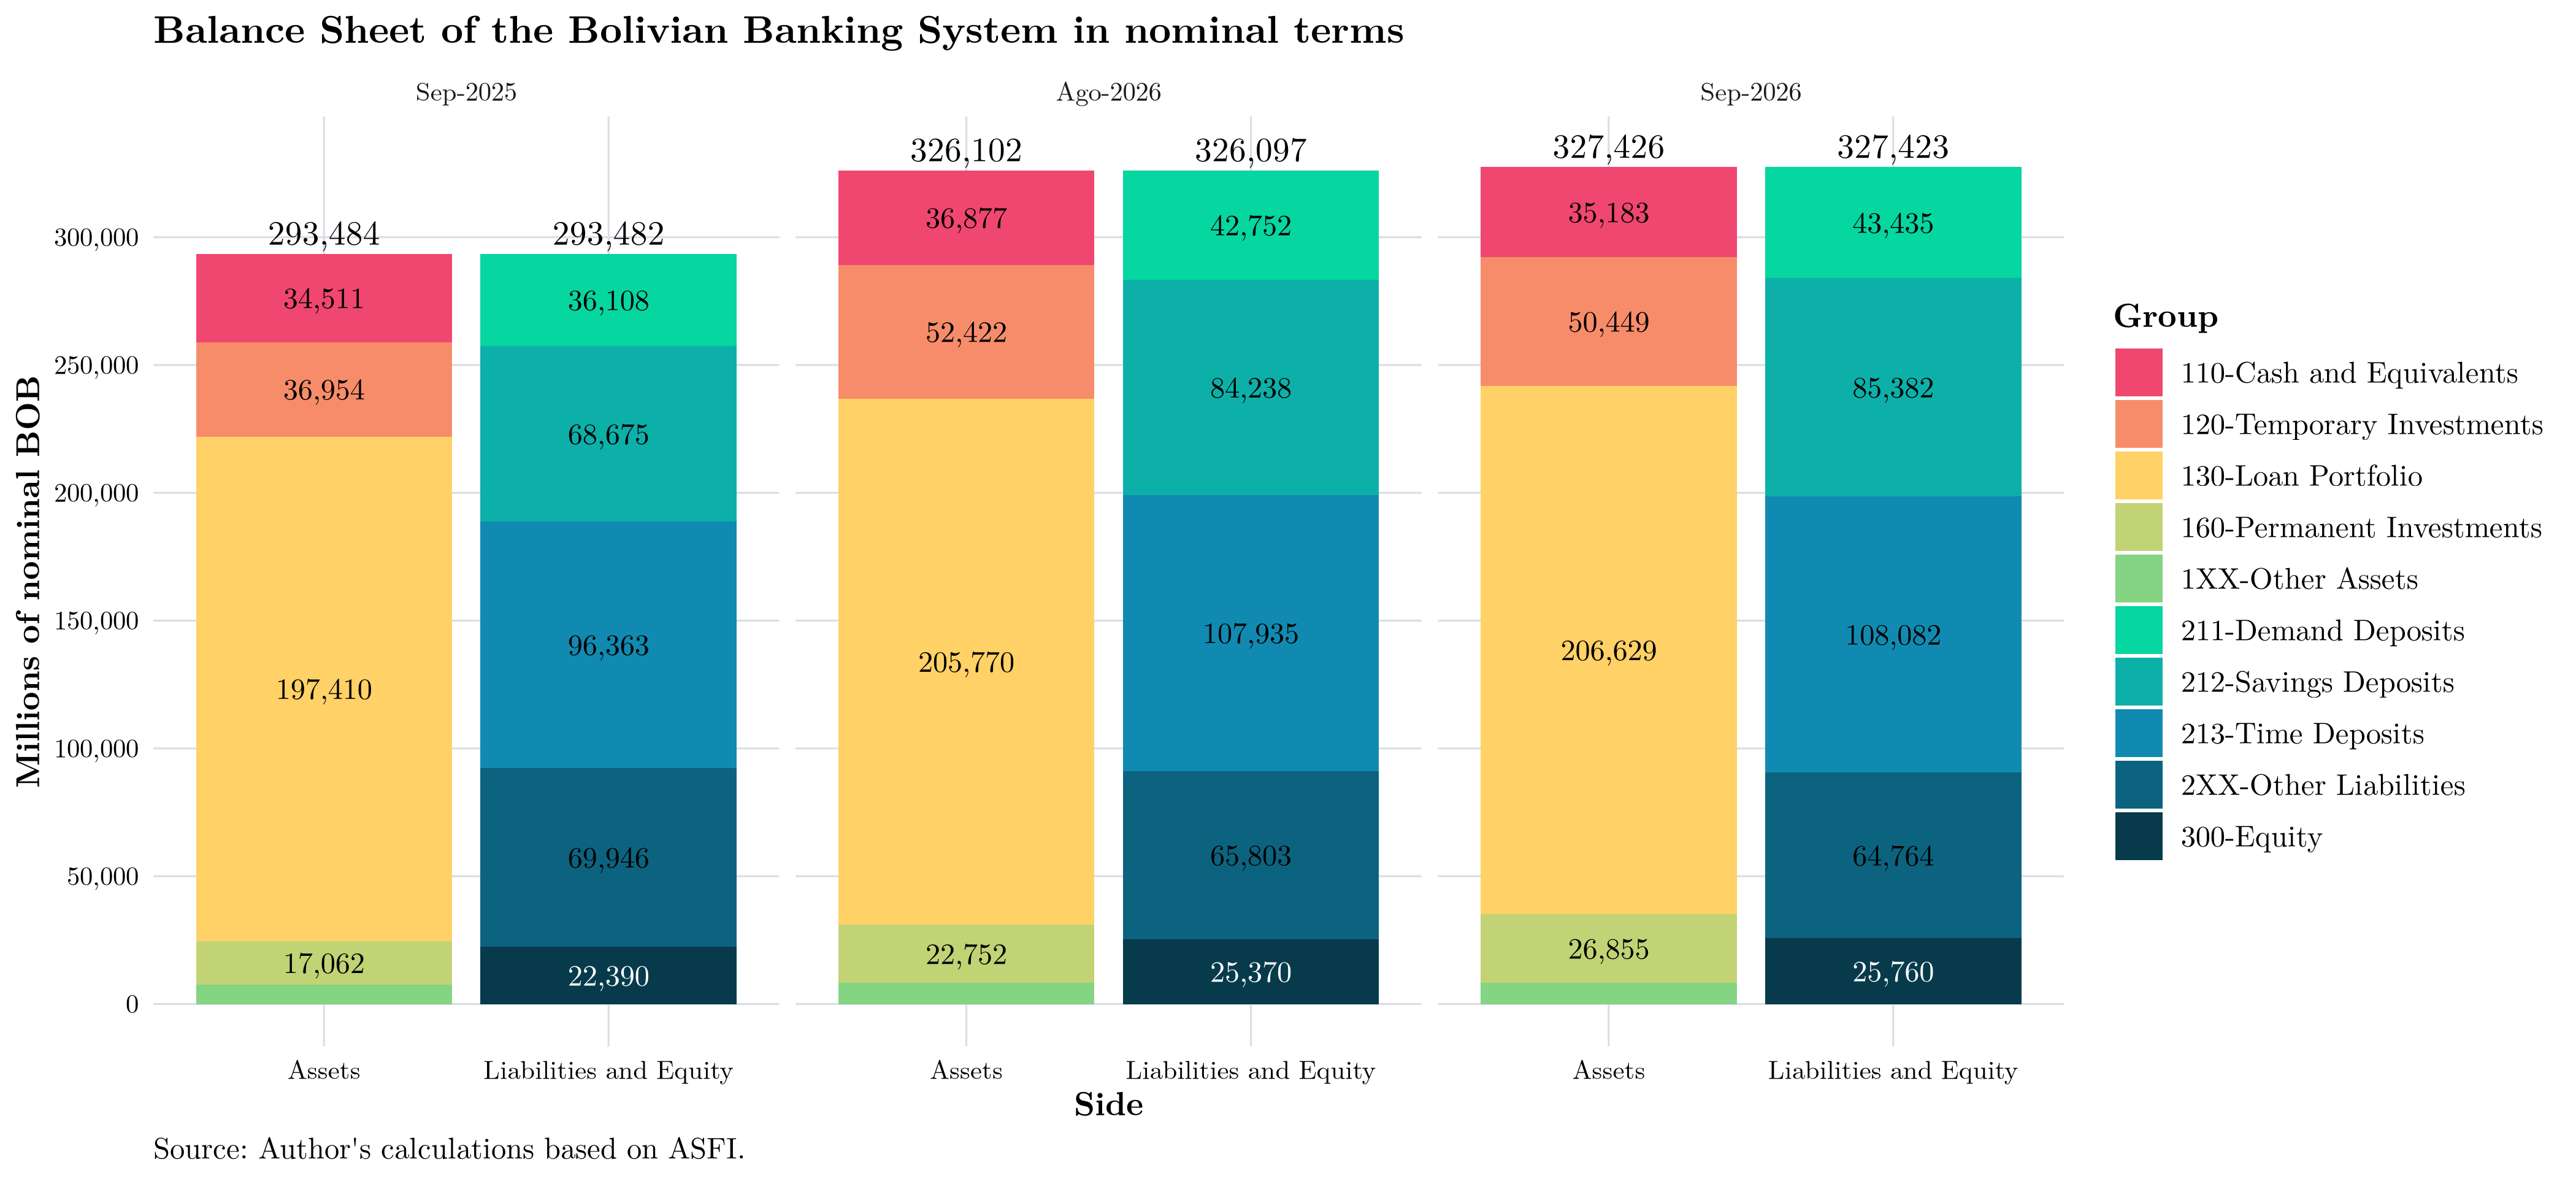
To provide a clearer perspective, the following chart summarizes the composition of the banking system’s balance sheet at three key points in time: the latest available month, the preceding comparable period, and the same month of the previous year. This makes it possible to examine changes in the financial structure both over the past year and more recently:
A summary of the growth rates is provided in the following table:
Nominal percentage changes in balance-sheet accounts
| Classification | Account | Change over 12 months | Change vs. previous month | Change vs. previous quarter |
|---|---|---|---|---|
| Assets | 110 — Cash and cash equivalents | 1.9% | -7.7% | -4.6% |
| Assets | 120 — Short-term investments | 36.5% | 14.2% | -3.8% |
| Assets | 130 — Loan portfolio | 4.7% | 1.0% | 0.4% |
| Assets | 160 — Long-term investments | 57.4% | 36.9% | 18.0% |
| Assets | 1XX — Other | 10.1% | -1.8% | 0.4% |
| Liabilities | 210 — Obligations to the public | 17.7% | 5.0% | 0.9% |
| Liabilities | 211 — Current accounts | 20.3% | 10.4% | 1.6% |
| Liabilities | 212 — Savings deposits | 24.3% | 6.5% | 1.4% |
| Liabilities | 213 — Term deposits | 12.2% | 2.6% | 0.1% |
| Liabilities | 2XX — Other | -7.4% | -1.4% | -1.6% |
| Equity | 300 — Capital | 15.0% | 5.4% | 1.5% |
In terms of composition and year-on-year comparisons, the Bolivian banking system’s balance sheet (measured by the system’s total assets) shows moderate expansion. For example, as of September 2026, the balance sheet increased by BOB 1,310 million (0.4%) relative to the previous month, by BOB 12,350 million (3.9%) relative to the previous quarter, and by BOB 33,933 million (11.6%) relative to the same month of the previous year.
In this regard, the annual growth of long-term investments (+57.4%) and short-term investments (+36.5%) is particularly striking. This development contrasts sharply with the almost negligible growth of the loan portfolio (+4.7%), at least when compared with inflation over the period.
The sources of these changes will be examined in greater detail later. At this stage, however, it already appears that funds available for lending are being allocated to securities, probably issued by the Central Bank of Bolivia, at the expense of lending.
Currency Composition
Another potentially informative way to examine the balance sheet is to distinguish between the proportions of assets and liabilities denominated in domestic currency and those denominated in foreign currency:
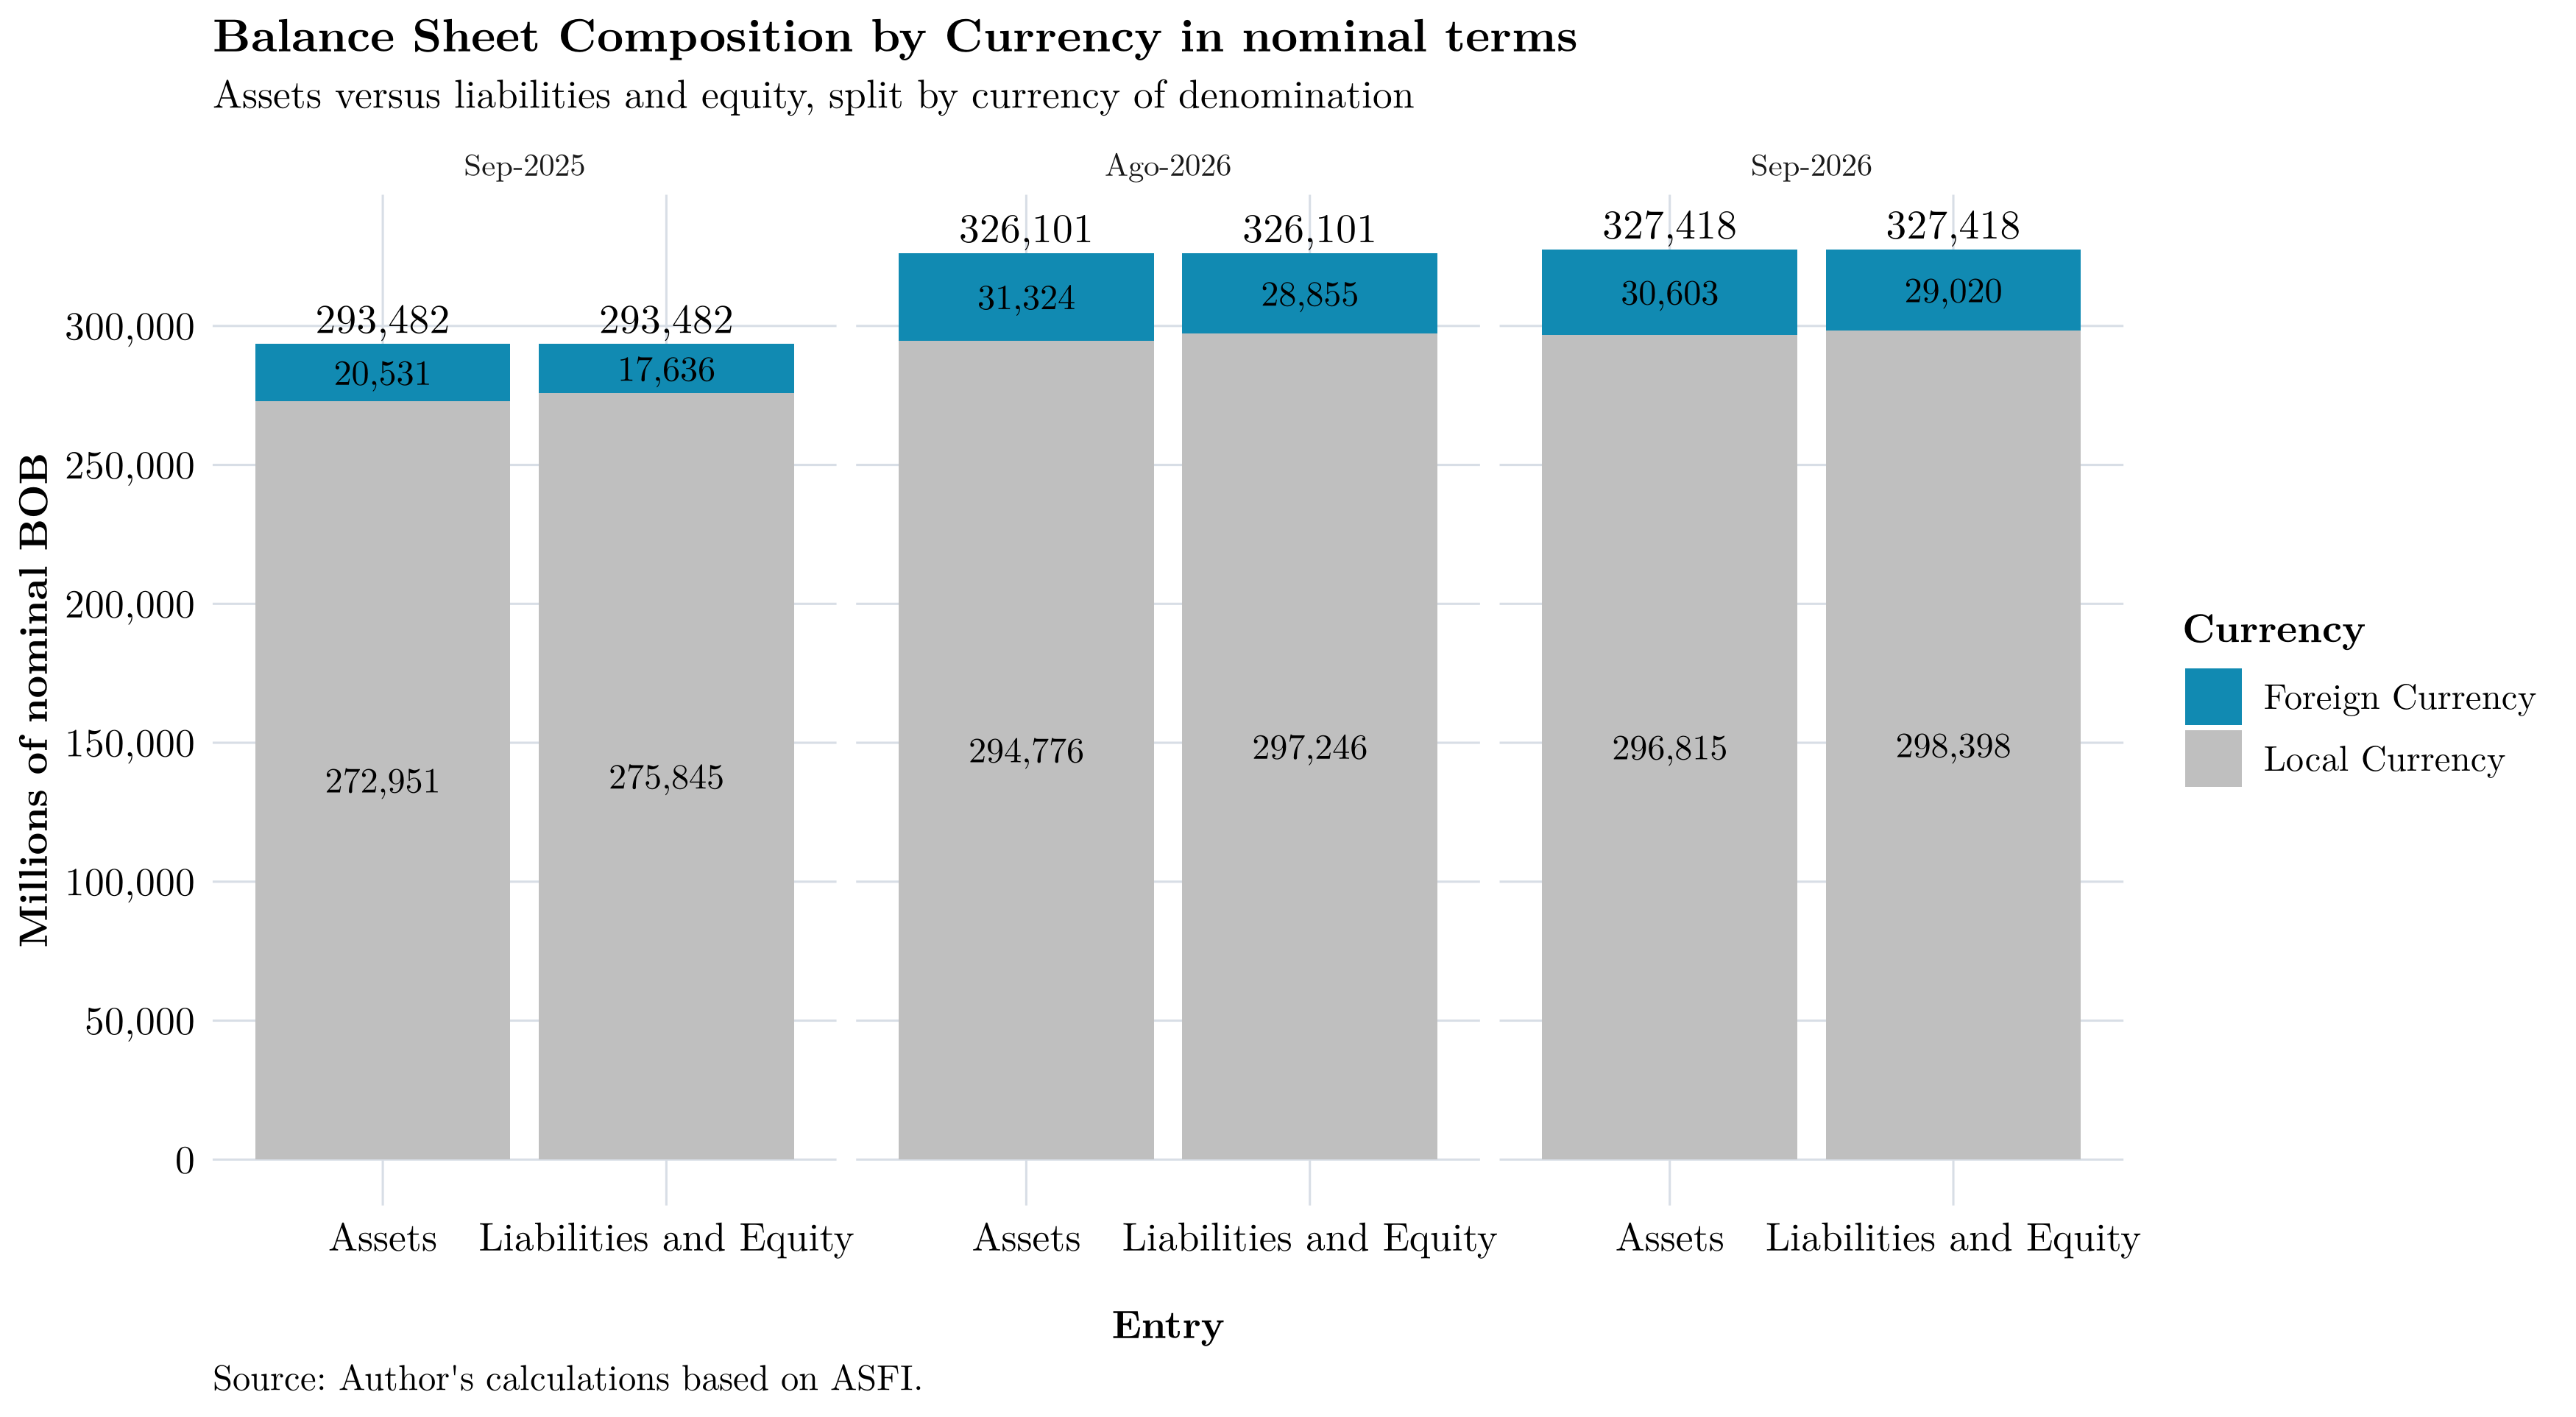
In relative terms, as of September 2026, foreign-currency assets accounted for 9.3% of total assets, while foreign-currency liabilities accounted for 9.6% of total liabilities. In the same month of the previous year, these shares were 7.0% for assets and 6.5% for liabilities.
It is noteworthy that the foreign-currency share has increased on both sides of the balance sheet. This development warrants further examination, although it may simply reflect the accounting recognition of the exchange rate prevailing at the reporting date. From a prudential perspective, however, under the new floating exchange-rate regime, exchange-rate movements would have a more direct effect on balance sheets, transmitting exchange-rate volatility to financial institutions’ earnings.
Although the shares have increased, the composition of foreign-currency assets and liabilities remains similar to that of the previous year:
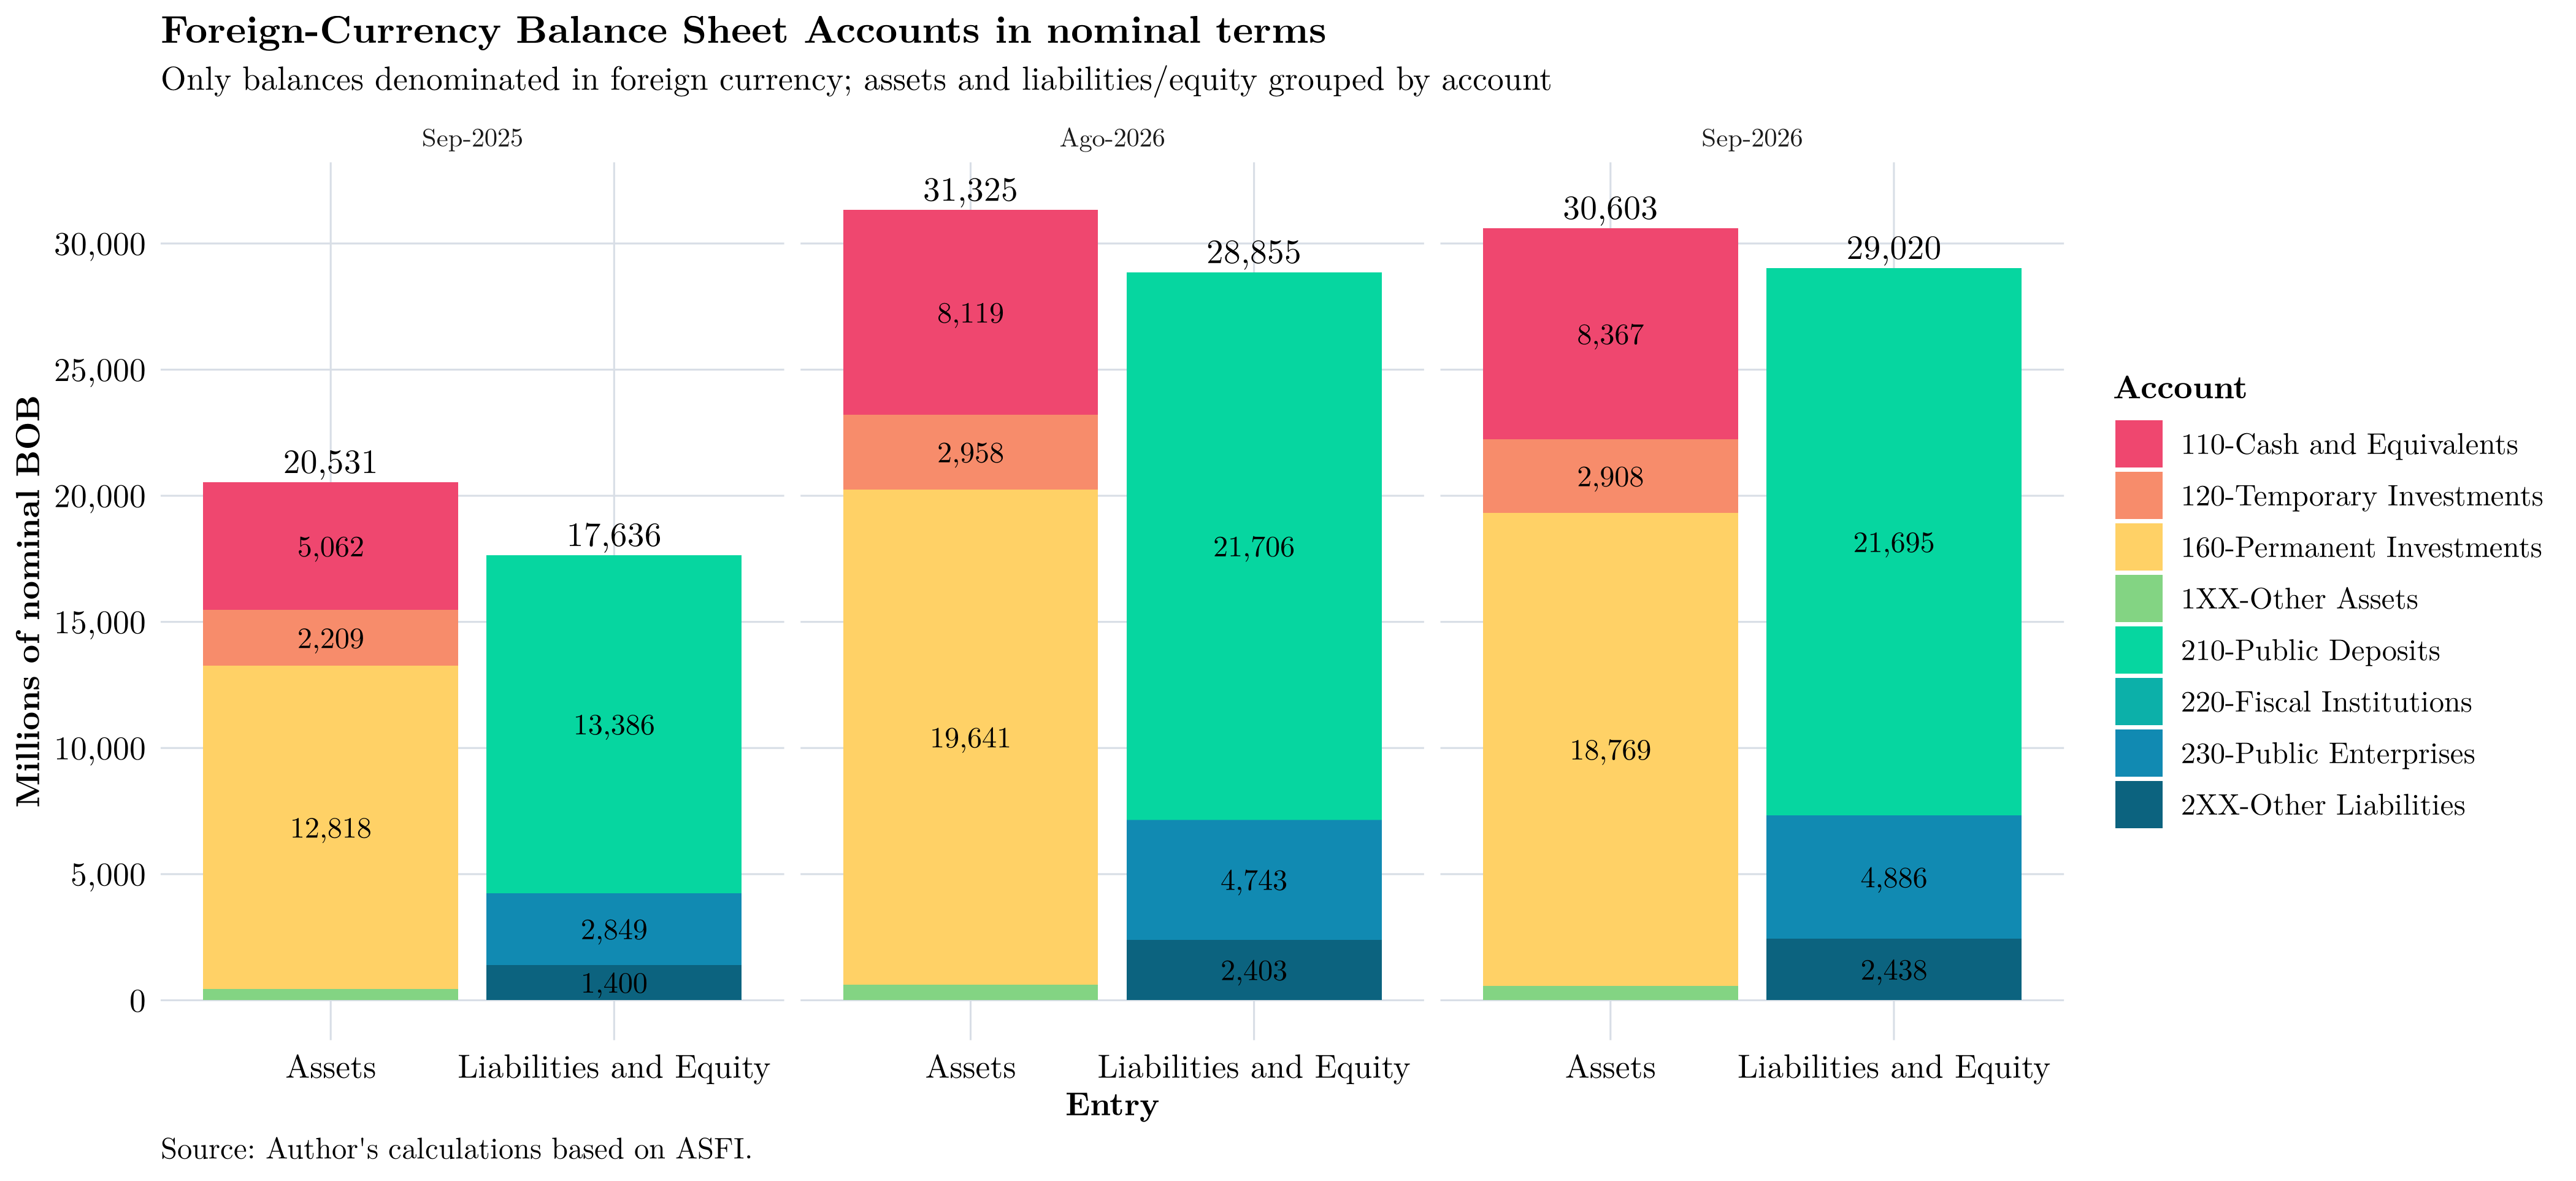
While the banking system has sought to reduce its foreign-currency exposure, supported by the maturity of the FOGAVISP, CPVIS, and other funds, as well as the gradual return of liquidity by the BCB, an asset-liability mismatch persists.
On the one hand, obligations to the public (current and savings accounts) account for the bulk of foreign-currency liabilities. On the other hand, the corresponding assets are largely tied up in long-term investments held with the BCB and in cash and cash equivalents. Although these investments have declined, they still account for a significant share: the funds exist on the books, but banks may lack operational access to them because the monetary authority has not yet returned them.
Liquidity and Asset Structure
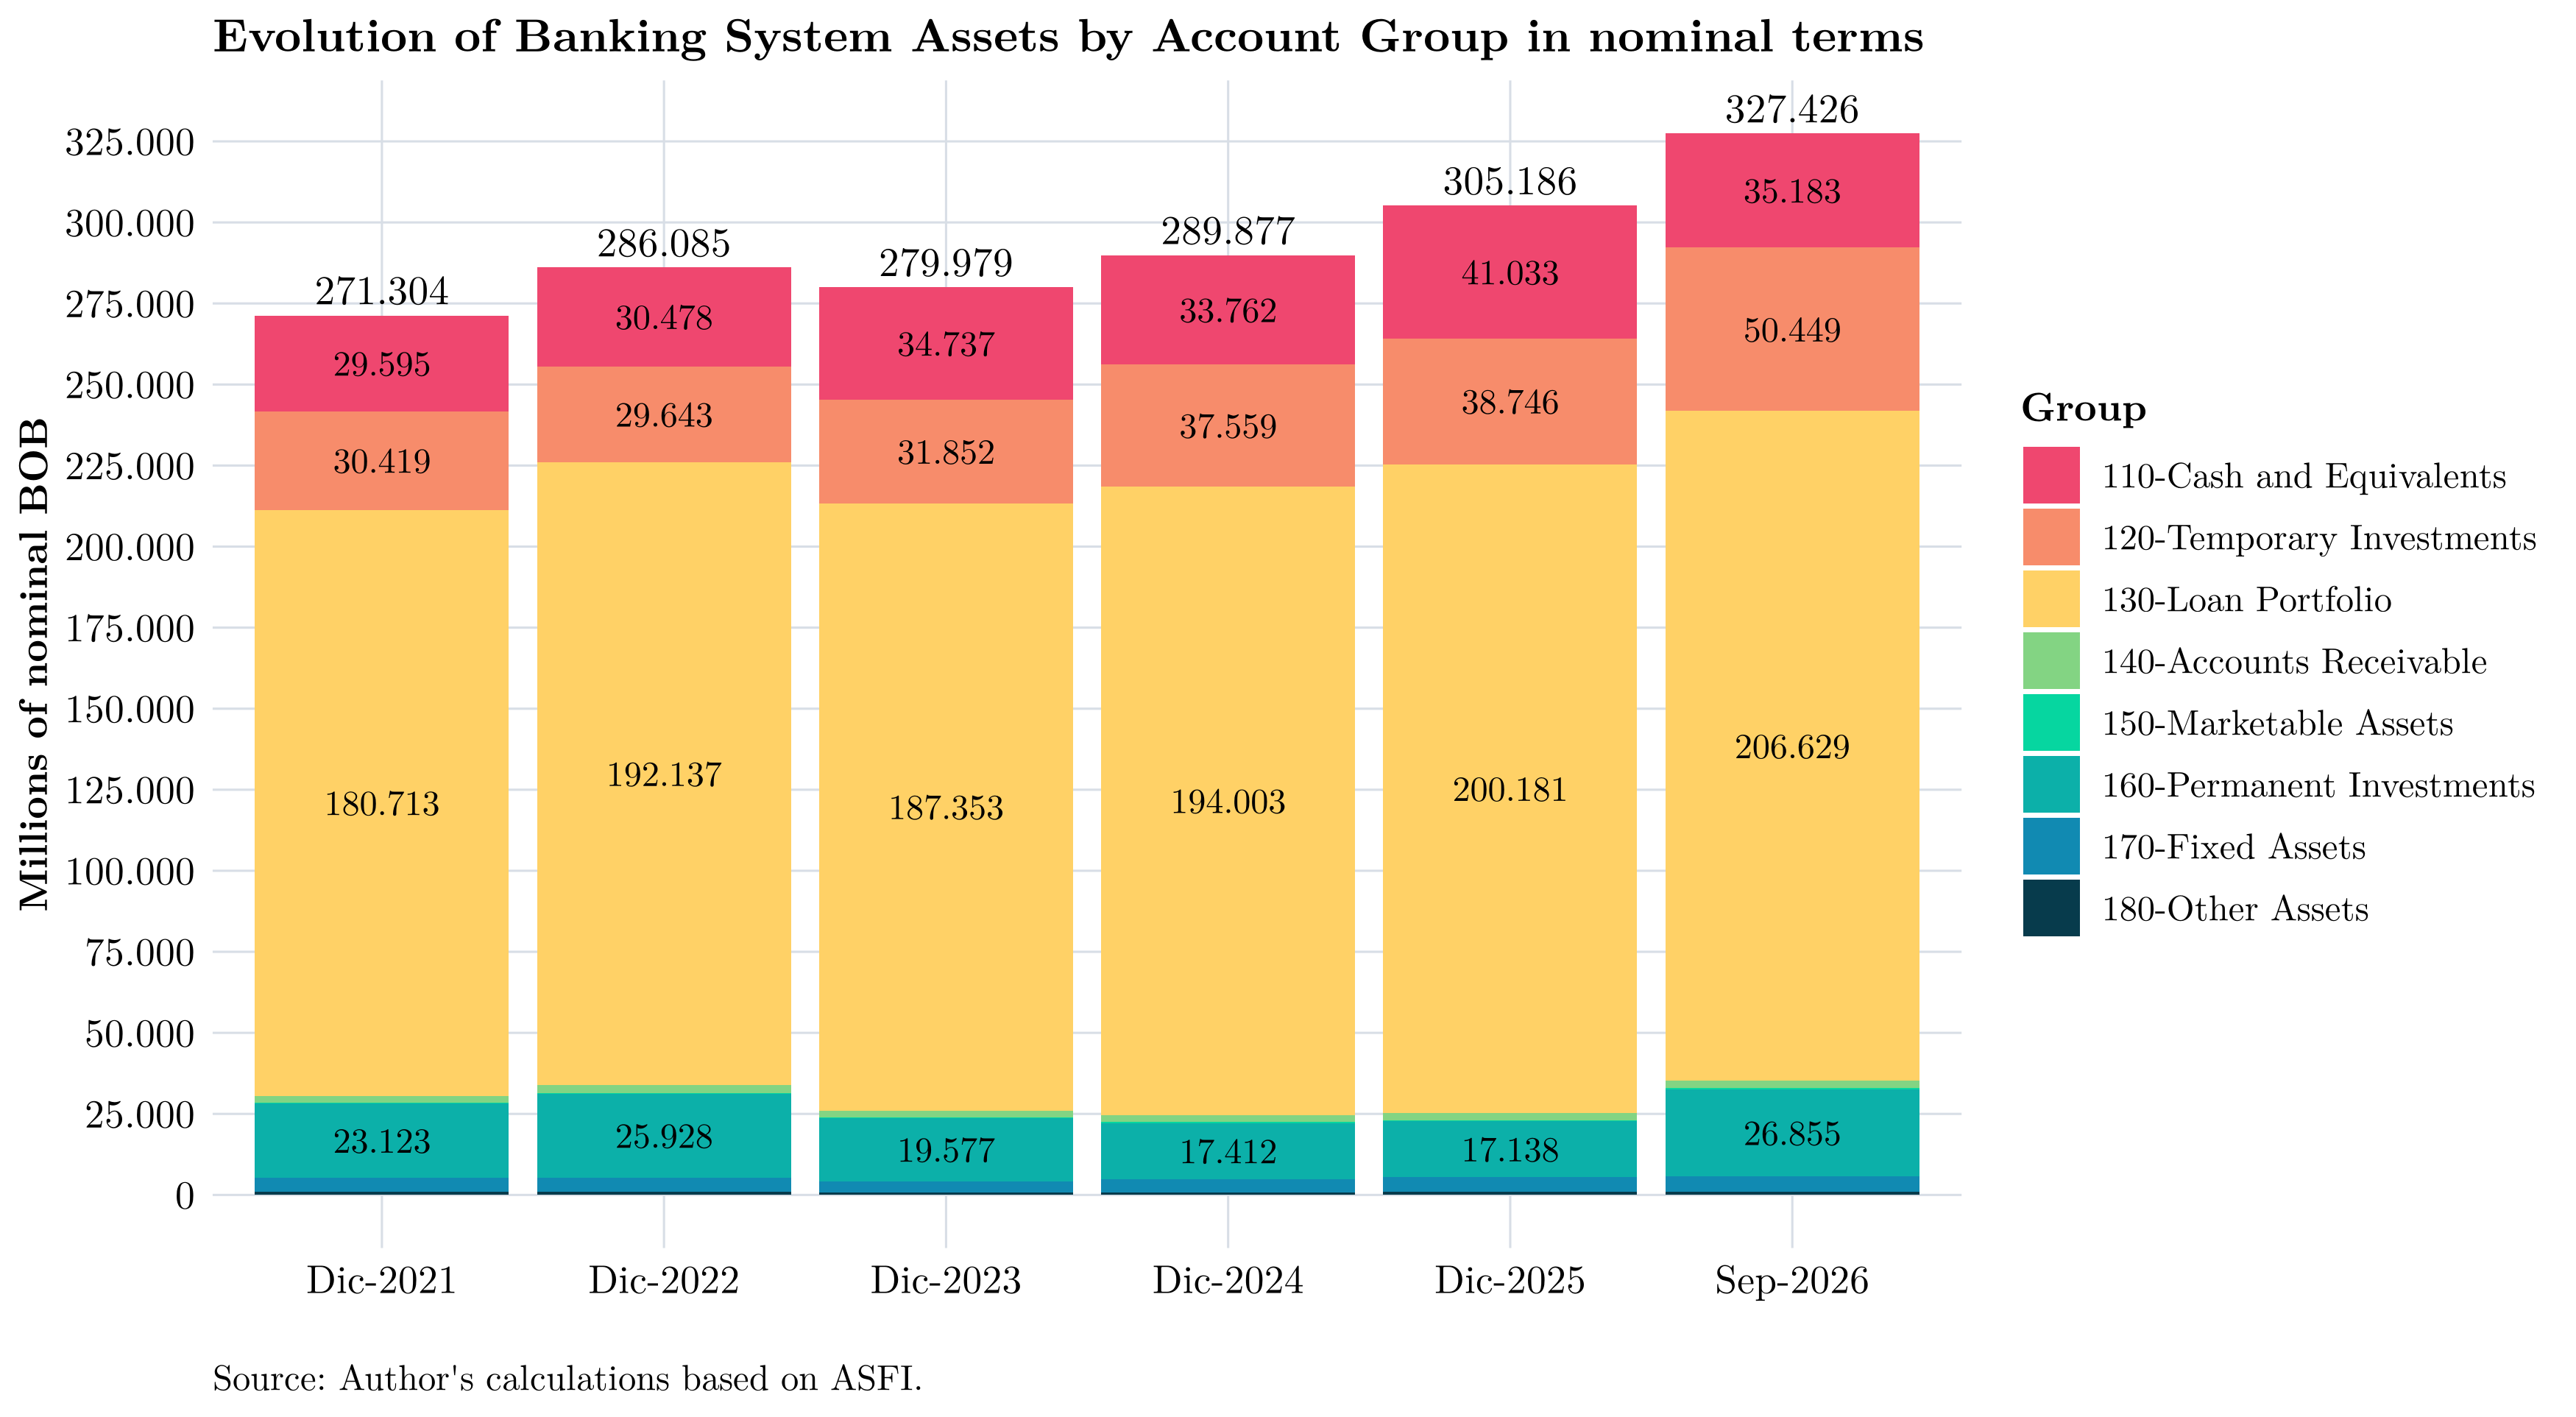
For this analysis, liquidity is defined as the sum of cash and cash equivalents and short-term investments—accounts 110.00 and 120.00. This indicator approximates the most liquid assets or those with the shortest time to realization. Relative to the previous month, liquidity fell by BOB 3,667 million (-4.1%); relative to the previous quarter, it rose by BOB 3,312 million (4.0%); and relative to the same month of the previous year, it increased by BOB 14,166 million (19.8%).
The analysis of assets is organized around two questions: how much of the growth comes from liquid or low-risk assets, and how much corresponds to lending activities that support financial intermediation? Accordingly, this section examines overall asset composition, cash and cash equivalents, and investments separately before turning to the loan portfolio.
Financial institutions’ assets include cash held in vaults and ATMs for daily operations, loans granted, investments in financial instruments, and real estate used in their operations. This section focuses on the composition of assets and their liquidity; the loan portfolio is subsequently analyzed alongside funding, because both variables describe the financial intermediation process.
The following chart shows the evolution of banking-system assets over selected years through the latest available month. Significant growth can be observed, albeit with some fluctuations. One relevant development, as noted earlier, is the increasing preference for short-term investments over cash and cash equivalents:
By institution:
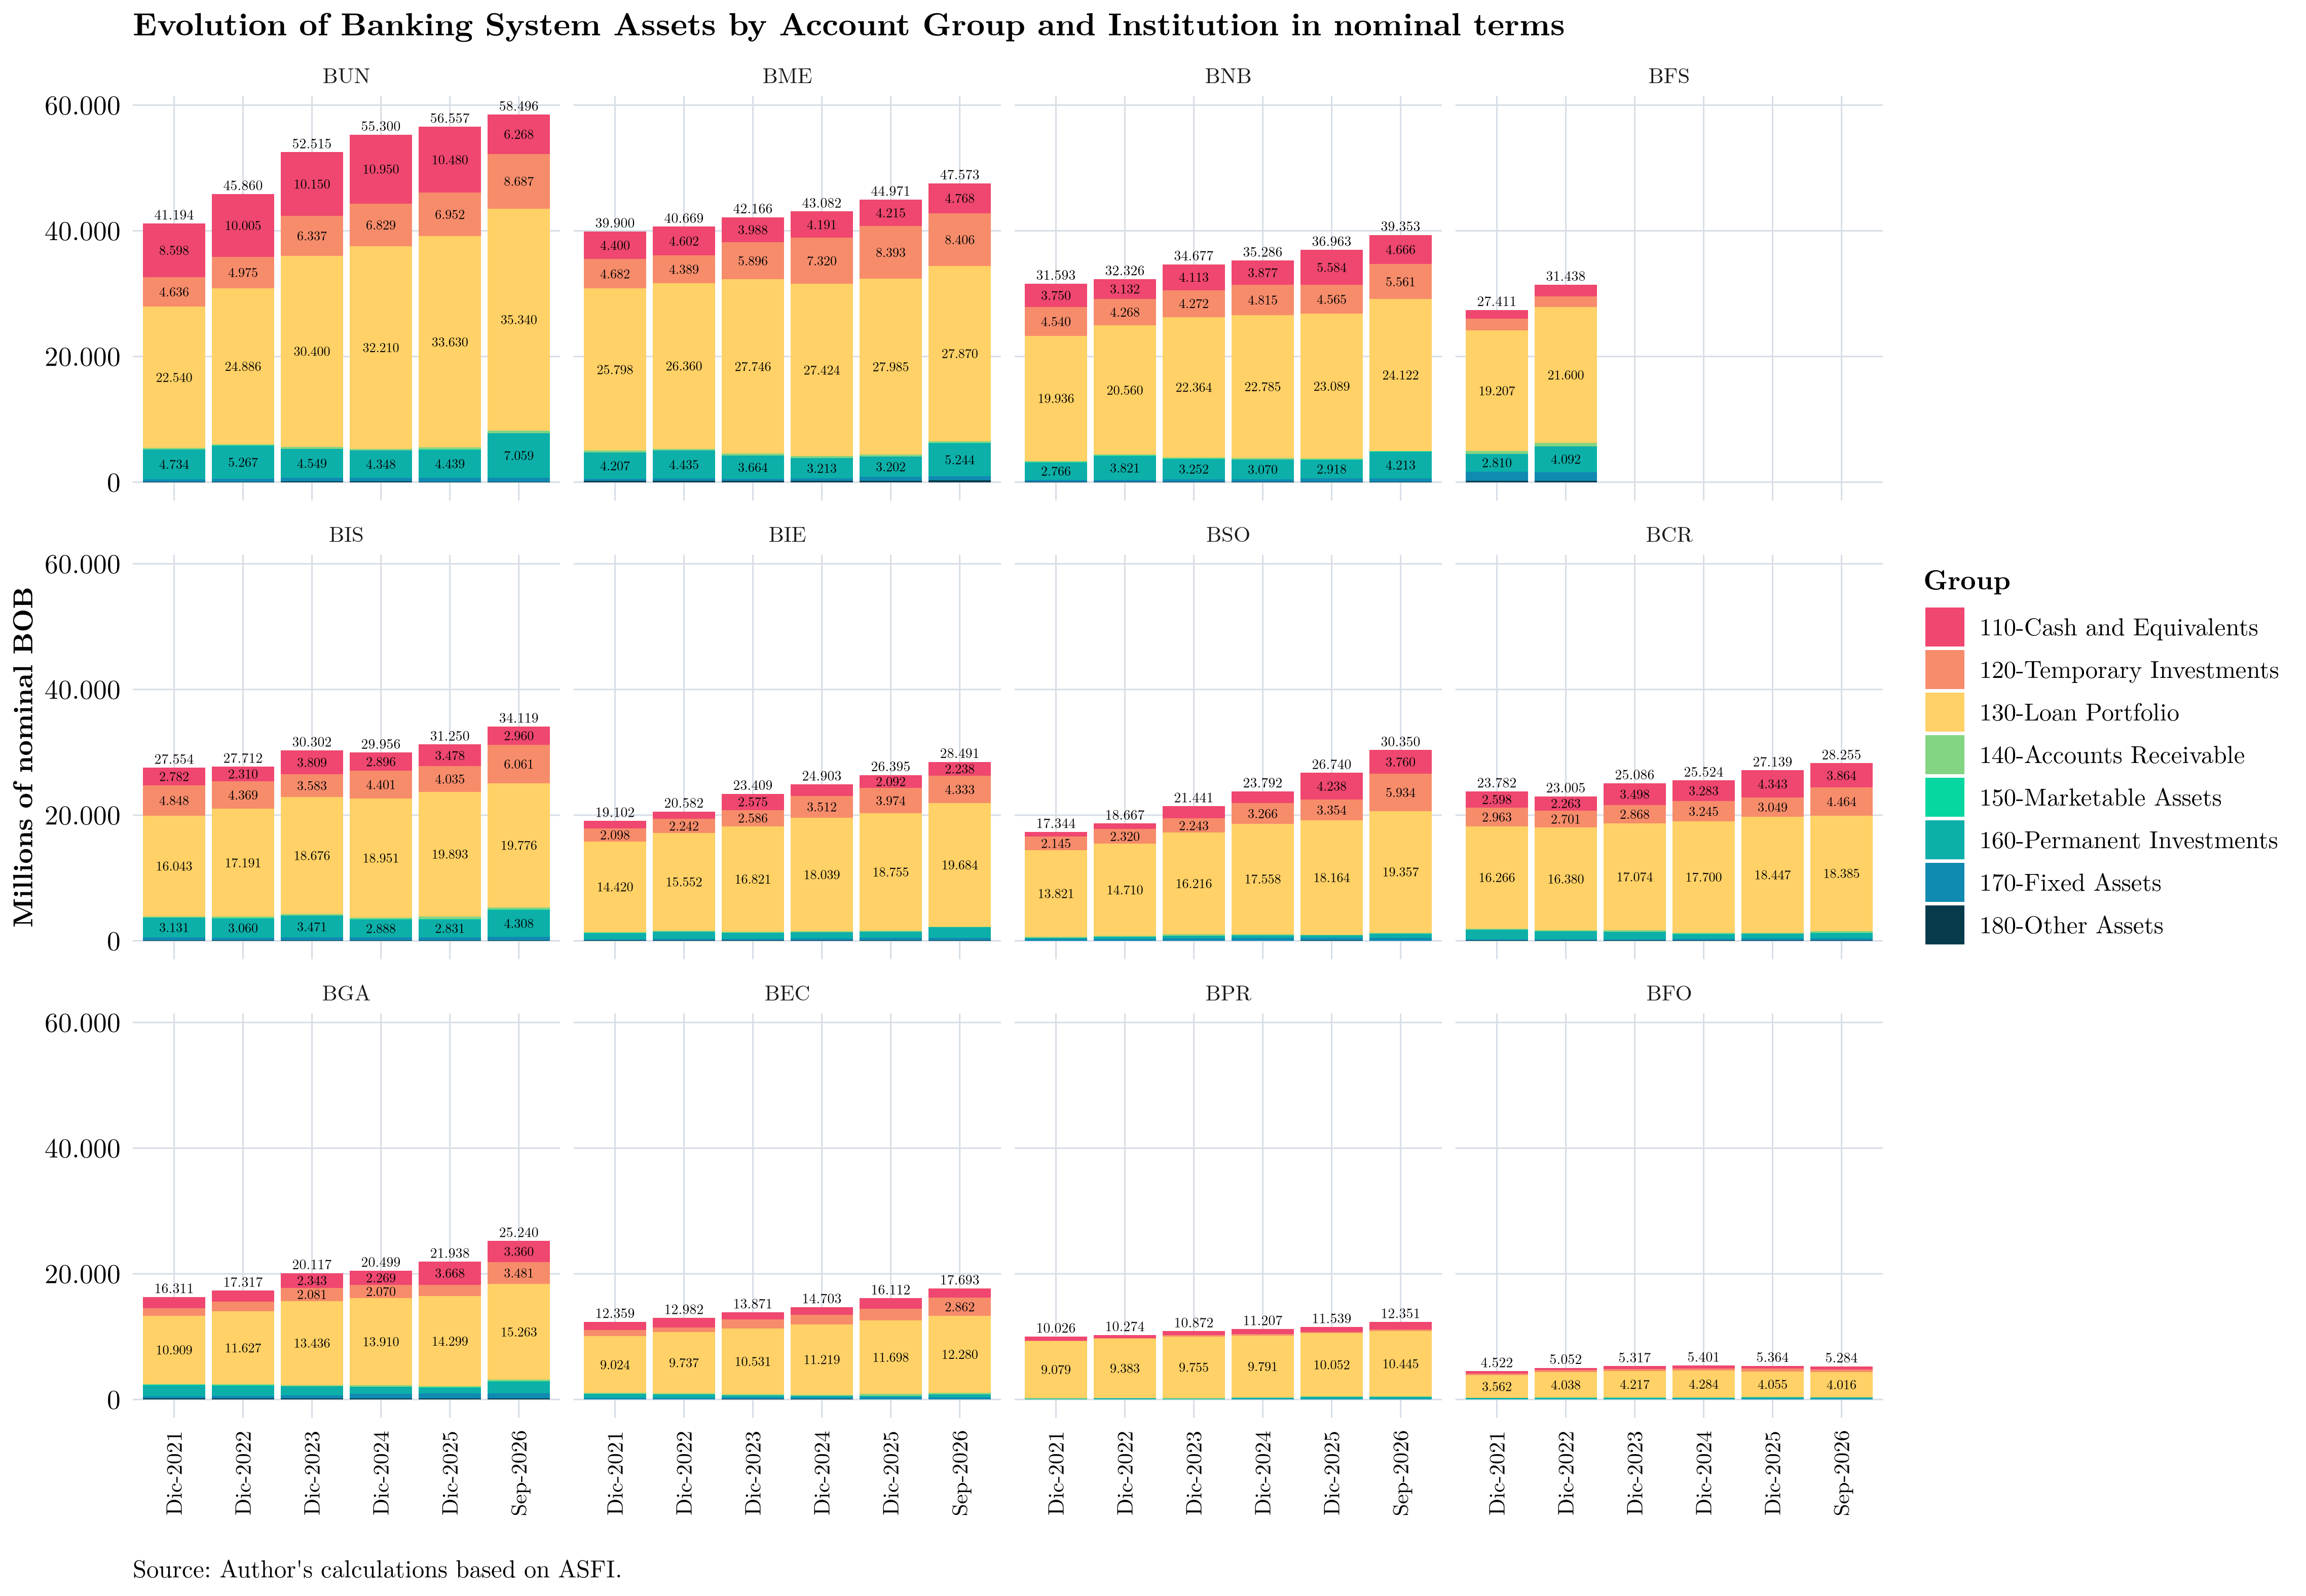
The chart above shows that some institutions have made significant changes to the composition of their assets relative to previous year-end positions, particularly in cash and cash equivalents and short-term investments.
Contributions to Asset Growth
Another way to examine assets is by measuring the contribution of each accounting category to year-on-year growth. This makes it possible to identify which categories are driving asset growth and which are offsetting it. The following chart shows how each accounting category’s contribution to total asset growth has evolved:
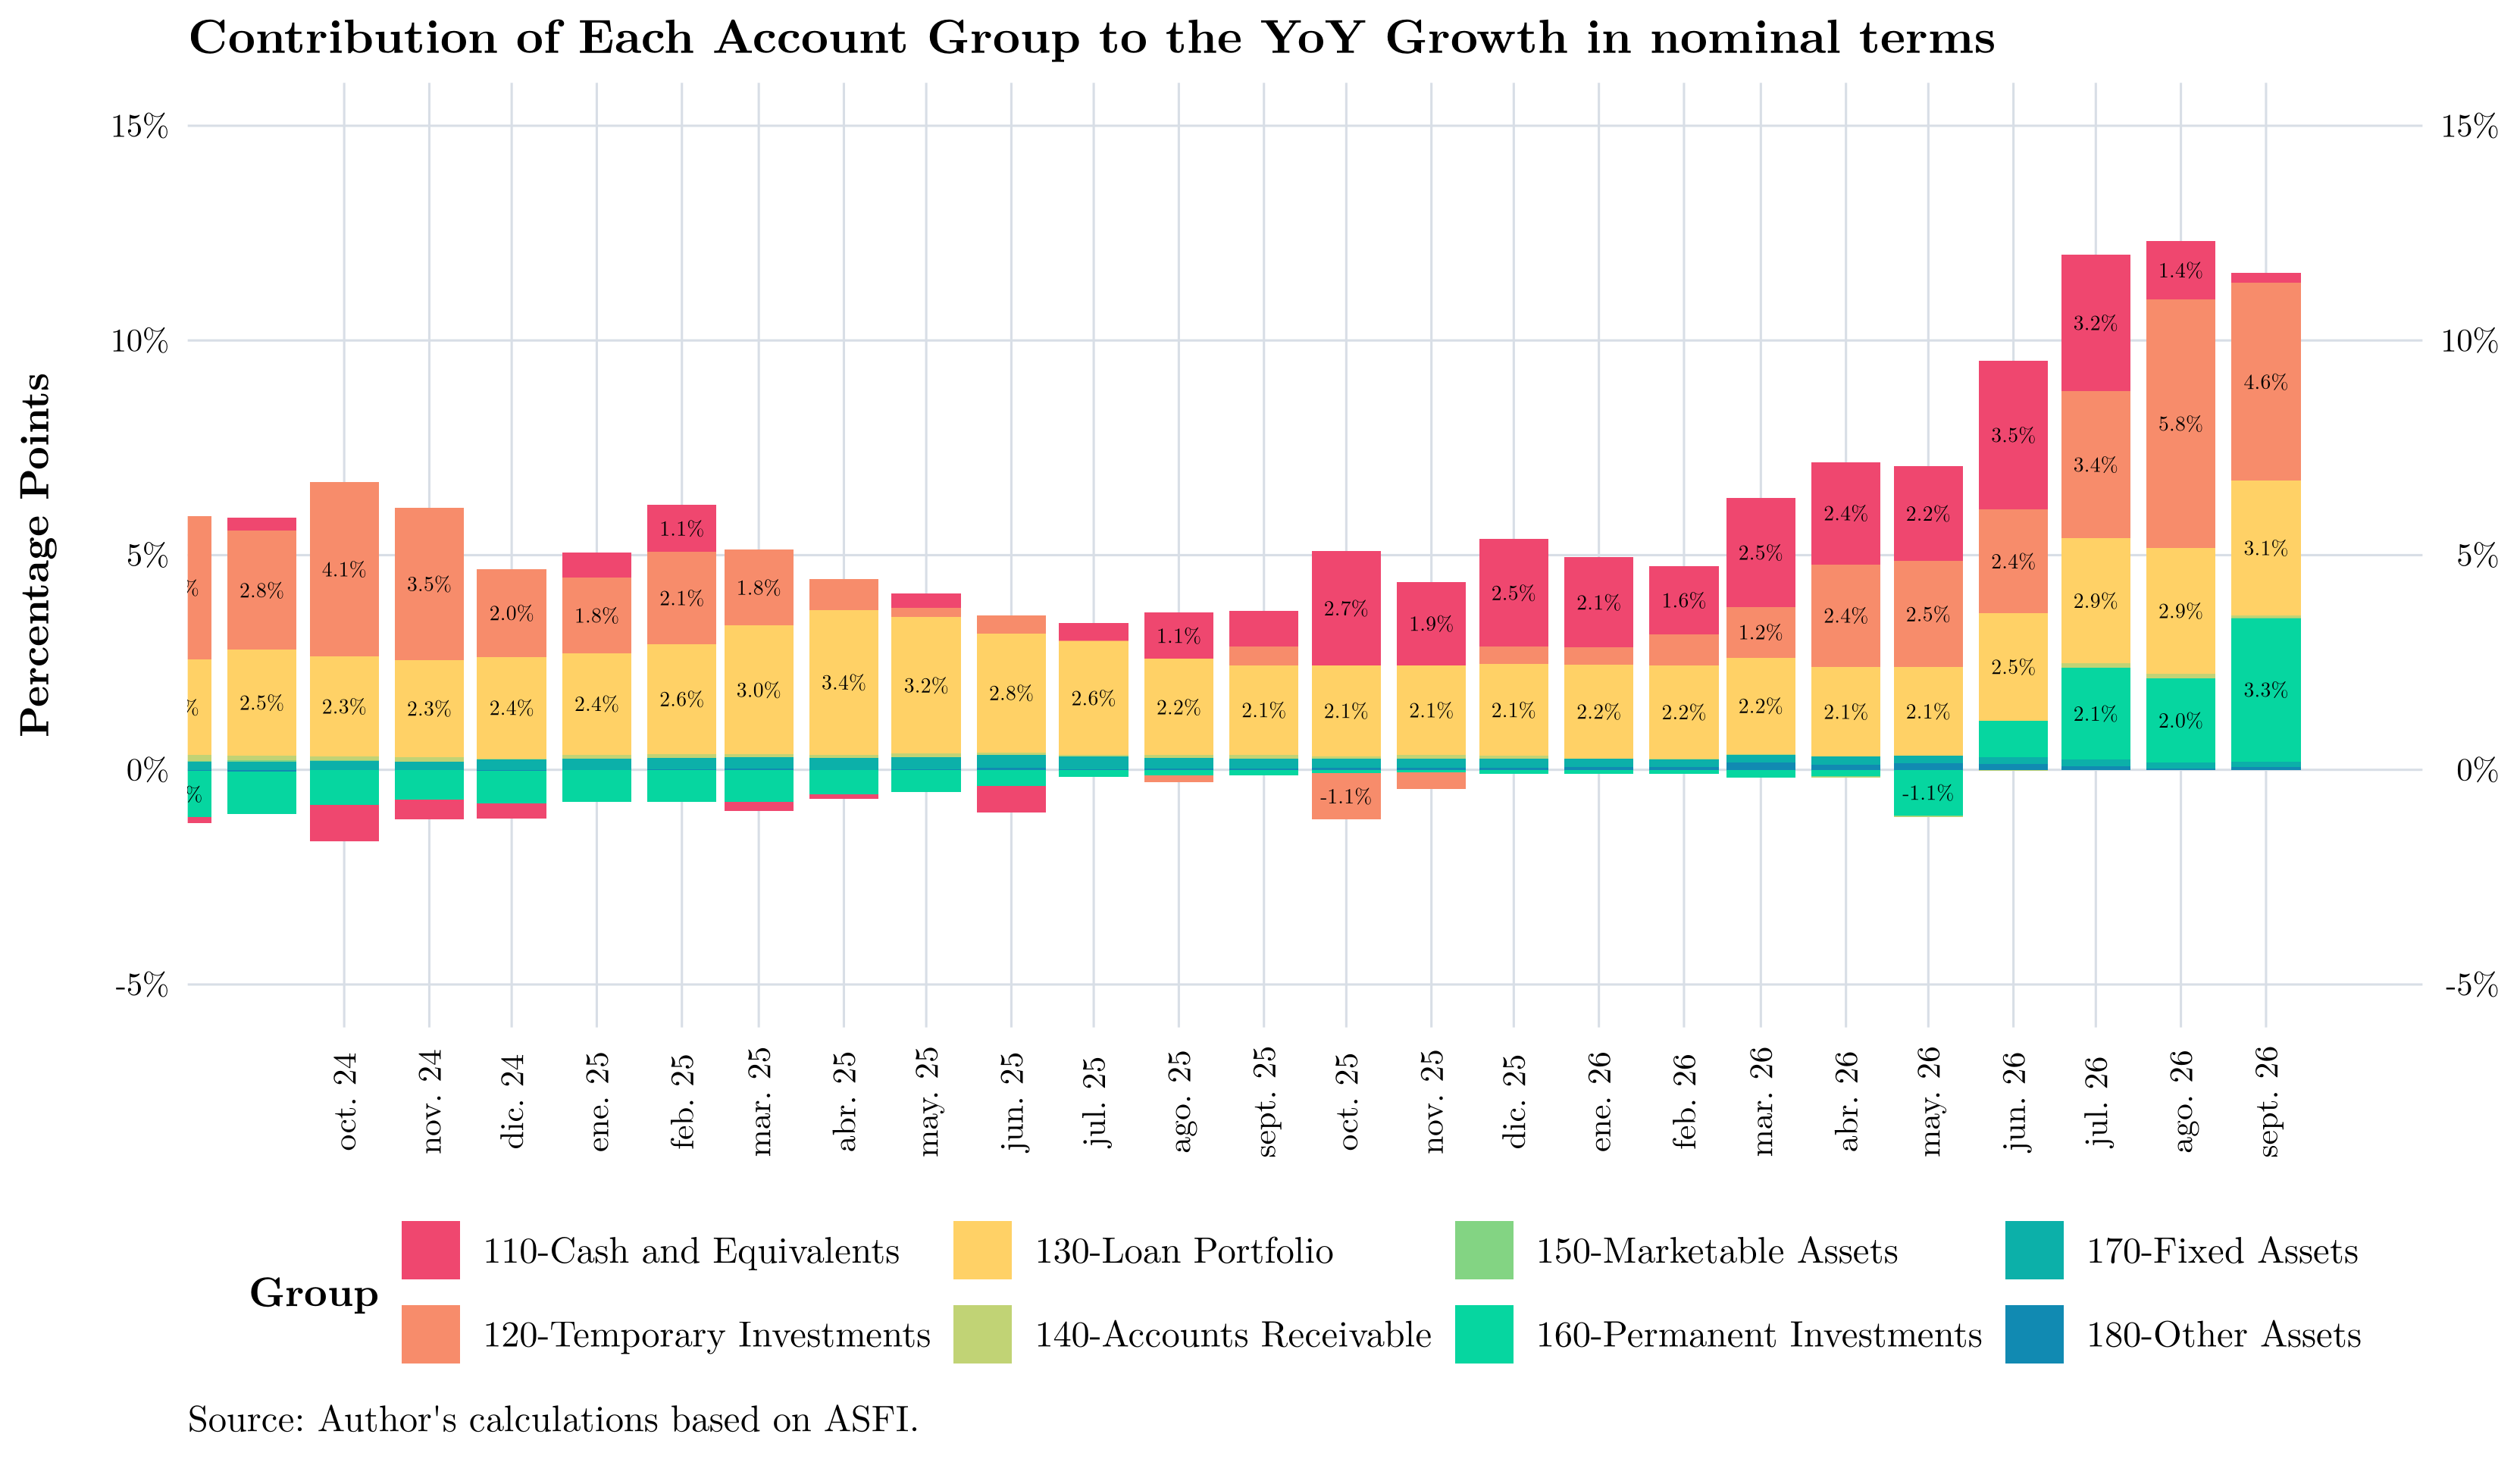
The chart can be interpreted as follows. For example, between September 2025 and September 2026, the year-on-year change in total assets can be broken down by accounting category as follows:
Contribution of each accounting category to nominal year-on-year asset growth
| Accounting category | Contribution |
|---|---|
| 110 — Cash and cash equivalents | 0.2% |
| 120 — Short-term investments | 4.6% |
| 130 — Loan portfolio | 3.1% |
| 140 — Accounts receivable | 0.1% |
| 150 — Assets held for realization | 0.0% |
| 160 — Long-term investments | 3.3% |
| 170 — Property and equipment | 0.1% |
| 180 — Other | 0.1% |
| Total | 11.6% |
What can we infer from this? The following:
- Since approximately August 2025, cash and cash equivalents have made a significant positive contribution to asset growth, indicating that banks have opted to maintain higher liquidity levels.
- Since February 2026, short-term investments have made a positive and increasing contribution to asset growth, indicating that banks have chosen to prioritize returns on the funds they raise at the expense of liquidity.
- Since June 2026, long-term investments have also made a substantial positive contribution.
- The loan portfolio has maintained a stable, positive contribution of around 2.5% to year-on-year asset growth, indicating that banks have maintained a stable level of financial intermediation.
Cash and Cash Equivalents
According to ASFI’s Chart of Accounts Manual for Financial Institutions (Manual de Cuentas para Entidades Financieras), account 110.00, the Cash and Cash Equivalents category, is defined as follows:
Represents the cash held by the institution on hand; demand balances at the Central Bank of Bolivia, at its head office and foreign branches, and with domestic and foreign banks and correspondent banks; as well as holdings of precious metals. It also represents checks and other commercial documents available for immediate collection.
Relative to the previous month, cash and cash equivalents decreased by BOB 1,695 million (-4.6%); relative to the previous quarter, they fell by BOB 2,945 million (-7.7%); and relative to the same month of the previous year, they rose by BOB 671 million (1.9%).
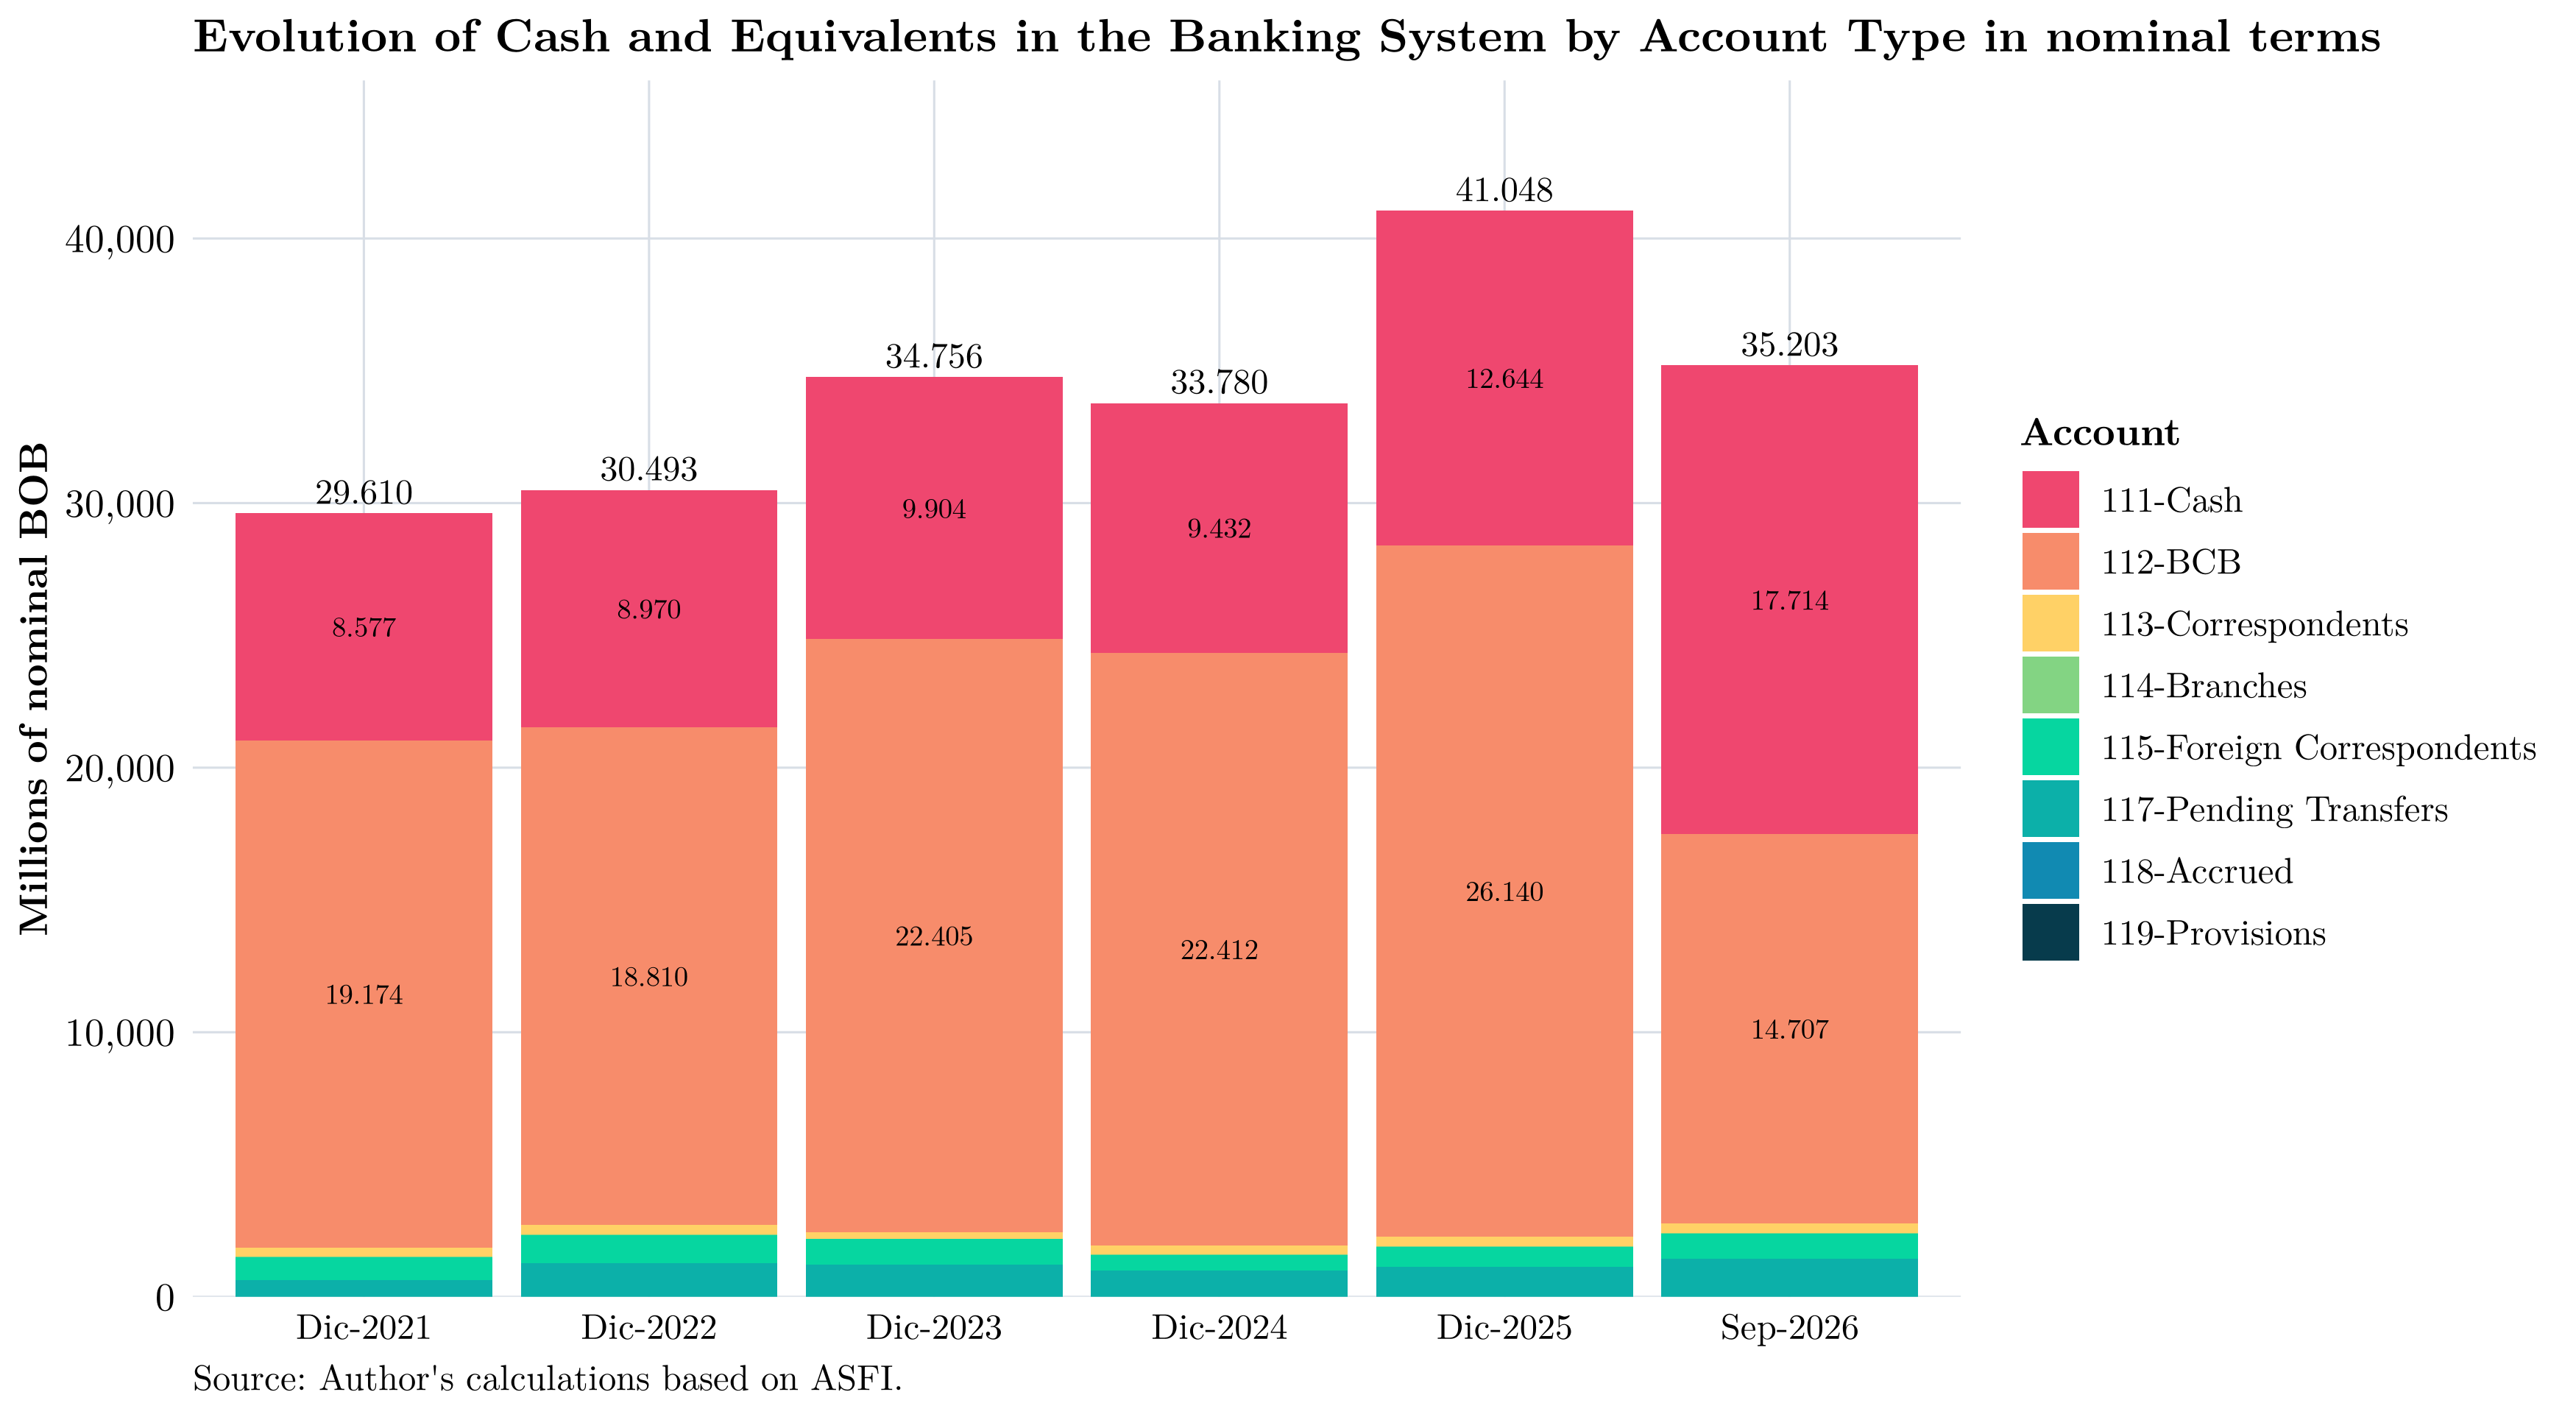
Let us examine how the composition of cash and cash equivalents has evolved over time by breaking down the accounts included in category 110.00.
Composition
As shown in the following chart, banking-system cash and cash equivalents have remained relatively stable at around BOB 34,000 million, approximately 30% of which has been held as physical cash to support daily operations (withdrawals, ATMs, etc.). The chart also shows that, relative to December of last year, cash and cash equivalents have fallen considerably, mainly because of lower demand balances held at the Central Bank of Bolivia.
By institution:
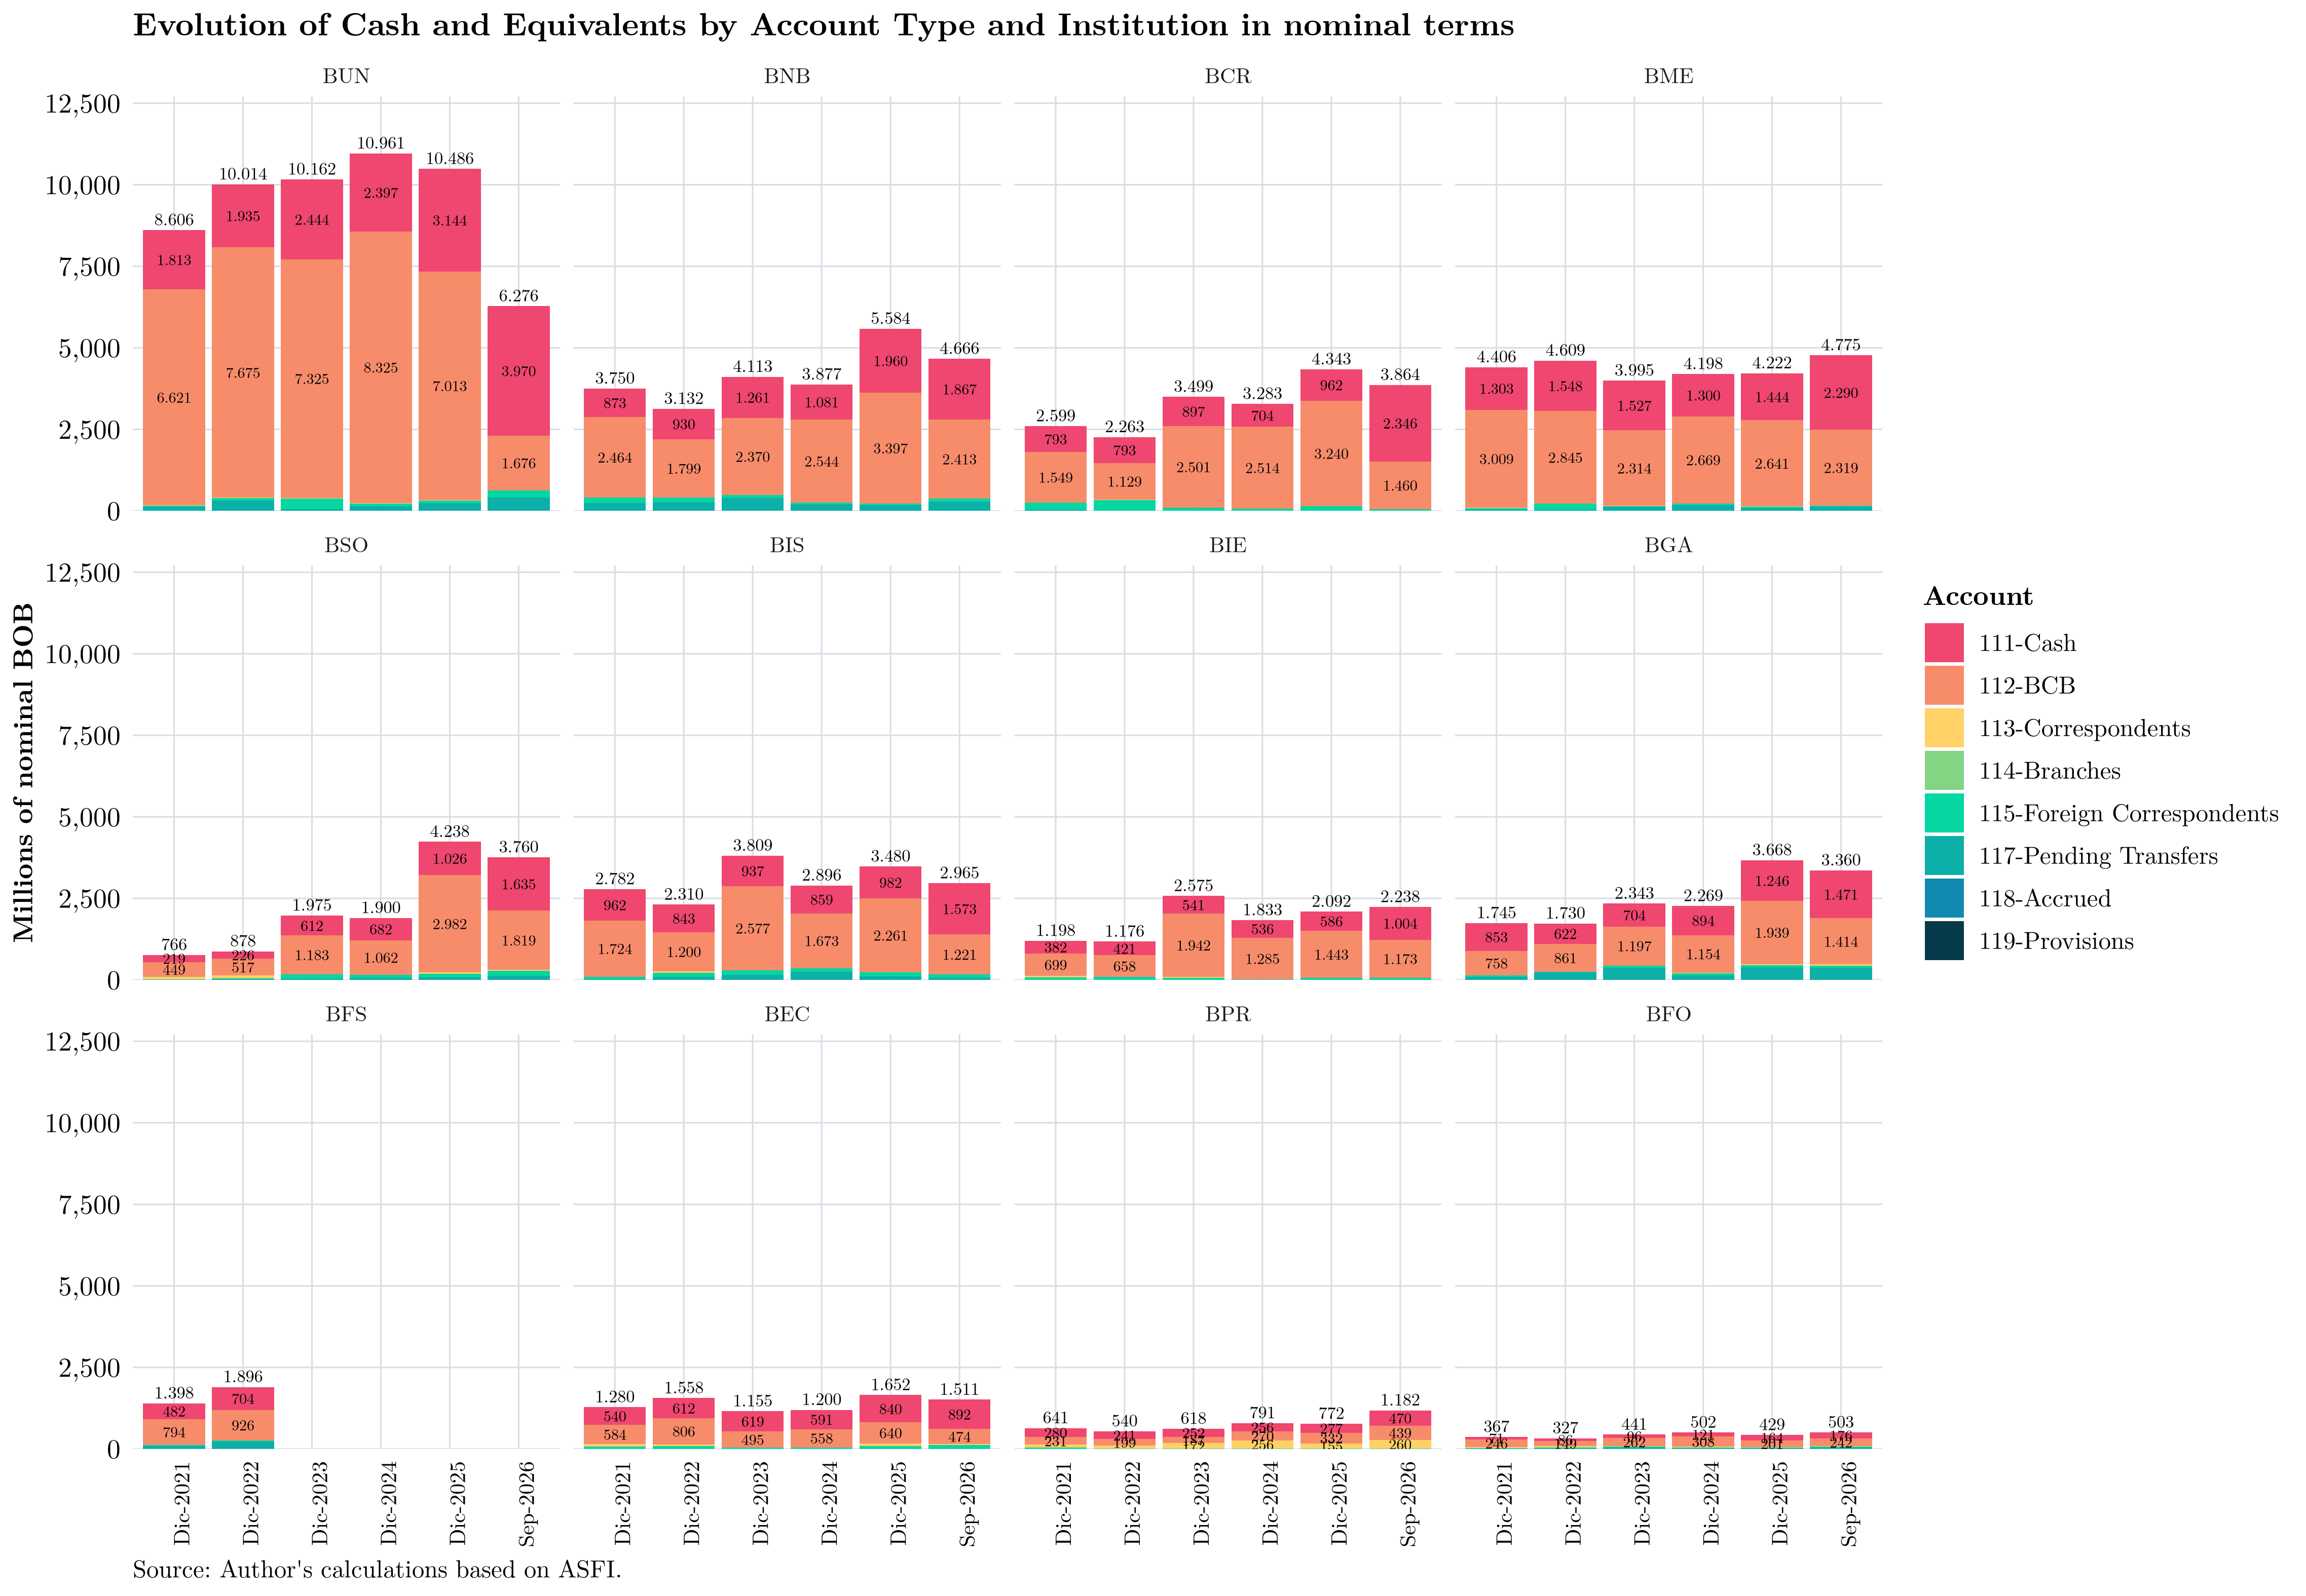
The preceding chart suggests that several institutions have significantly changed their cash and cash-equivalent positions relative to previous year-end levels. These changes should be considered alongside the shift toward short-term investments and other liquid assets.
By Currency
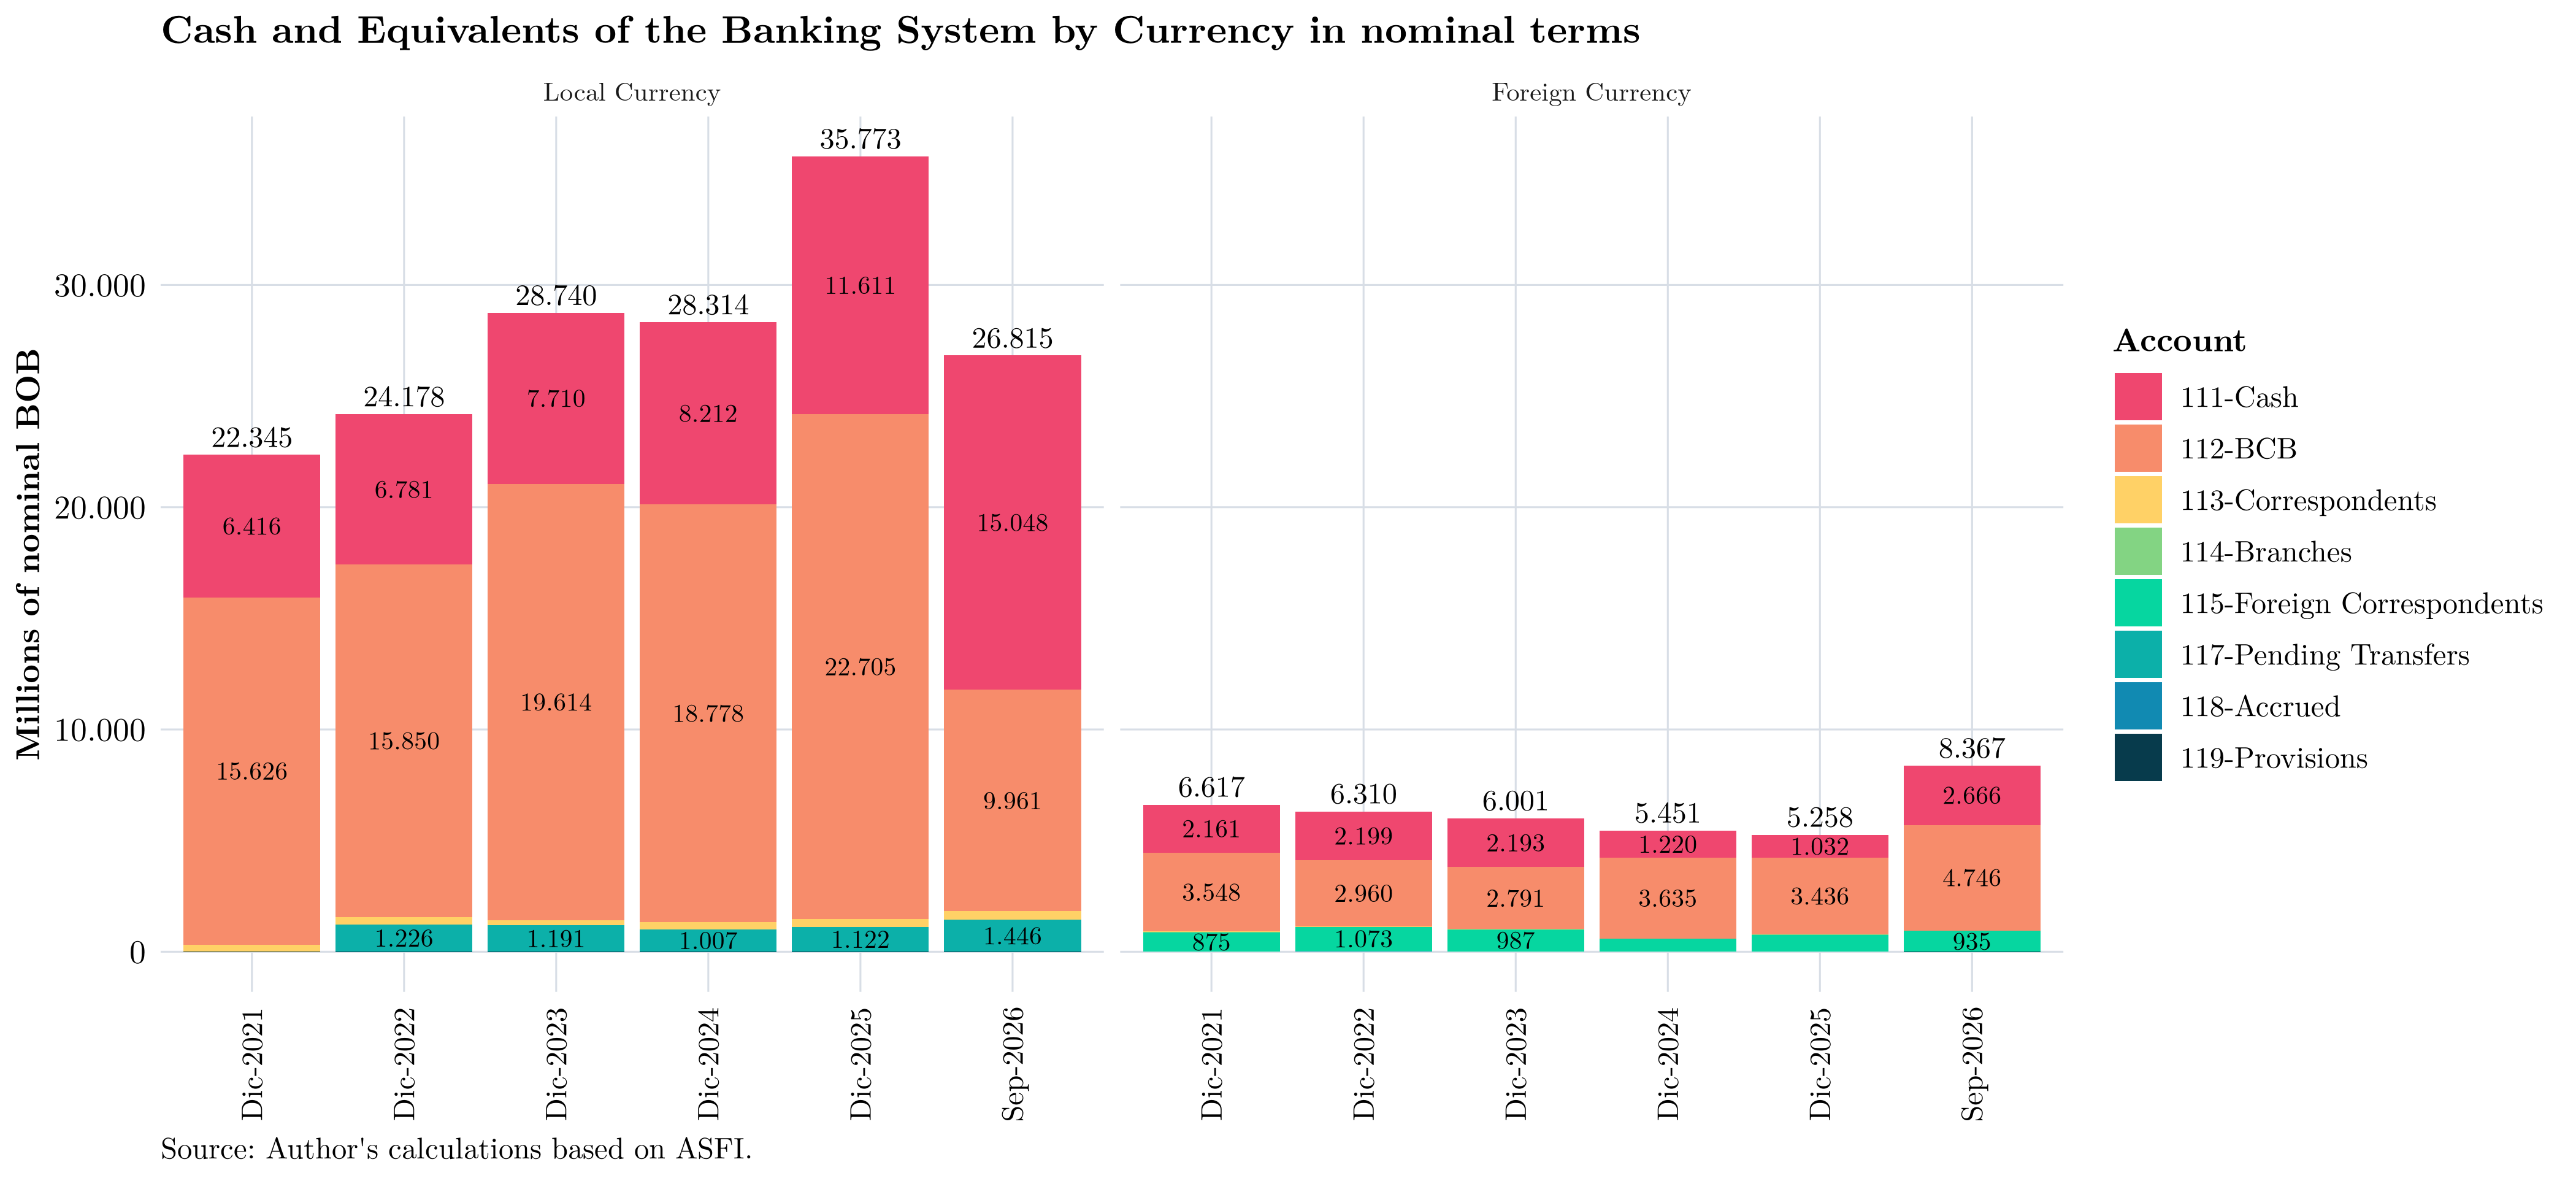
Another way to examine the composition of cash and cash equivalents is by the currency in which they are held. The following chart shows their evolution by currency. Note that, owing to the depreciation of the boliviano against the US dollar, foreign-currency cash and cash equivalents have grown significantly in nominal terms, while domestic-currency holdings have declined relative to December of last year, mainly because of lower demand balances held at the Central Bank of Bolivia.
Short-Term Investments
According to ASFI’s Chart of Accounts Manual for Financial Institutions, account 120.00, the Short-Term Investments category, comprises:
Investments in deposits with other “financial intermediation institutions,” deposits with the Central Bank of Bolivia, and debt securities acquired by the institution. These investments are made in accordance with its investment policy with the aim of earning an adequate return on temporary liquidity surpluses, and they must be convertible into cash and cash equivalents within no more than thirty (30) days.
For accounting purposes, short-term investments correspond to account 120.00. Relative to the previous month, short-term investments decreased by BOB 1,972 million (-3.8%); relative to the previous quarter, they increased by BOB 6,256 million (14.2%); and relative to the same month of the previous year, they rose by BOB 13,495 million (36.5%).
We examine these investments in greater detail below.
Composition
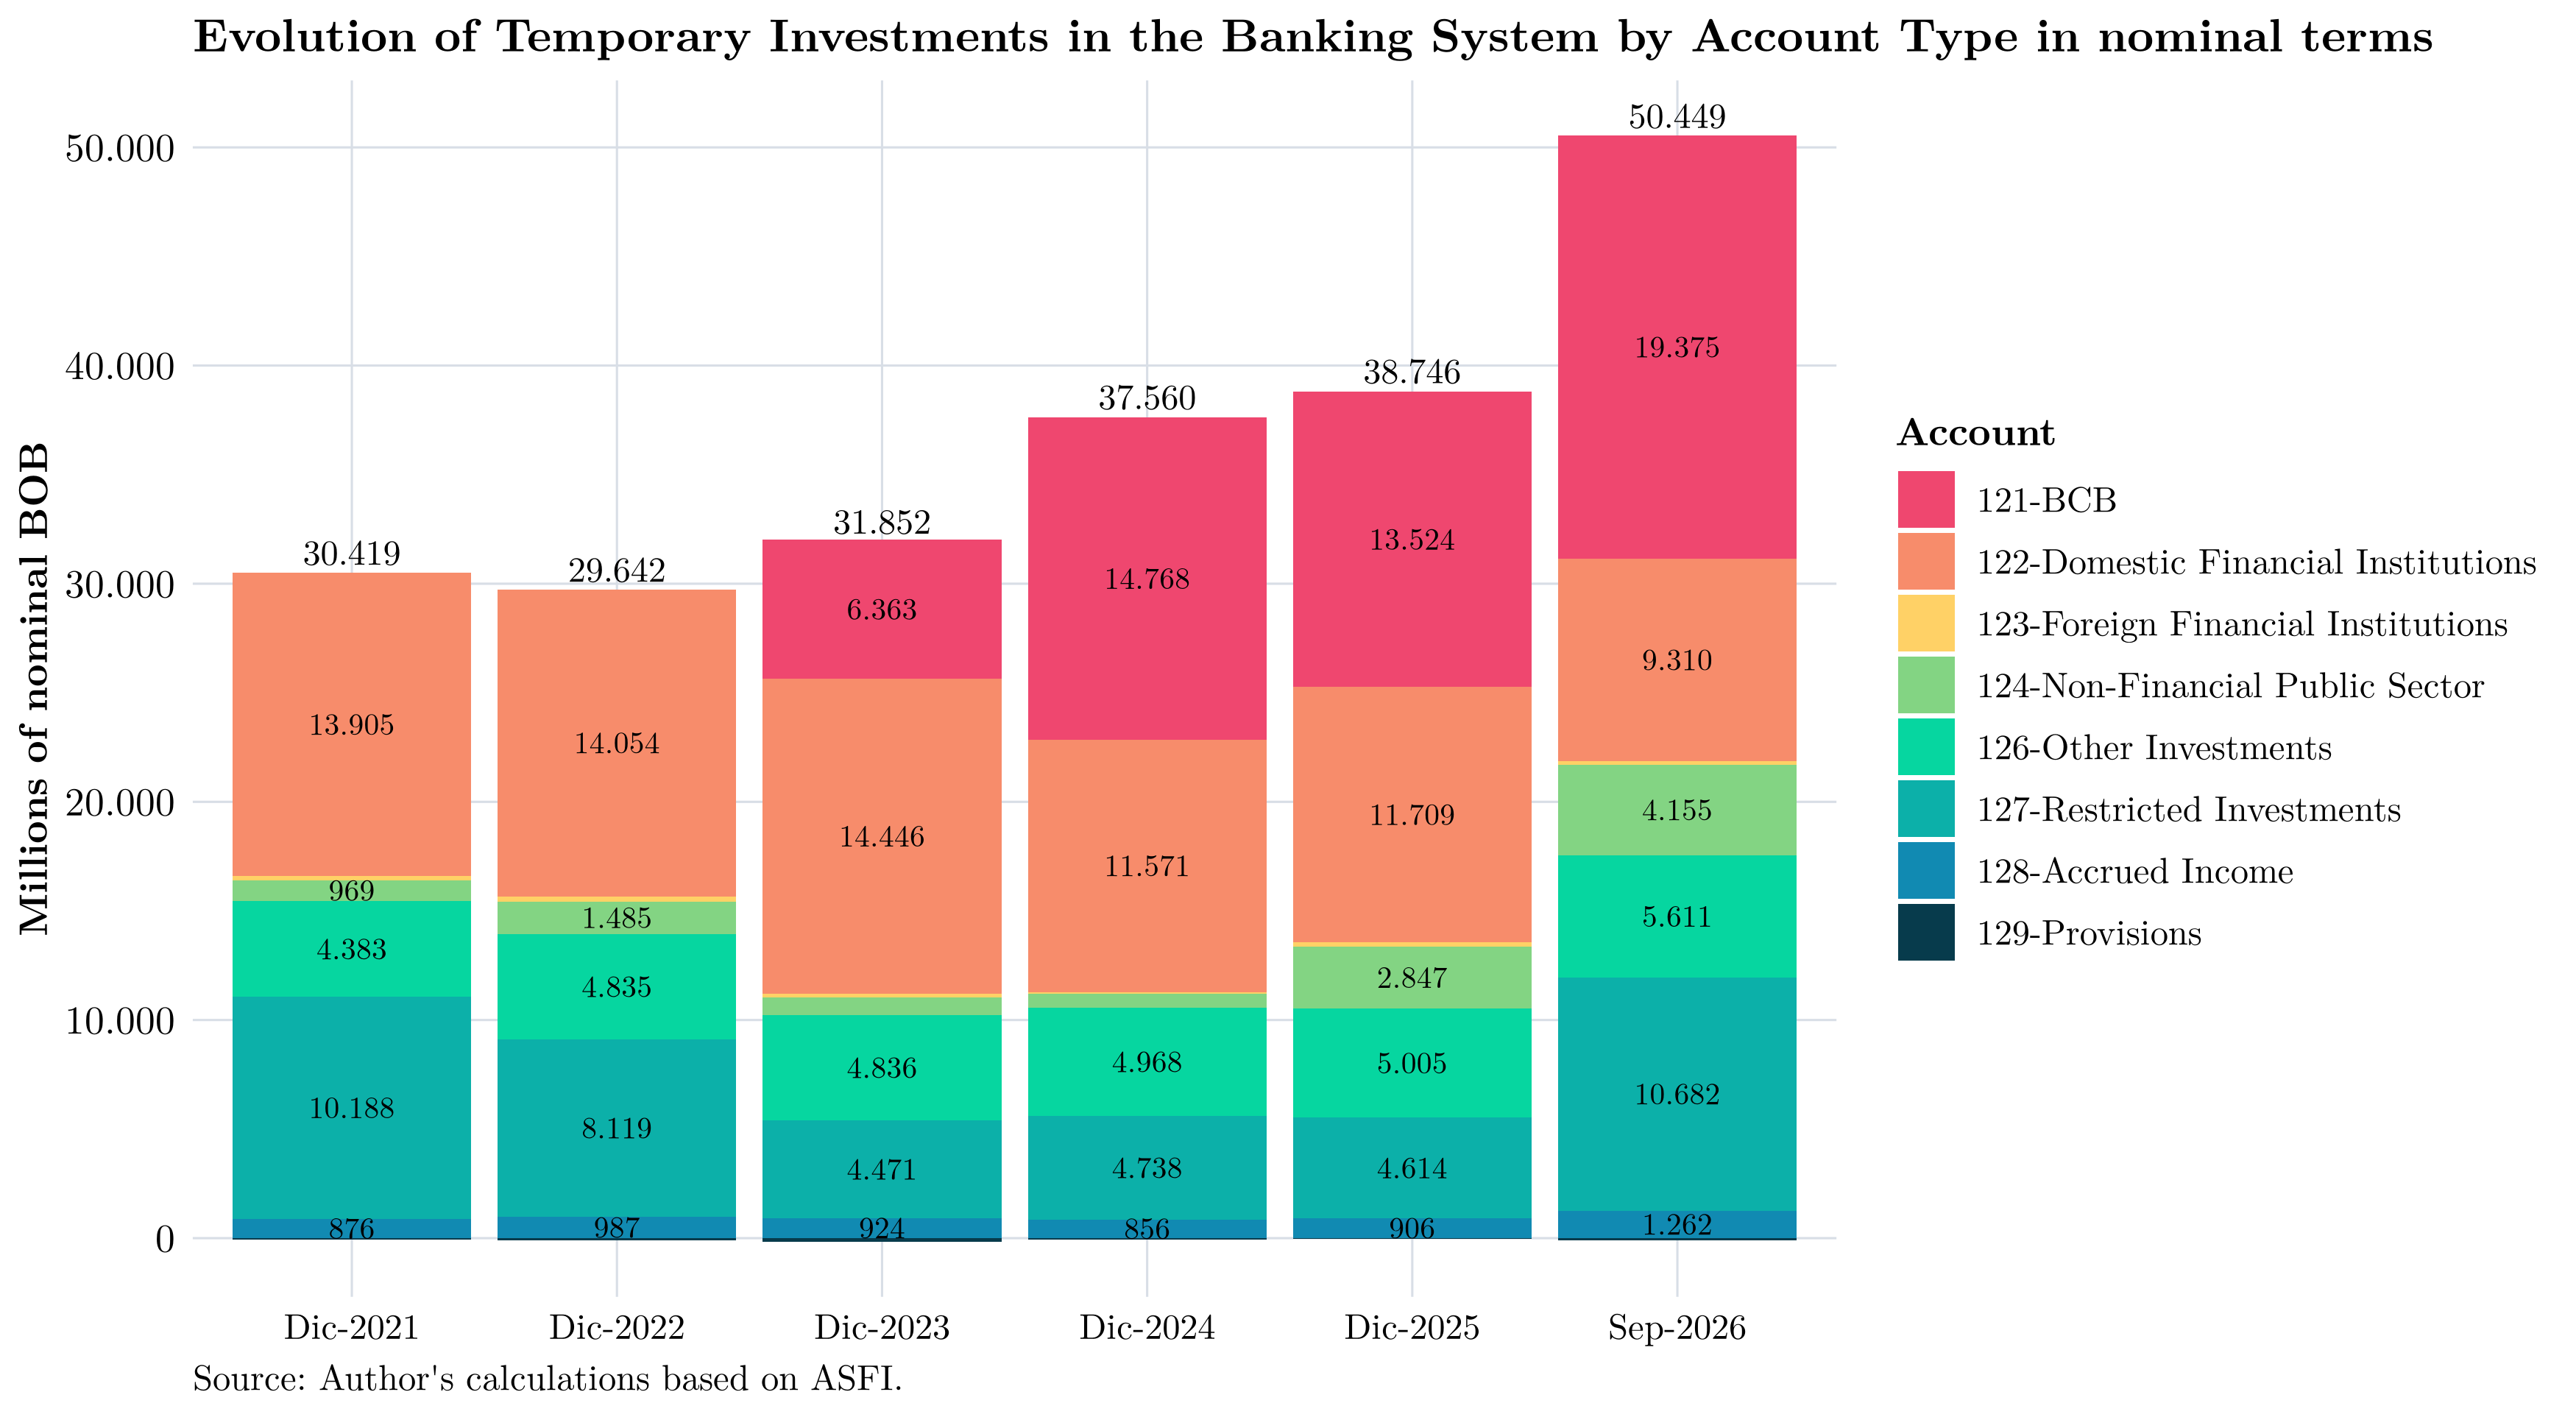
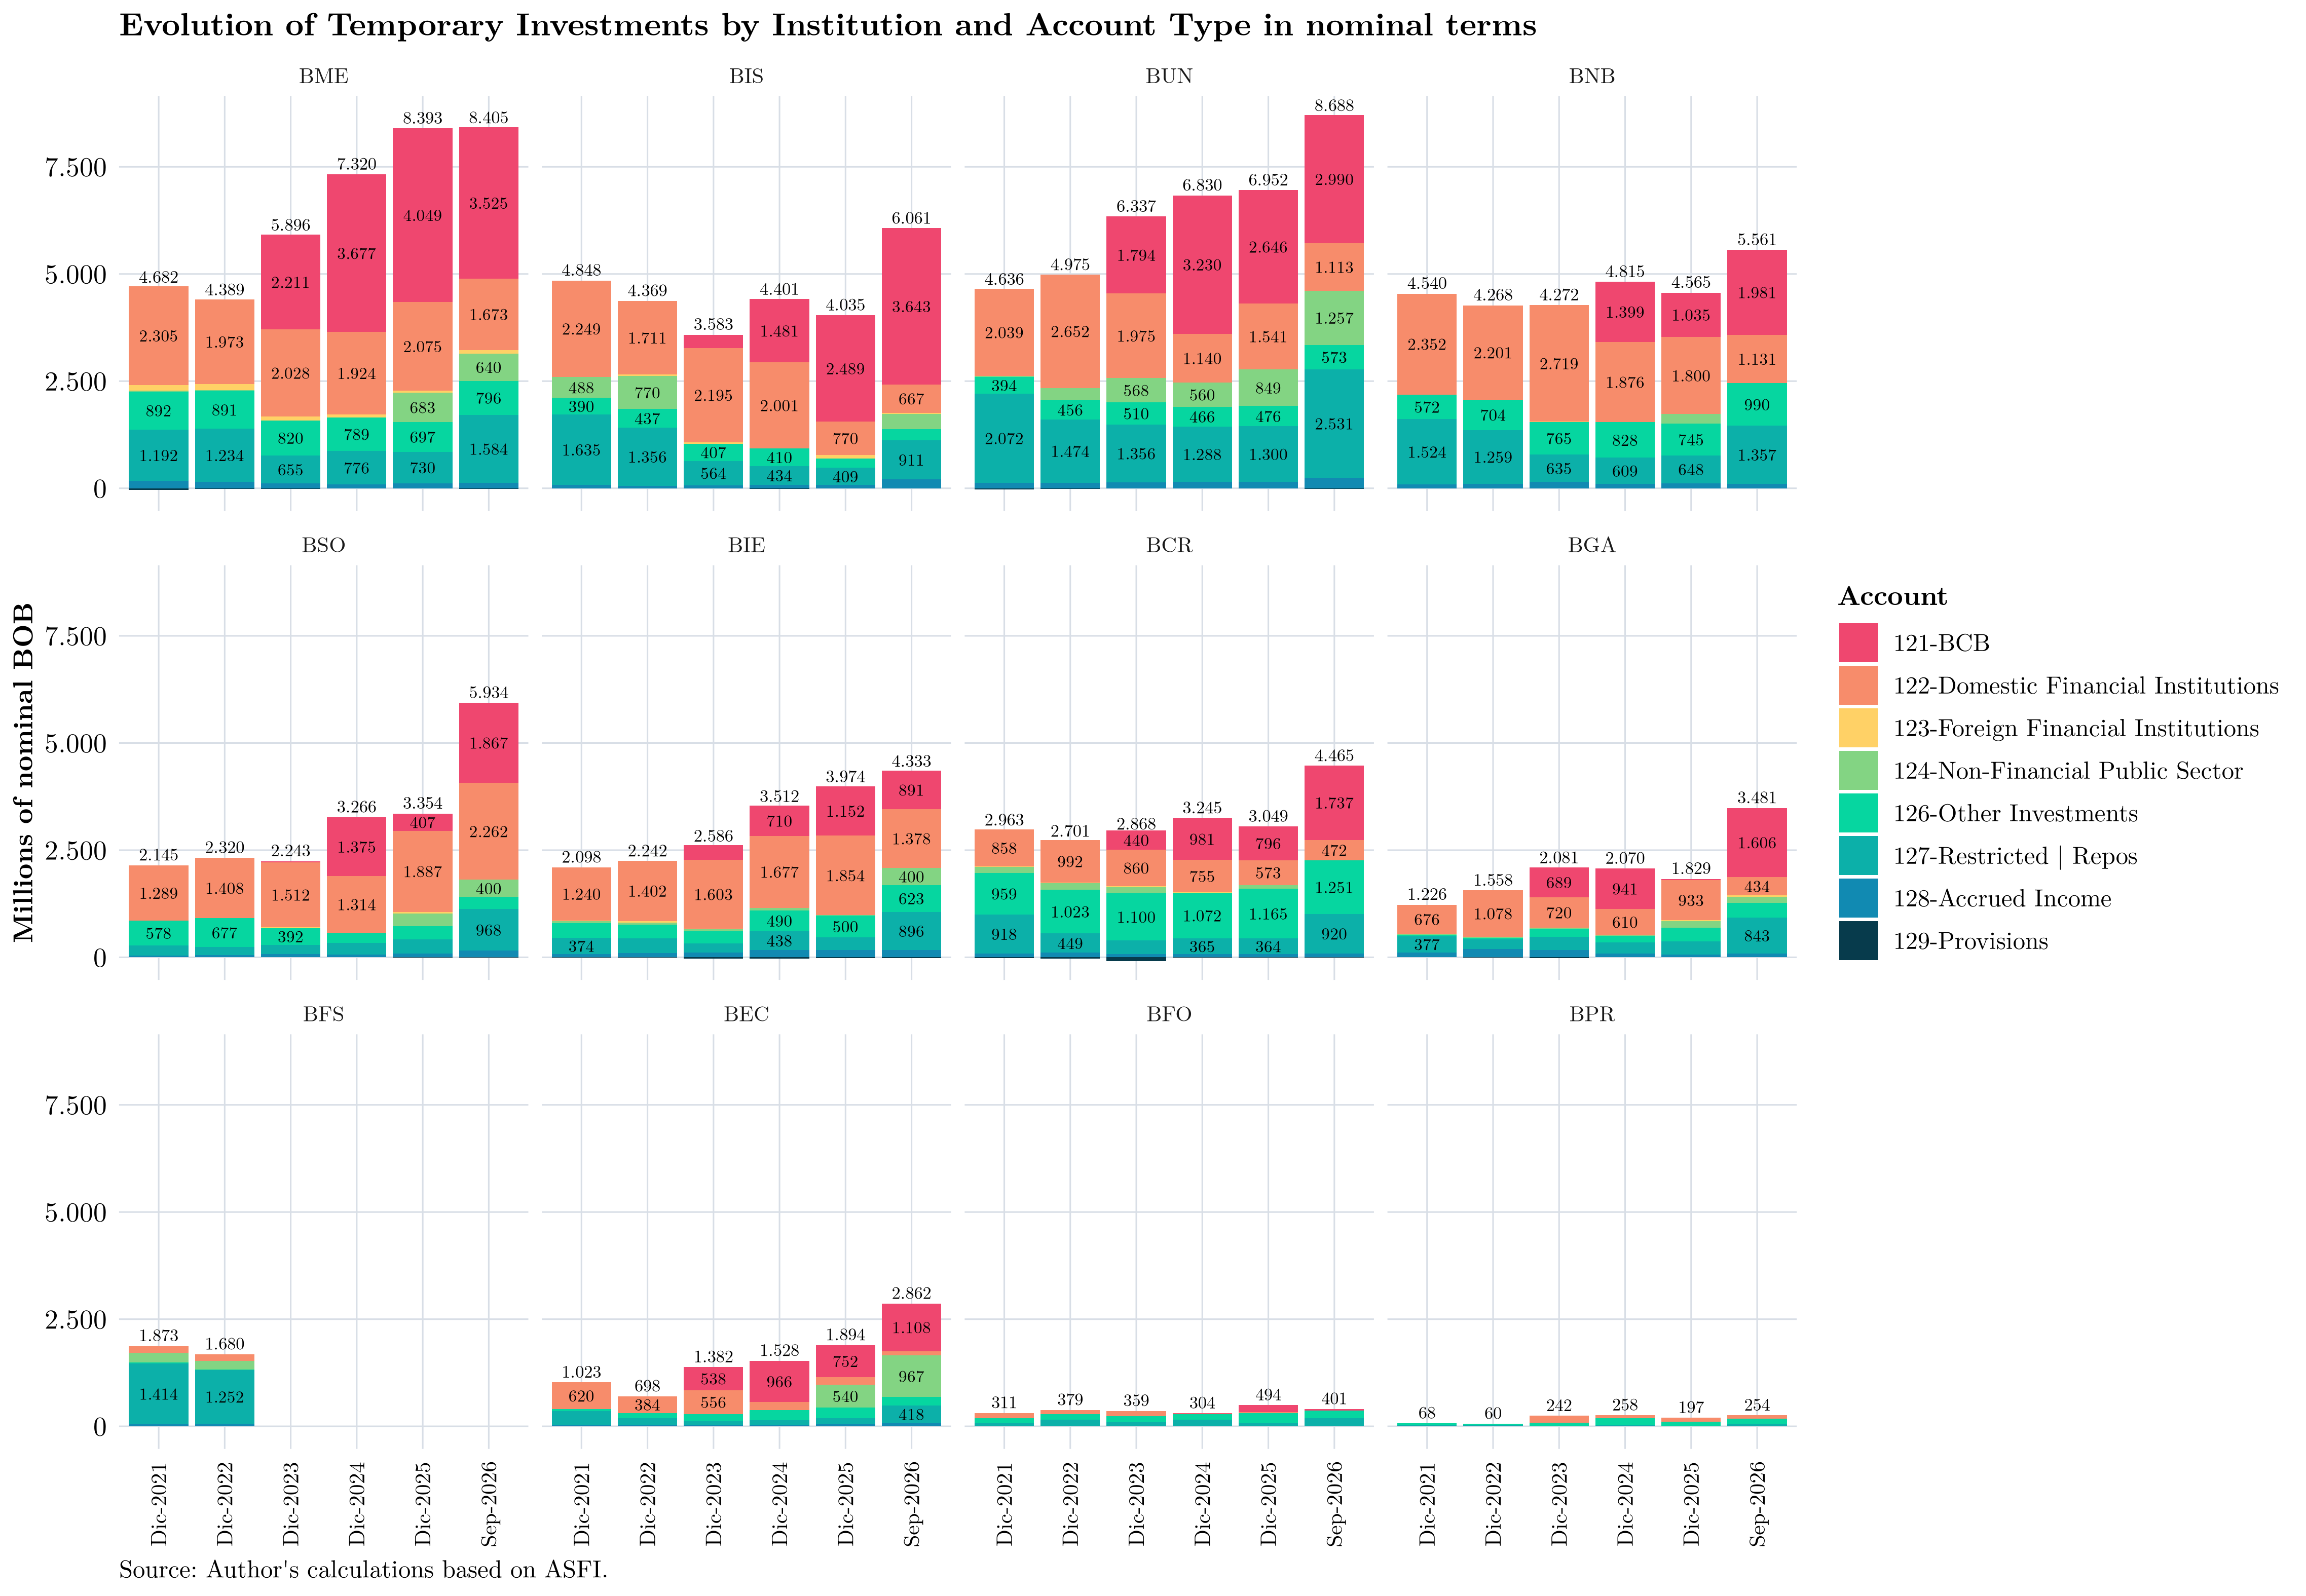
The following chart shows the composition of short-term investments at year-end and in the latest available month. As noted earlier, exposure to BCB instruments has increased—possibly owing to the freezing of 3% of certain deposits, acting as a form of temporary additional reserve requirement—as has exposure to public-sector instruments relative to recent year-ends. There have also been movements in account 124, which records investments in debt securities issued by domestic non-financial public entities (Treasury bills, bonds, and other securities issued by the General Treasury of the Nation, etc.), and account 127, which records restricted-availability investments, primarily securities sold under repurchase agreements (repos).
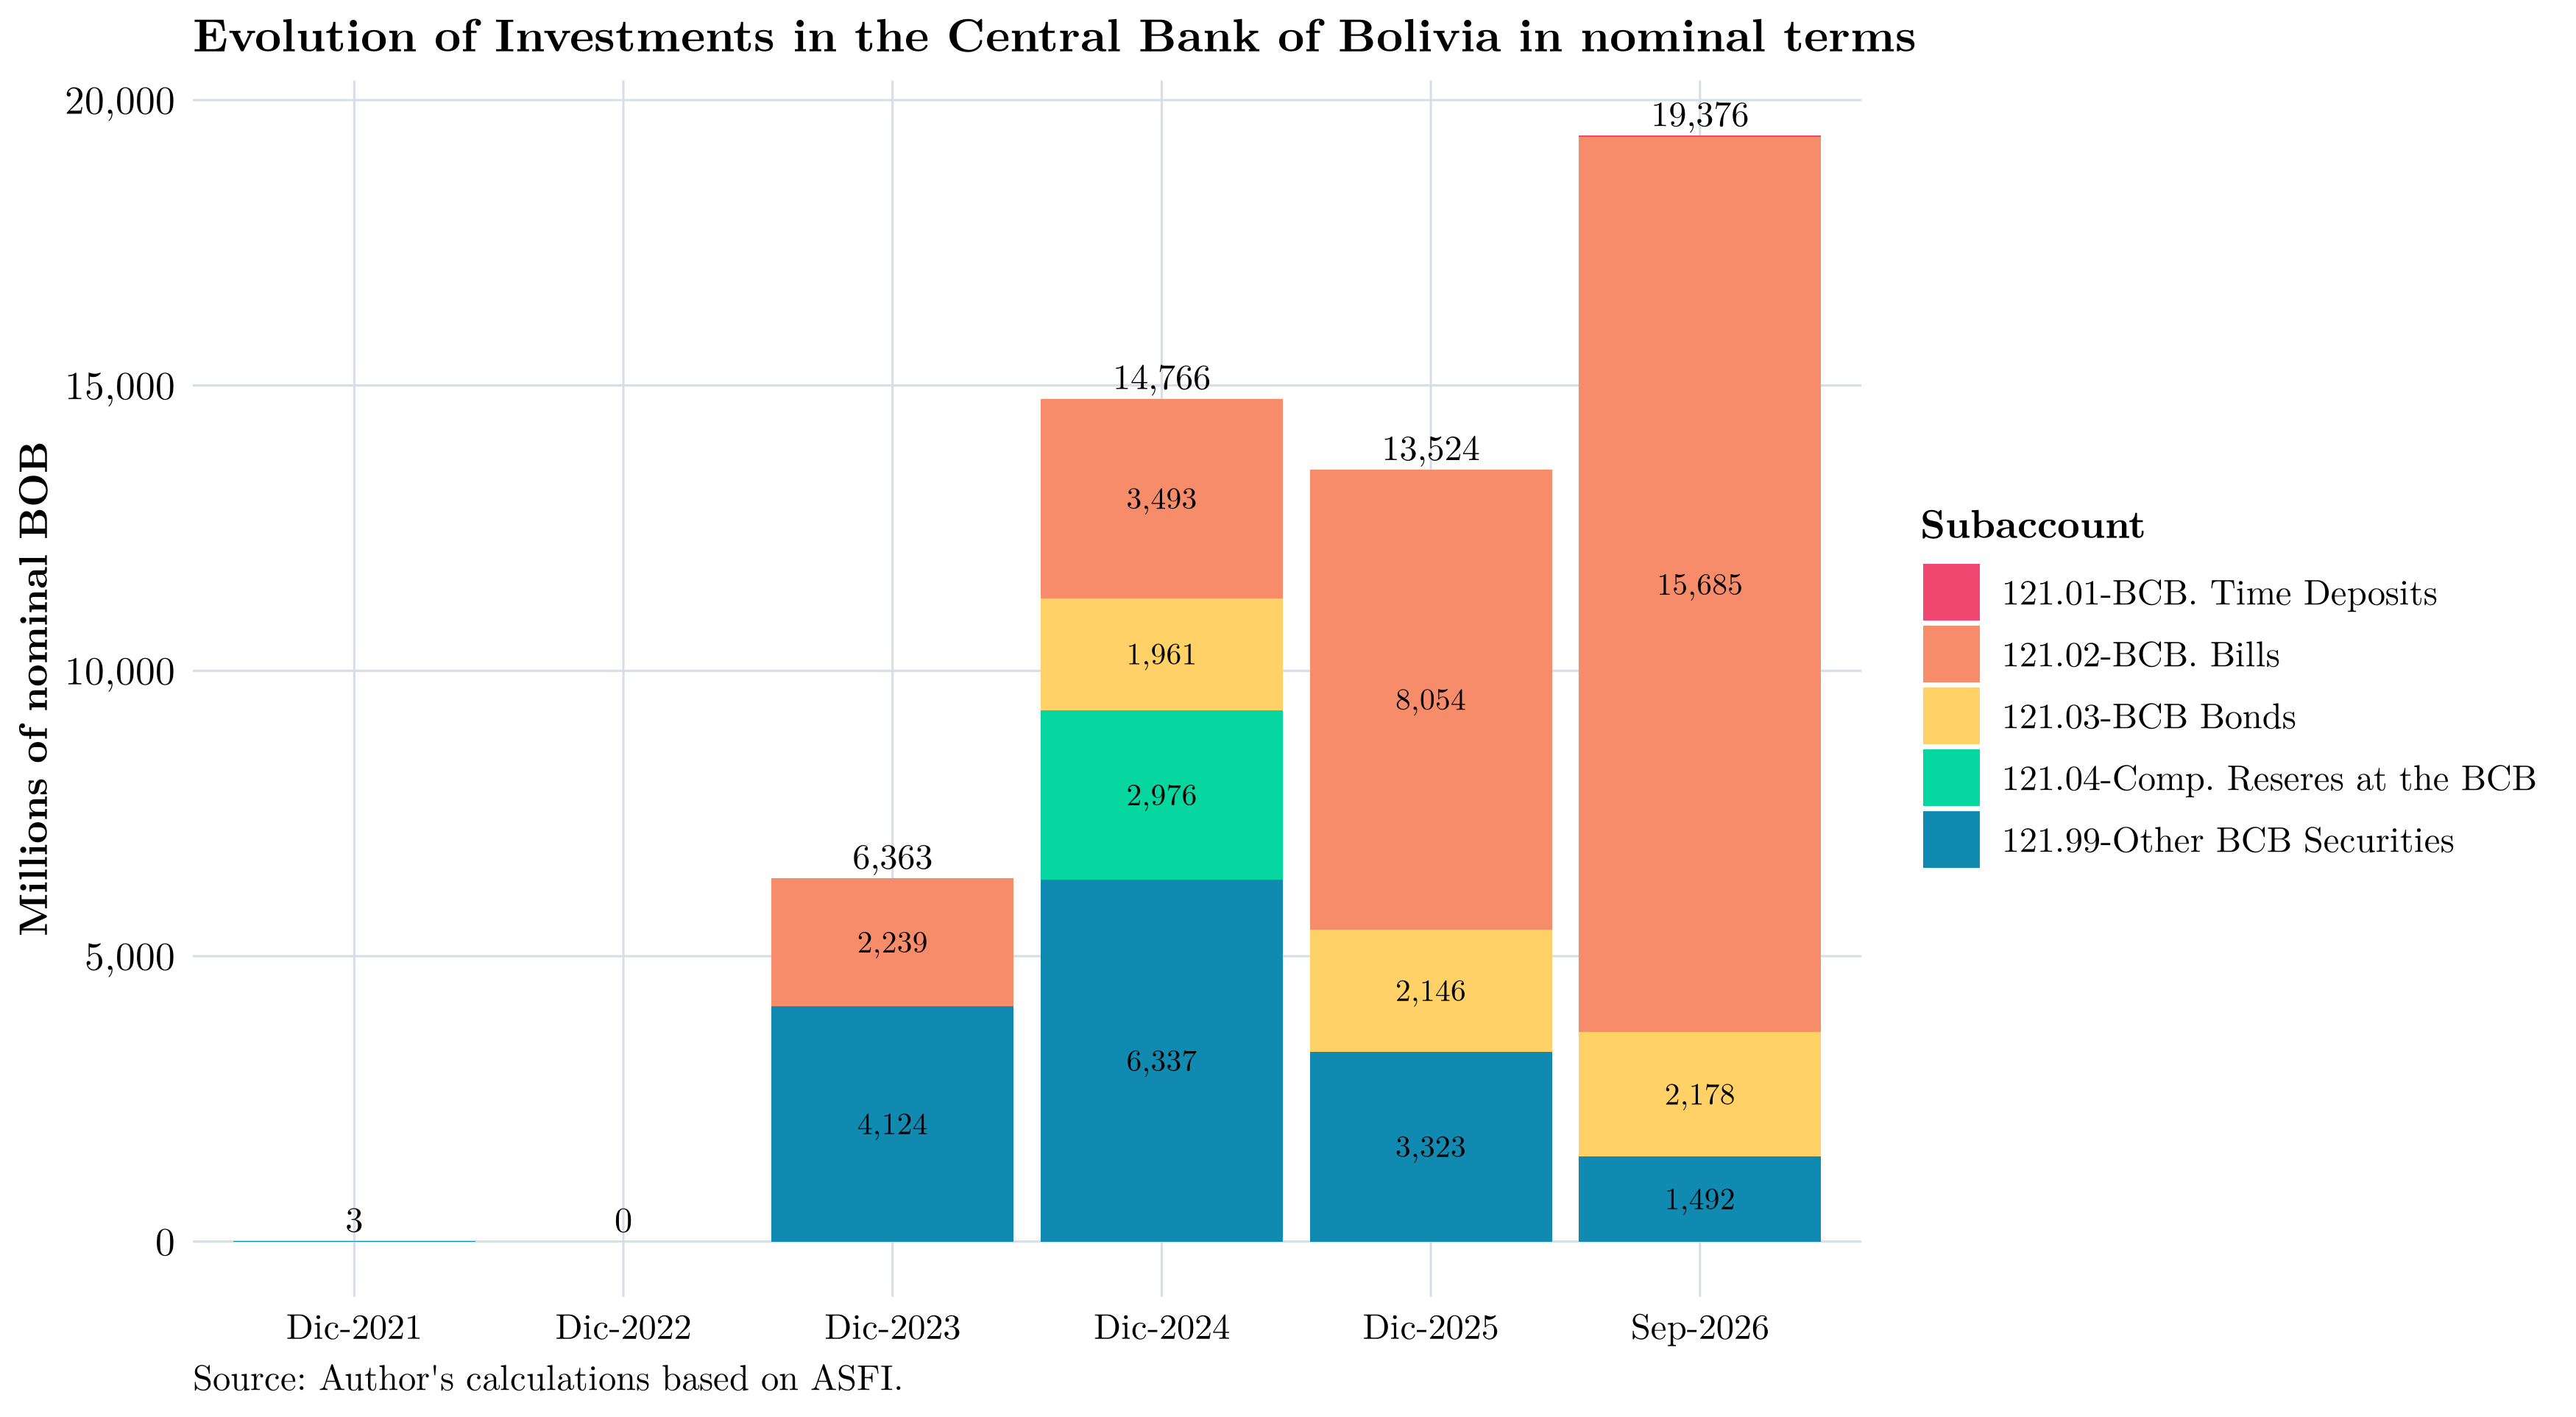
Account 121.00, which records investments with the Central Bank of Bolivia, is broken down into term deposits, bills, bonds, supplementary reserves, and other BCB securities. The following chart shows the evolution of these subaccounts:
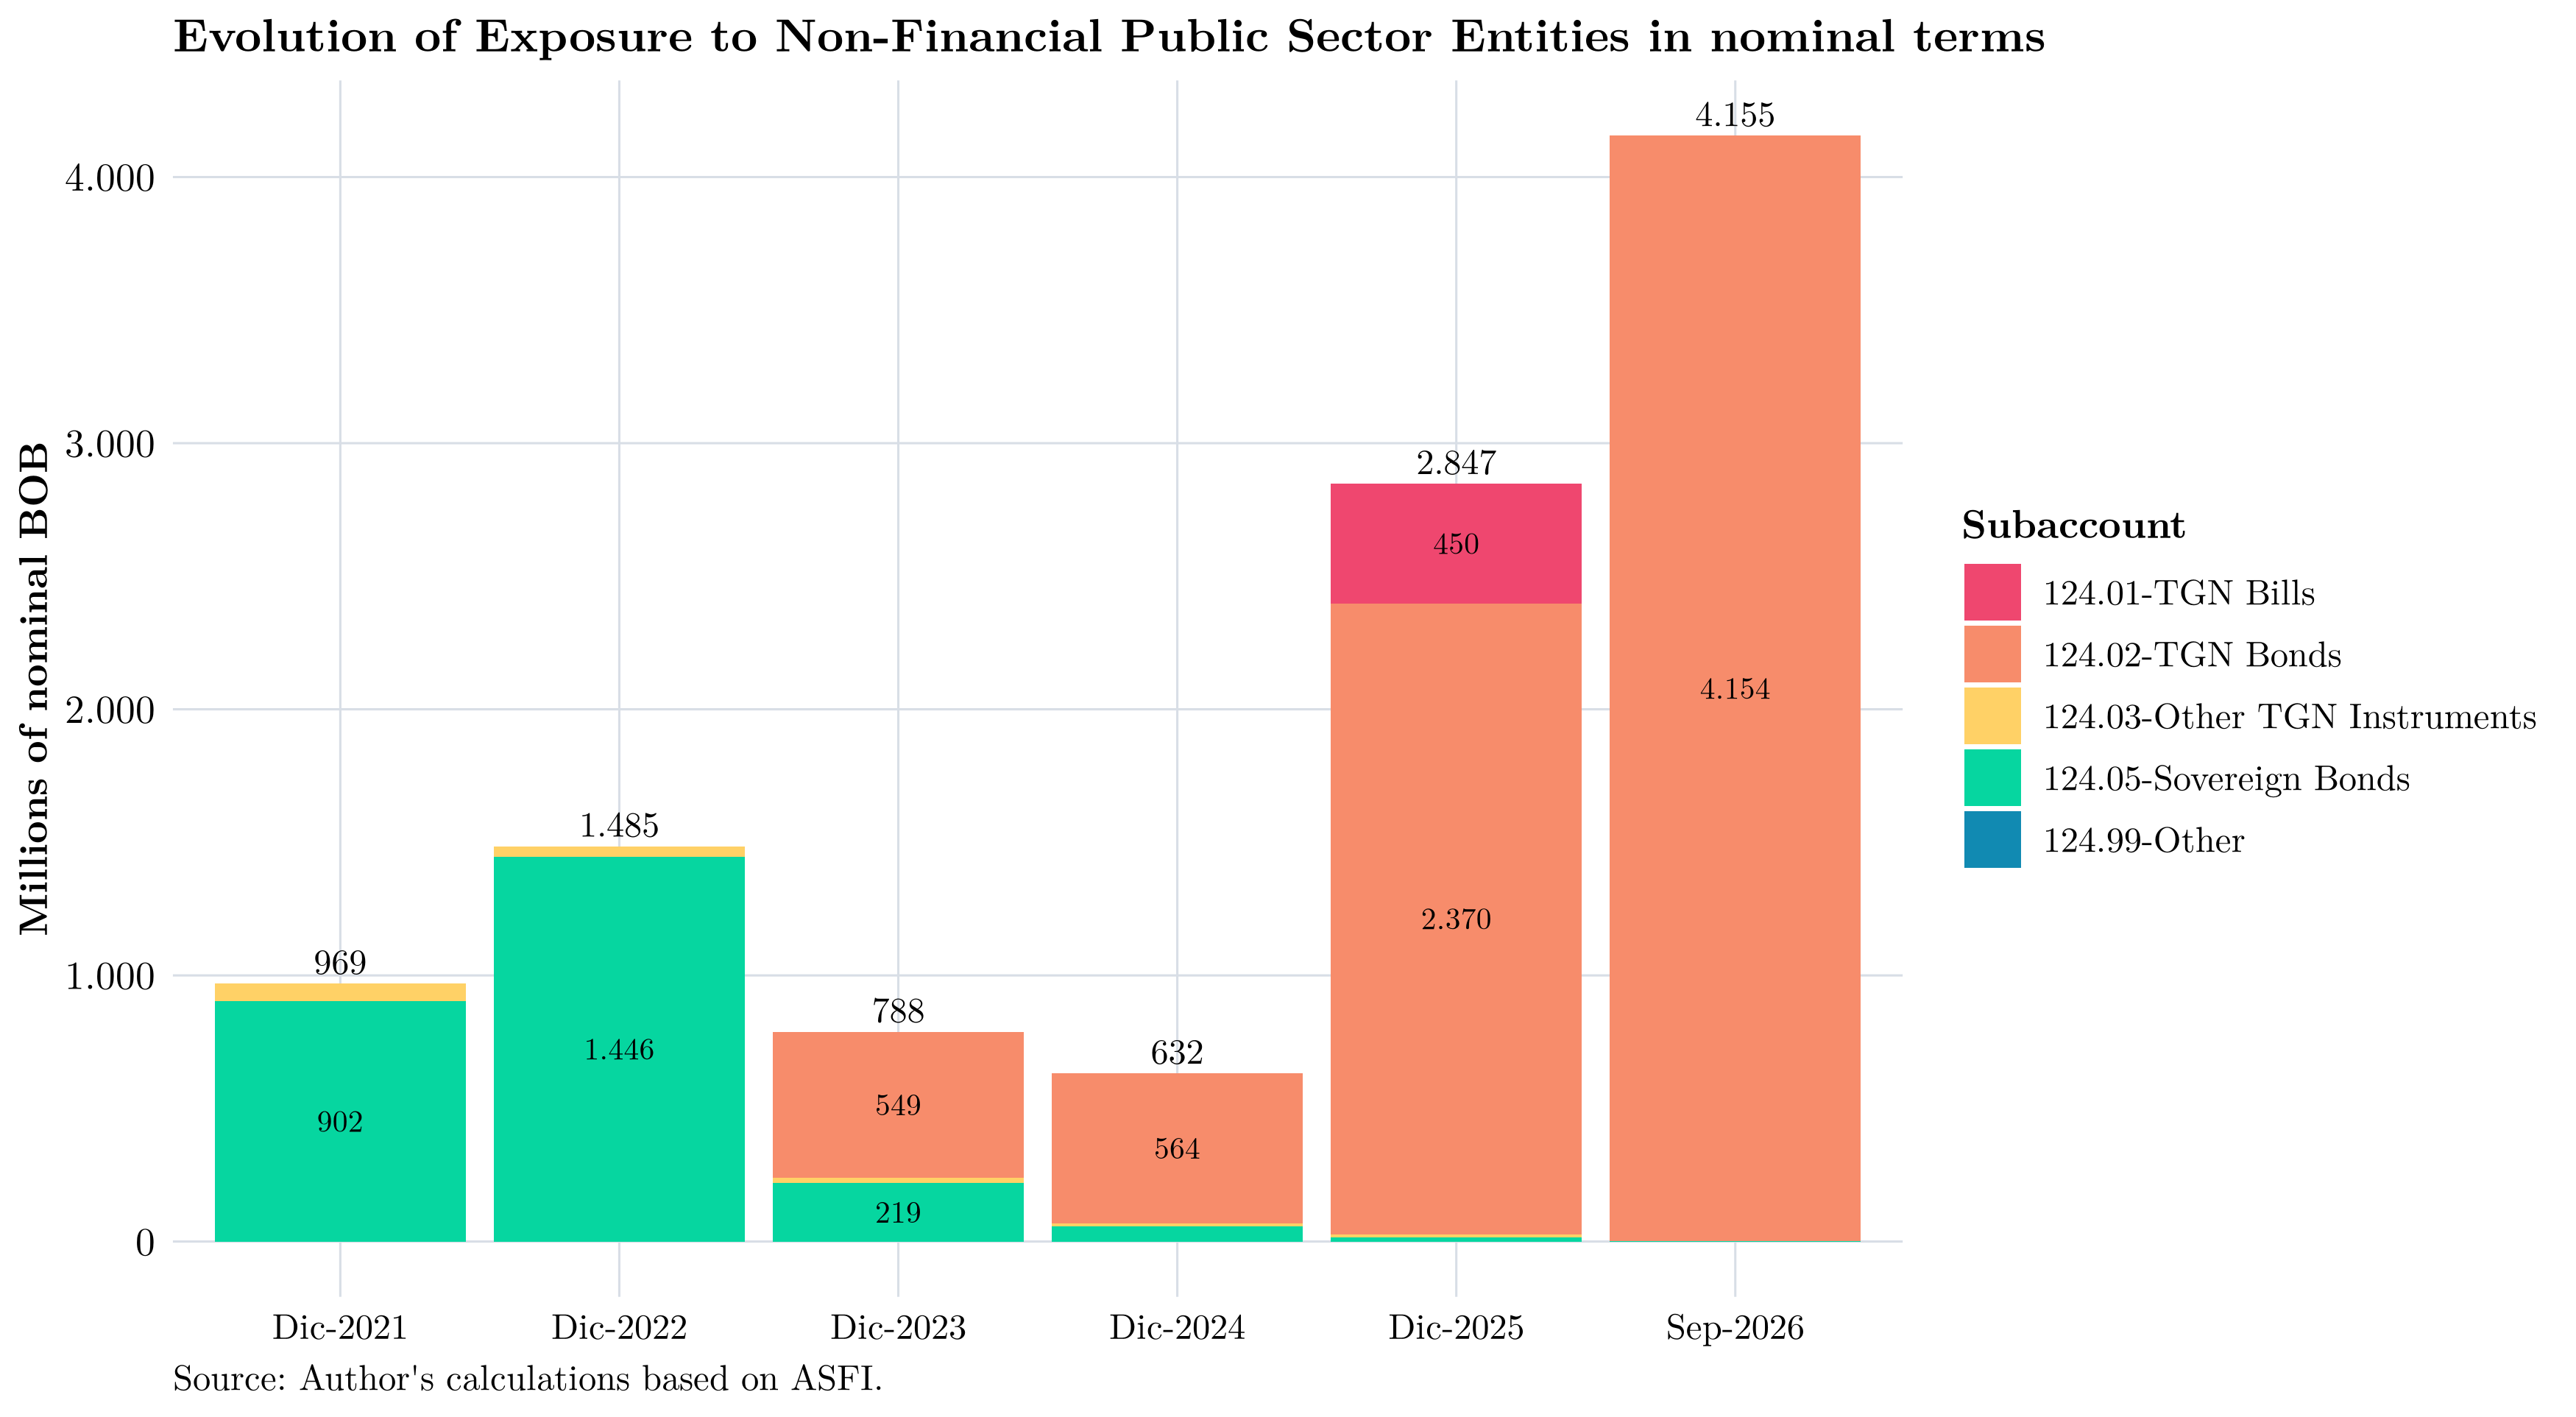
Given its abrupt increase above historical levels, the following figure breaks down account 124, investments in non-financial public-sector entities (NFPS), into its constituent subaccounts:
The following chart shows the evolution of short-term investments by institution and account type:
By Currency
It is also useful to analyze short-term investments by currency. The following chart presents them separately by currency:
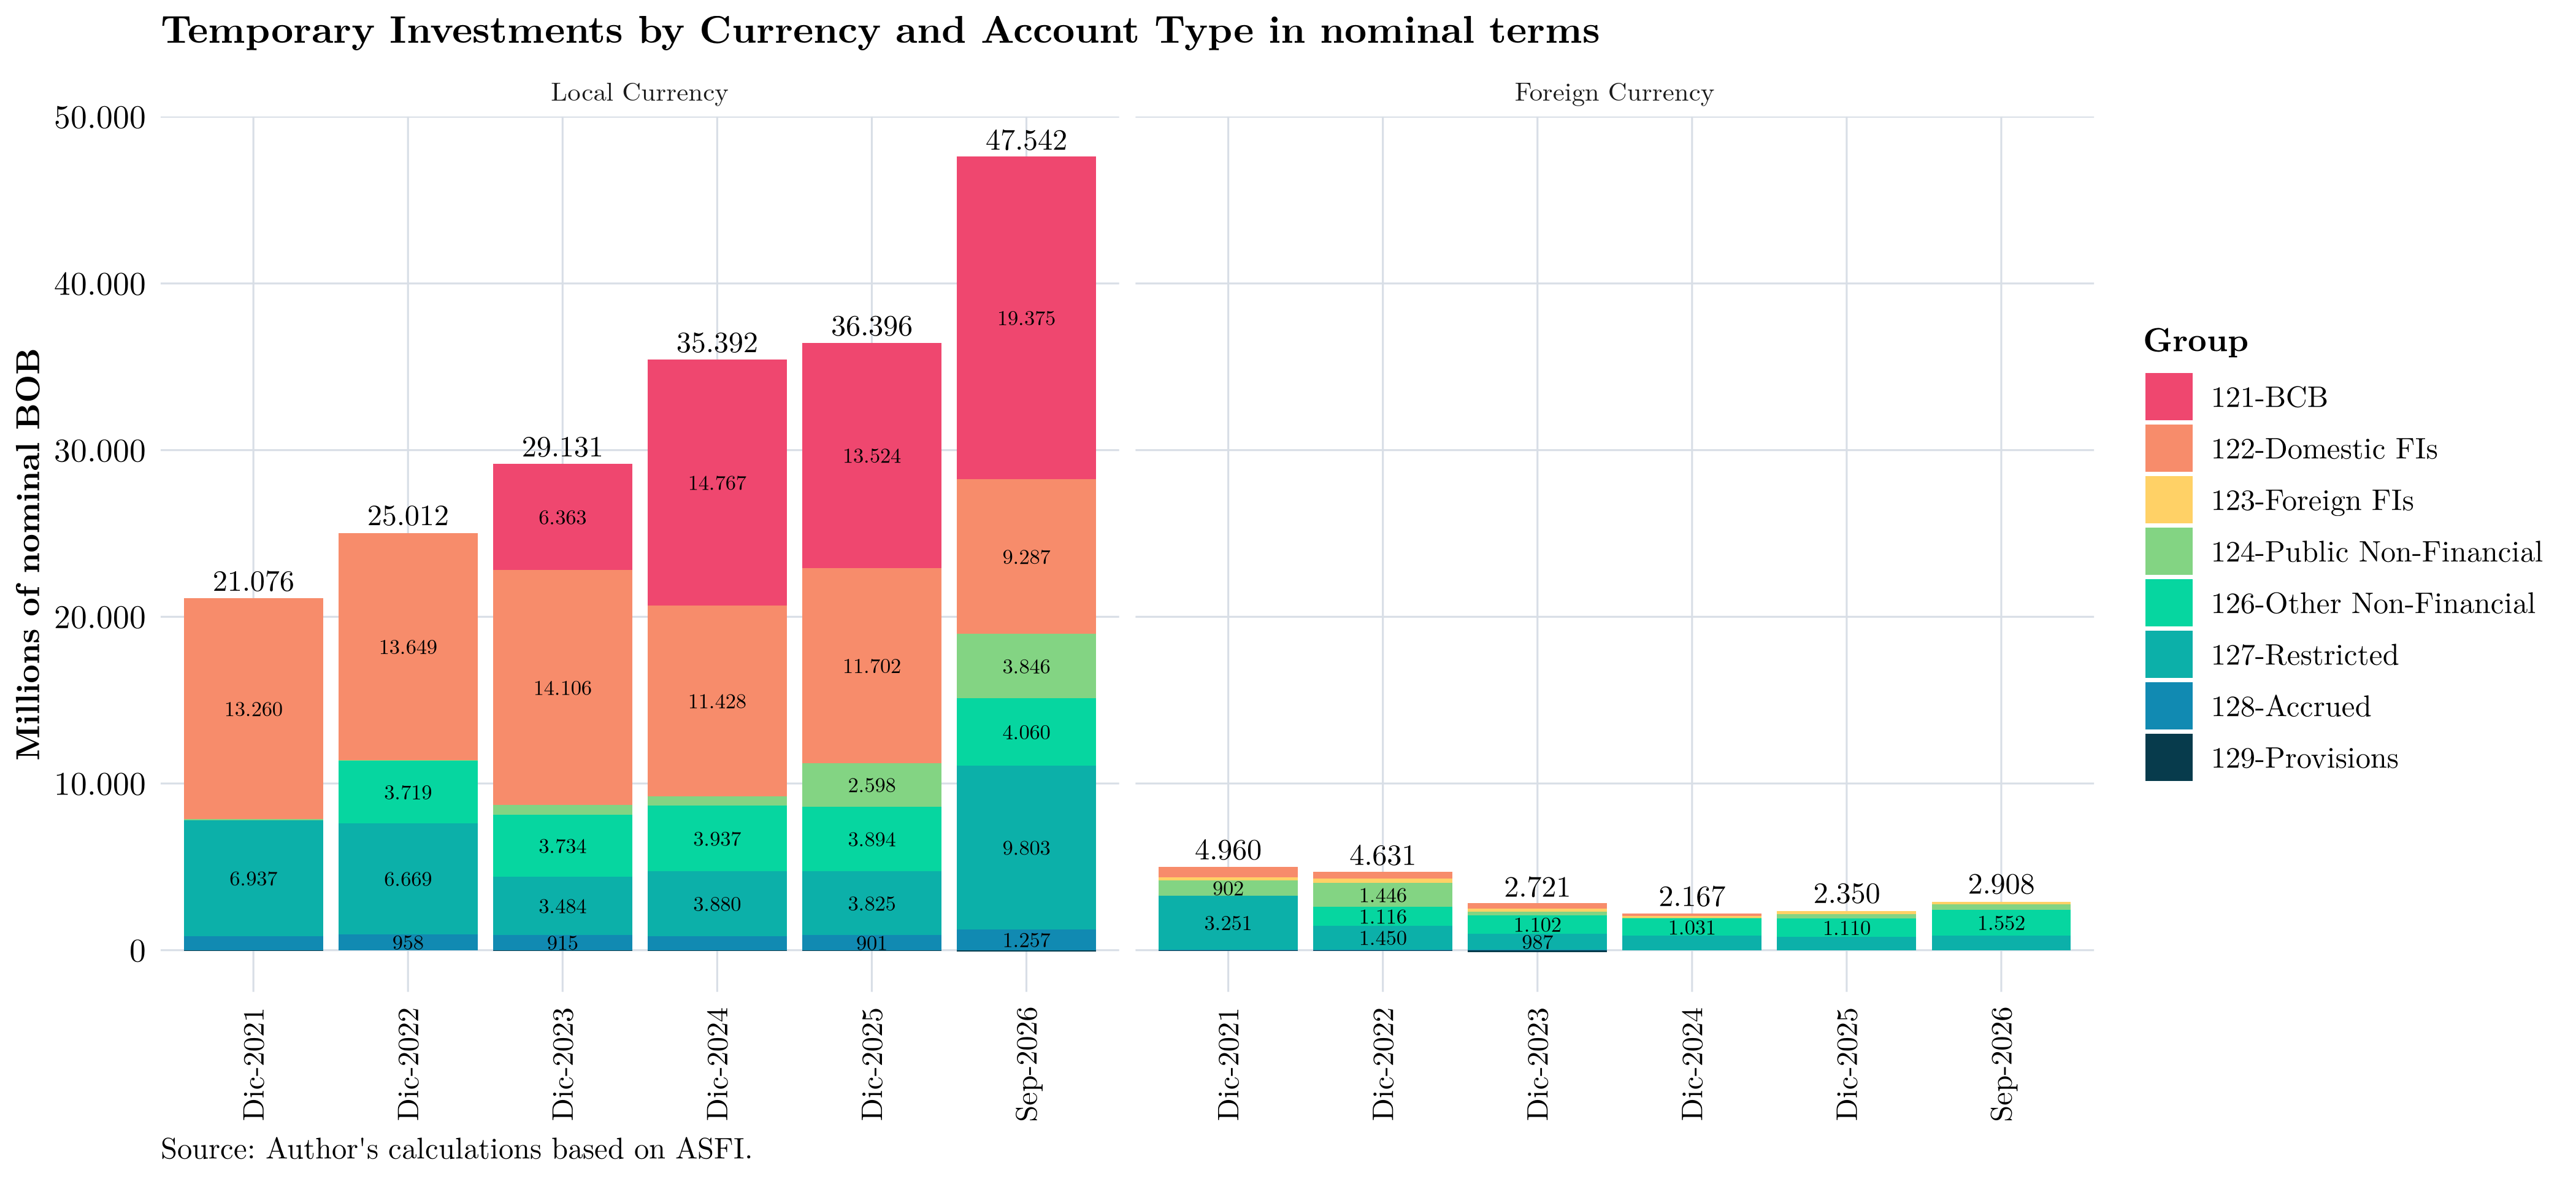
Note that, over time, short-term investments have become increasingly concentrated in domestic currency and at the BCB, which can be interpreted as a means of withdrawing liquidity from the financial system. This is consistent with the BCB’s monetary policy: while financing the fiscal deficit, it has been absorbing liquidity from the financial system to reduce inflationary pressures.
Long-Term Investments
According to ASFI’s Chart of Accounts Manual for Financial Institutions, account 160.00, the Long-Term Investments category:
Comprises deposits with financial intermediation institutions, deposits with the Central Bank of Bolivia, debt securities acquired by the institution, and debt certificates issued by the public sector that are not exchange-traded. These investments cannot readily be converted into cash and cash equivalents or, even when they can be liquidated easily, the institution has expressed its intention—by its own decision and in accordance with its investment policy—to hold them for more than 30 days. Investments recorded in this category whose remaining term to maturity is 30 days or less must be reclassified as short-term investments, provided they meet the conditions established for that type of investment.
Relative to the previous month, long-term investments rose by BOB 4,103 million (18.0%); relative to the previous quarter, they increased by BOB 7,232 million (36.9%); and relative to the same month of the previous year, they rose by BOB 9,793 million (57.4%).
Composition
The following chart shows the composition of these investments by account type:
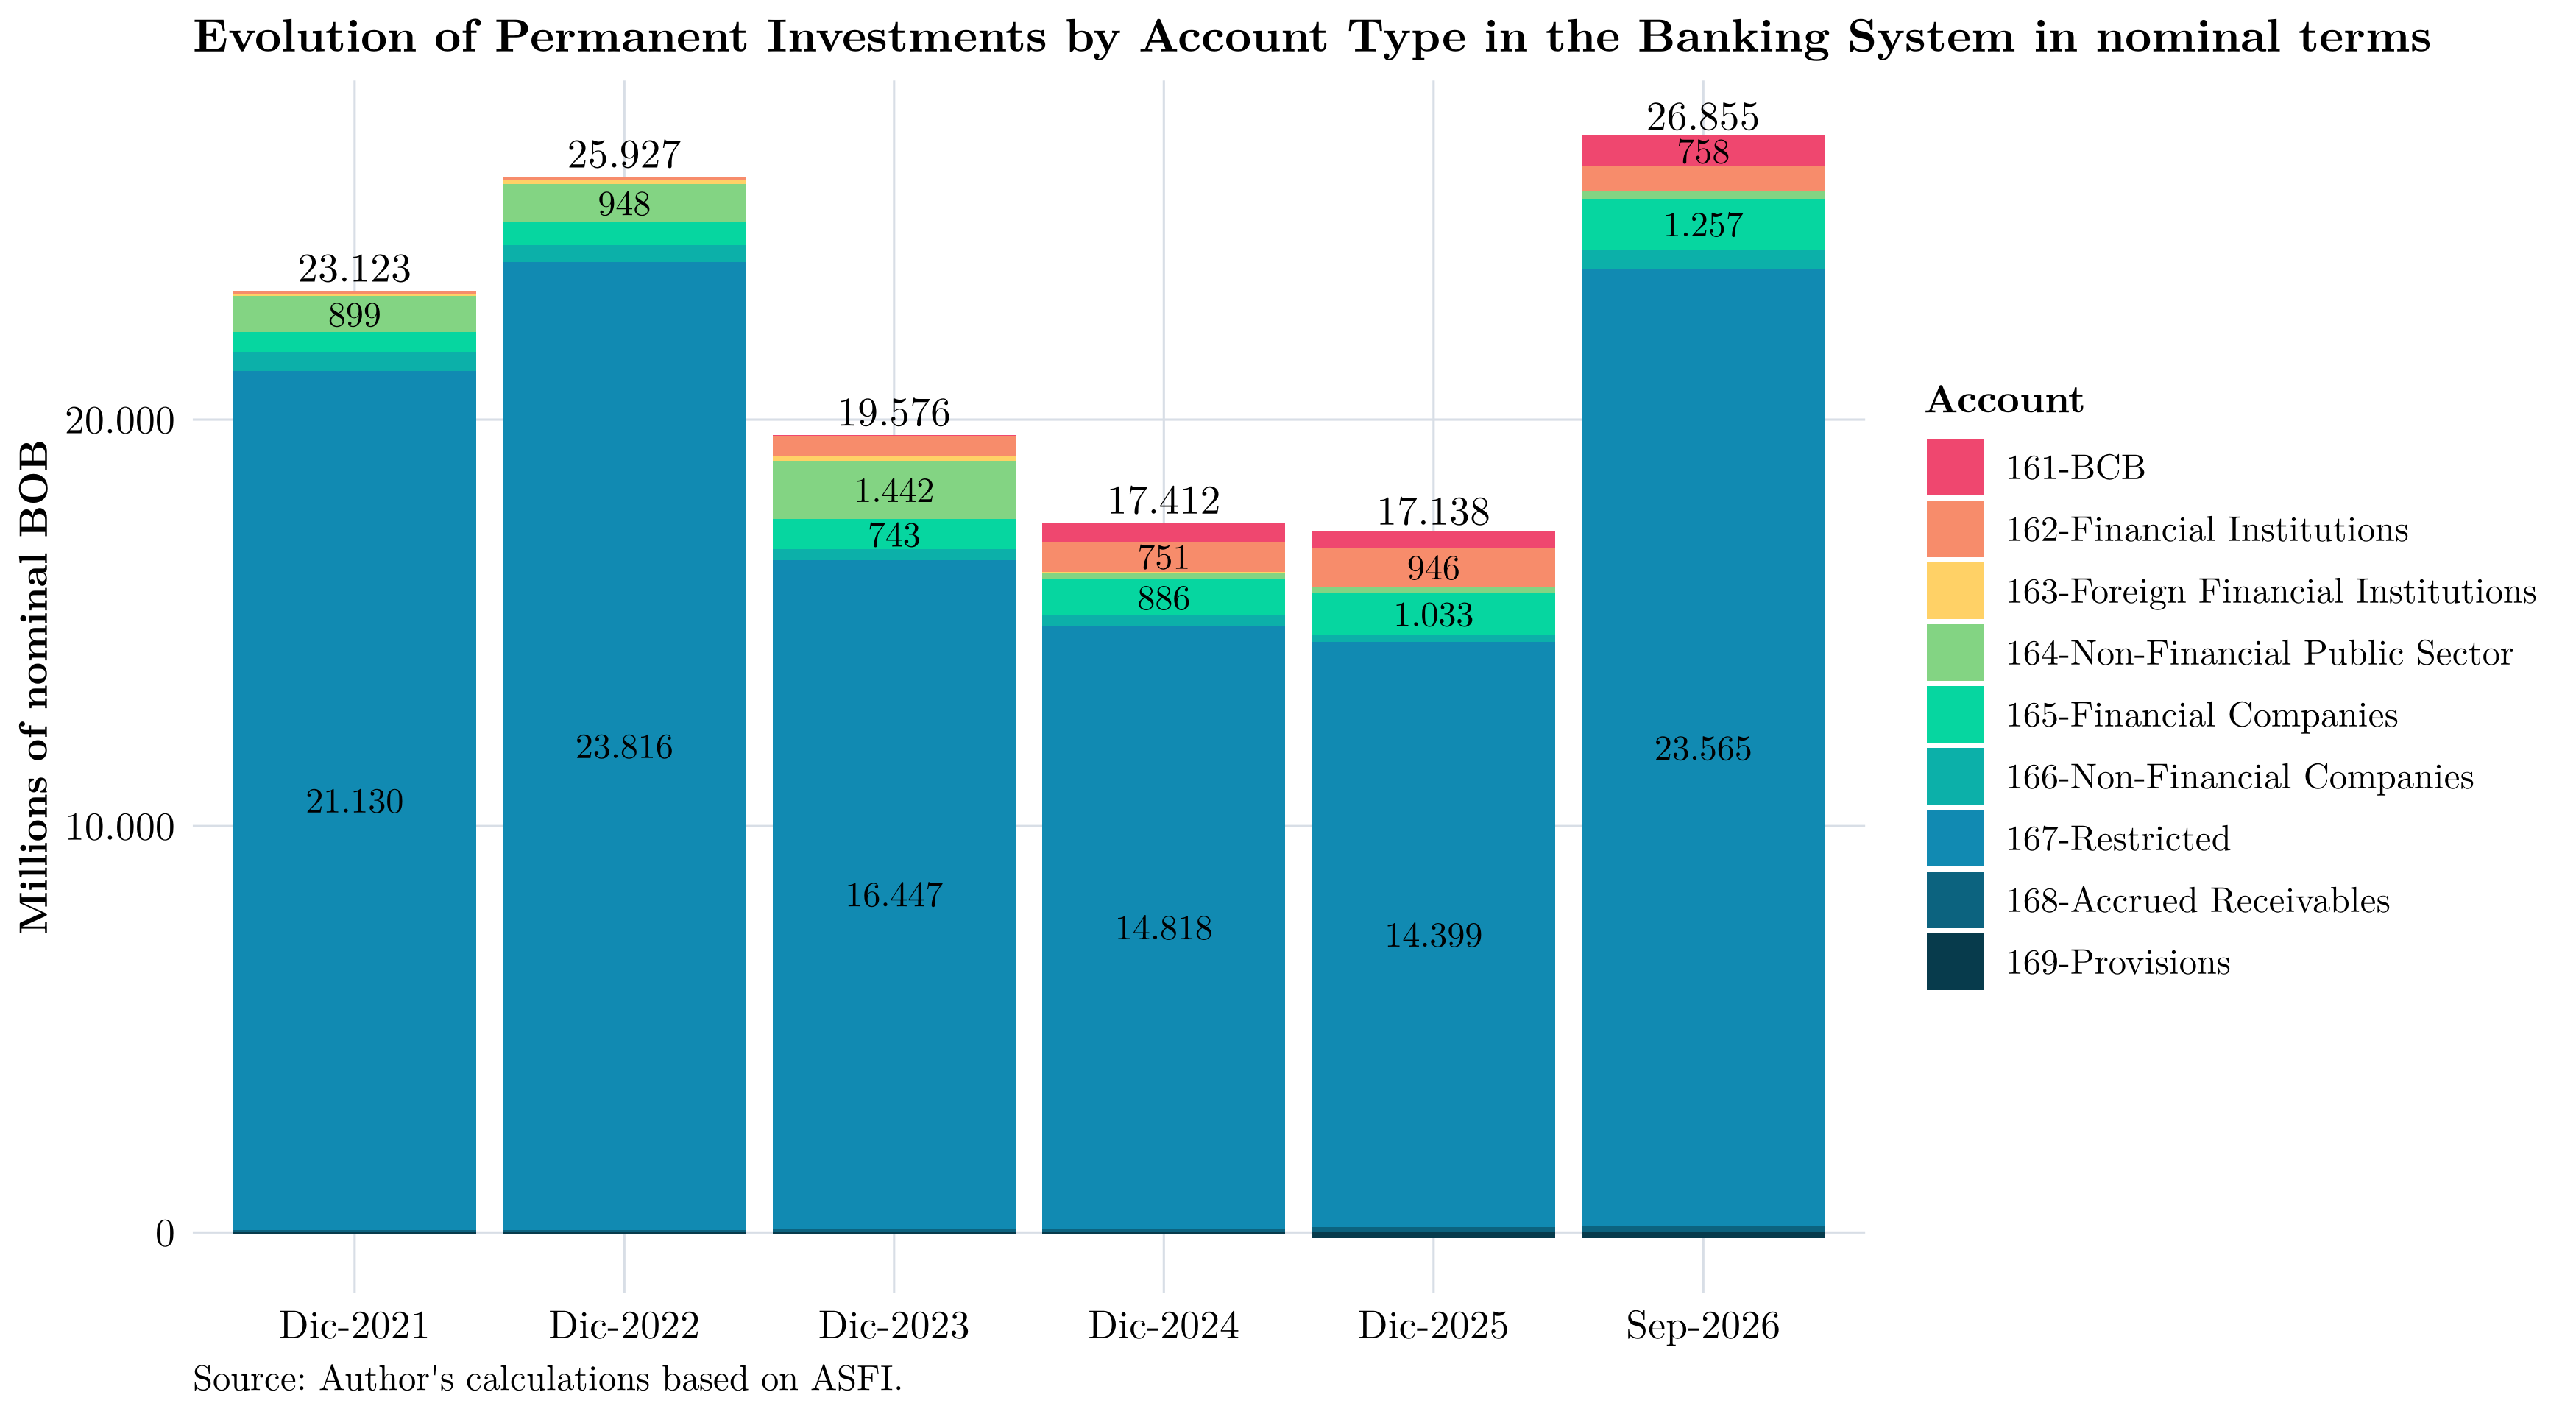
Note that the largest concentration is in account 167, restricted-availability investments, which records “investments in securities issued by domestic or foreign entities […] whose availability is restricted as of the reporting date because the securities are subject to a sale agreement with a repurchase commitment, have been allocated to additional reserve requirements, or have been pledged as collateral […]”
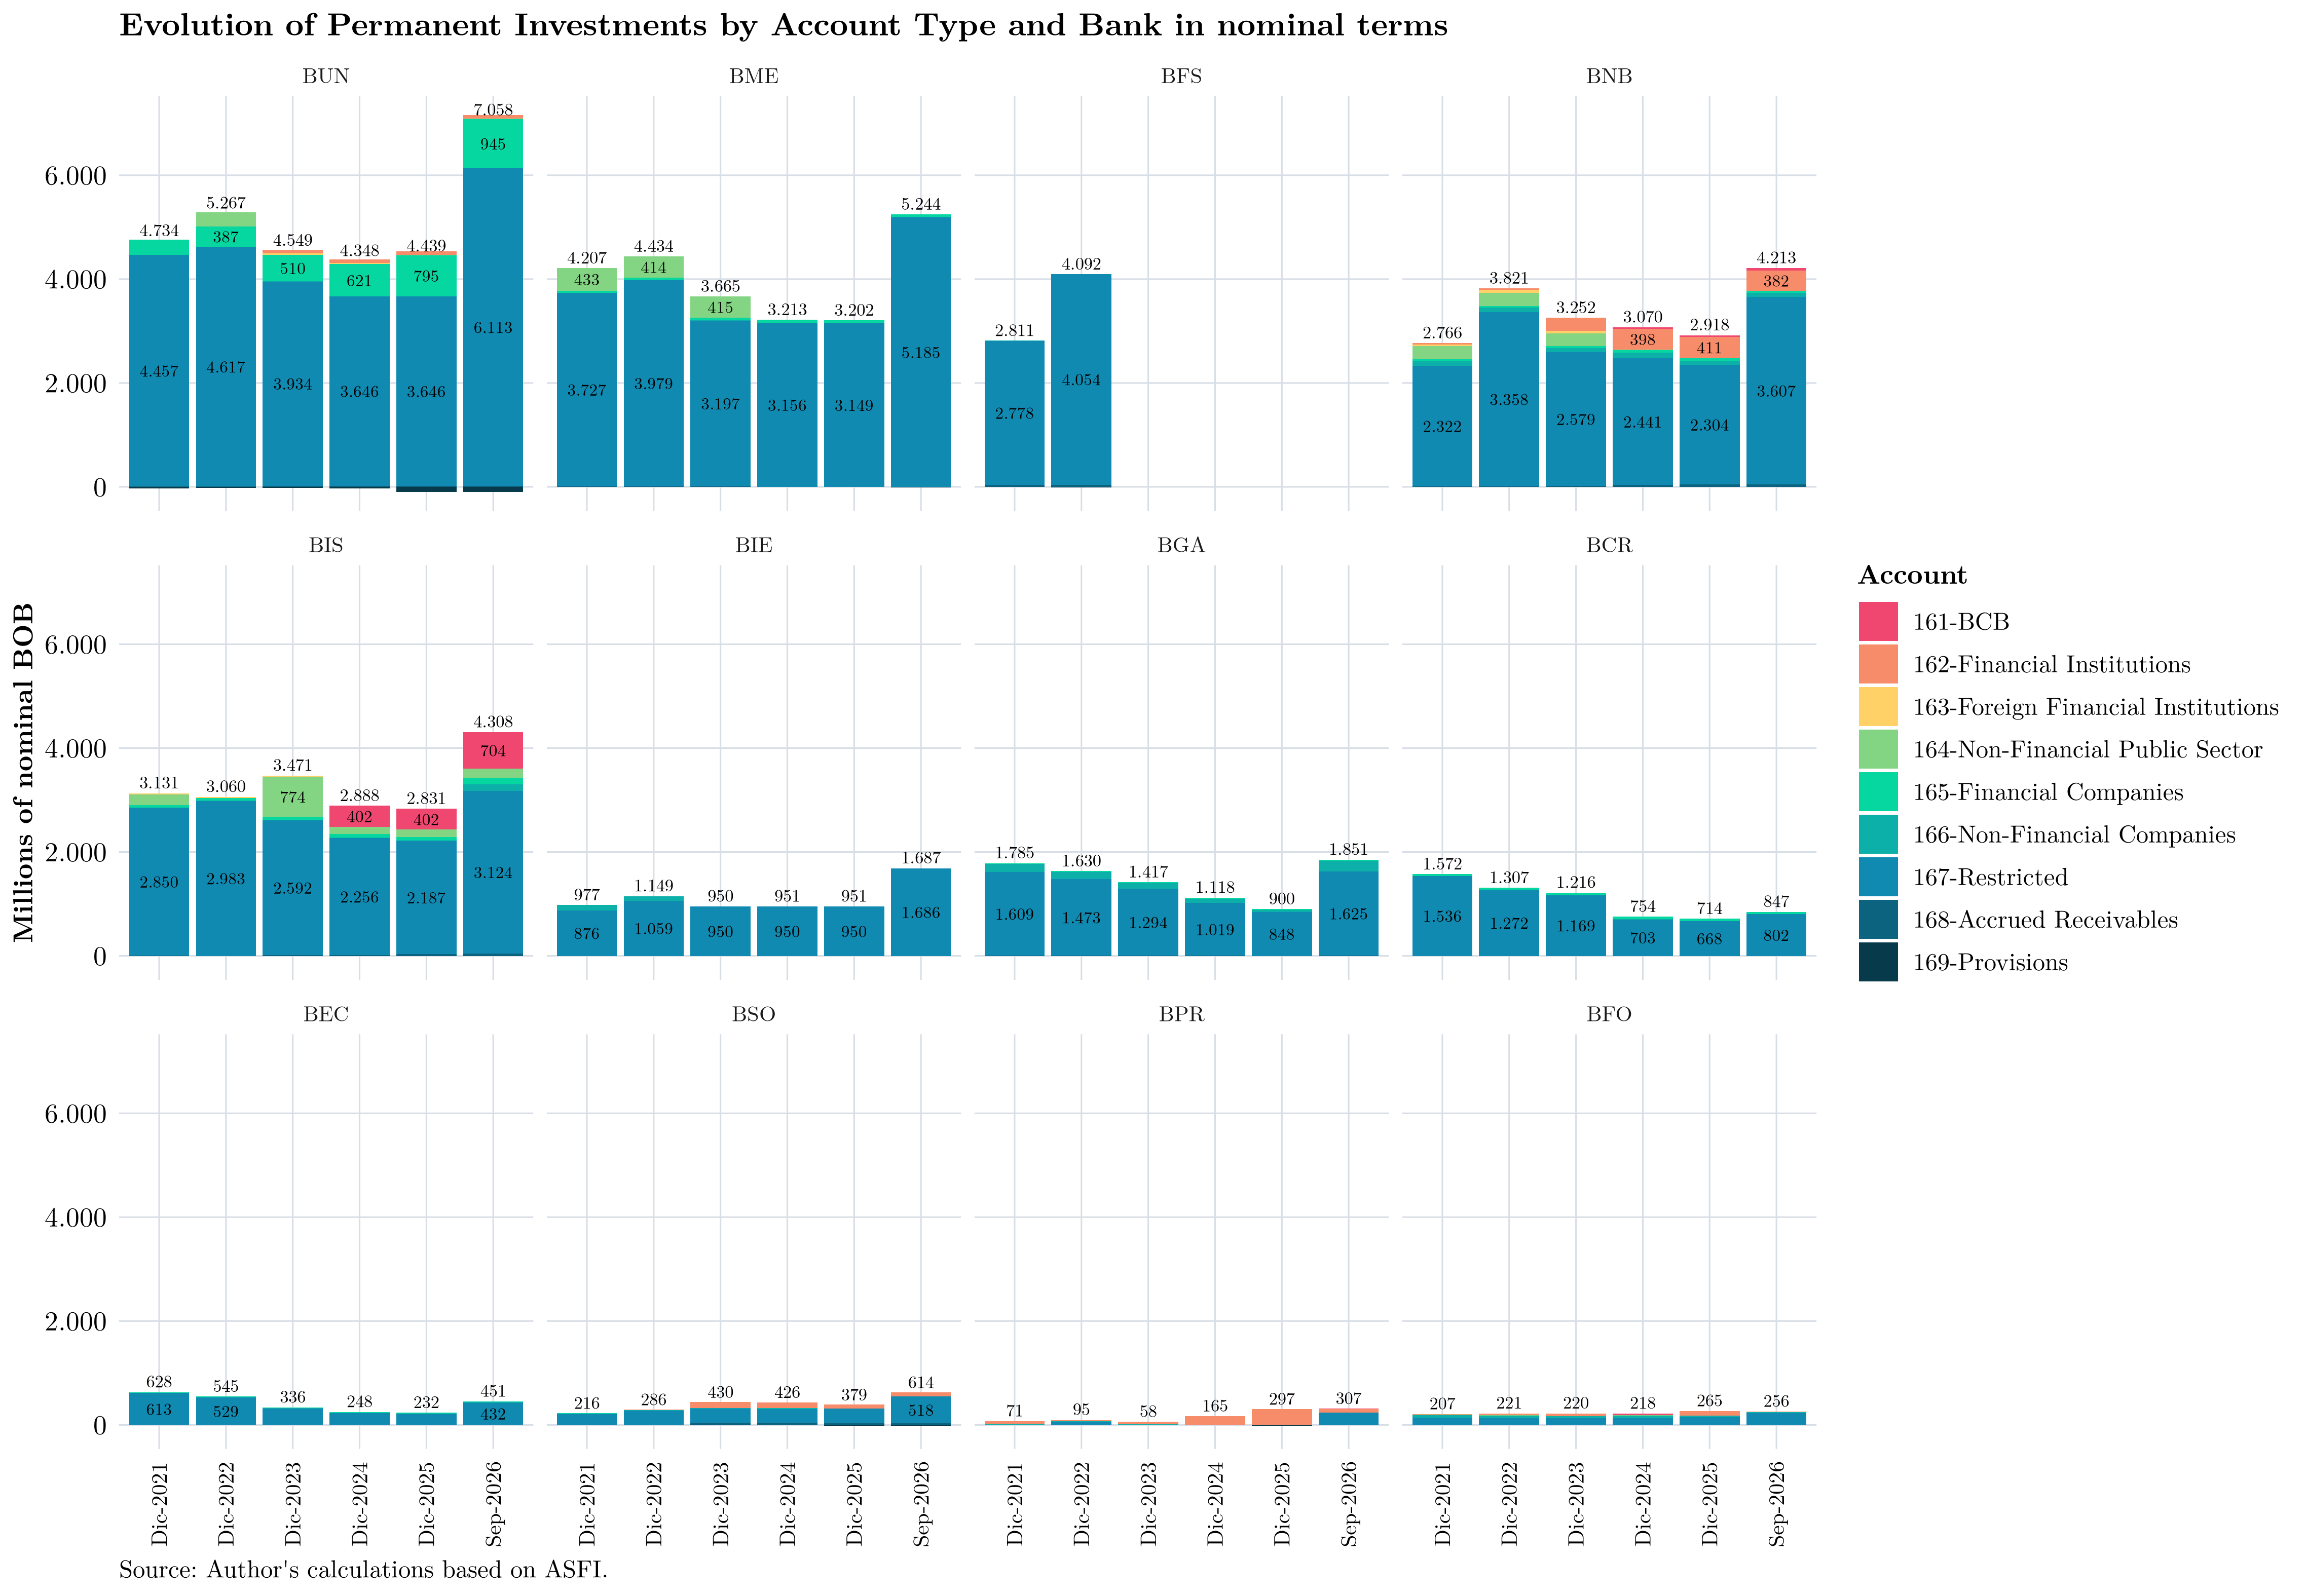
These long-term investments are concentrated mainly in contributions to the CPVIS, CAPROSEN, FIUSEER, and other funds managed by the BCB, which were established through reductions in the foreign-currency reserve requirements applicable to financial intermediation institutions. These funds, which must be returned to the institutions in foreign currency, have not yet been fully repaid, generating some concern within the financial system.
Thus, the significant increase in these investments is probably attributable to the fact that these accounts are denominated in foreign currency and have therefore been affected by the depreciation of the boliviano against the US dollar.
By institution:
Funding and Financial Intermediation
Banking intermediation depends on the relationship between deposit-taking and lending. We first examine the system’s funding—primarily obligations to the public—and then the loan portfolio, which is banks’ main earning asset.
Deposit-Taking: Liabilities and Deposits
According to ASFI’s Chart of Accounts Manual for Financial Institutions, account 200.00, the Liabilities category:
Groups together the accounts representing the institution’s direct obligations. These include obligations to the public, obligations to government institutions, obligations to banks and financing institutions—including obligations to the Central Bank of Bolivia and others—as well as outstanding securities issued by the institution, subordinated liabilities, and obligations to state-owned or partly state-owned enterprises. It also includes various other obligations of the institution and provisions that do not represent valuation adjustments to assets.
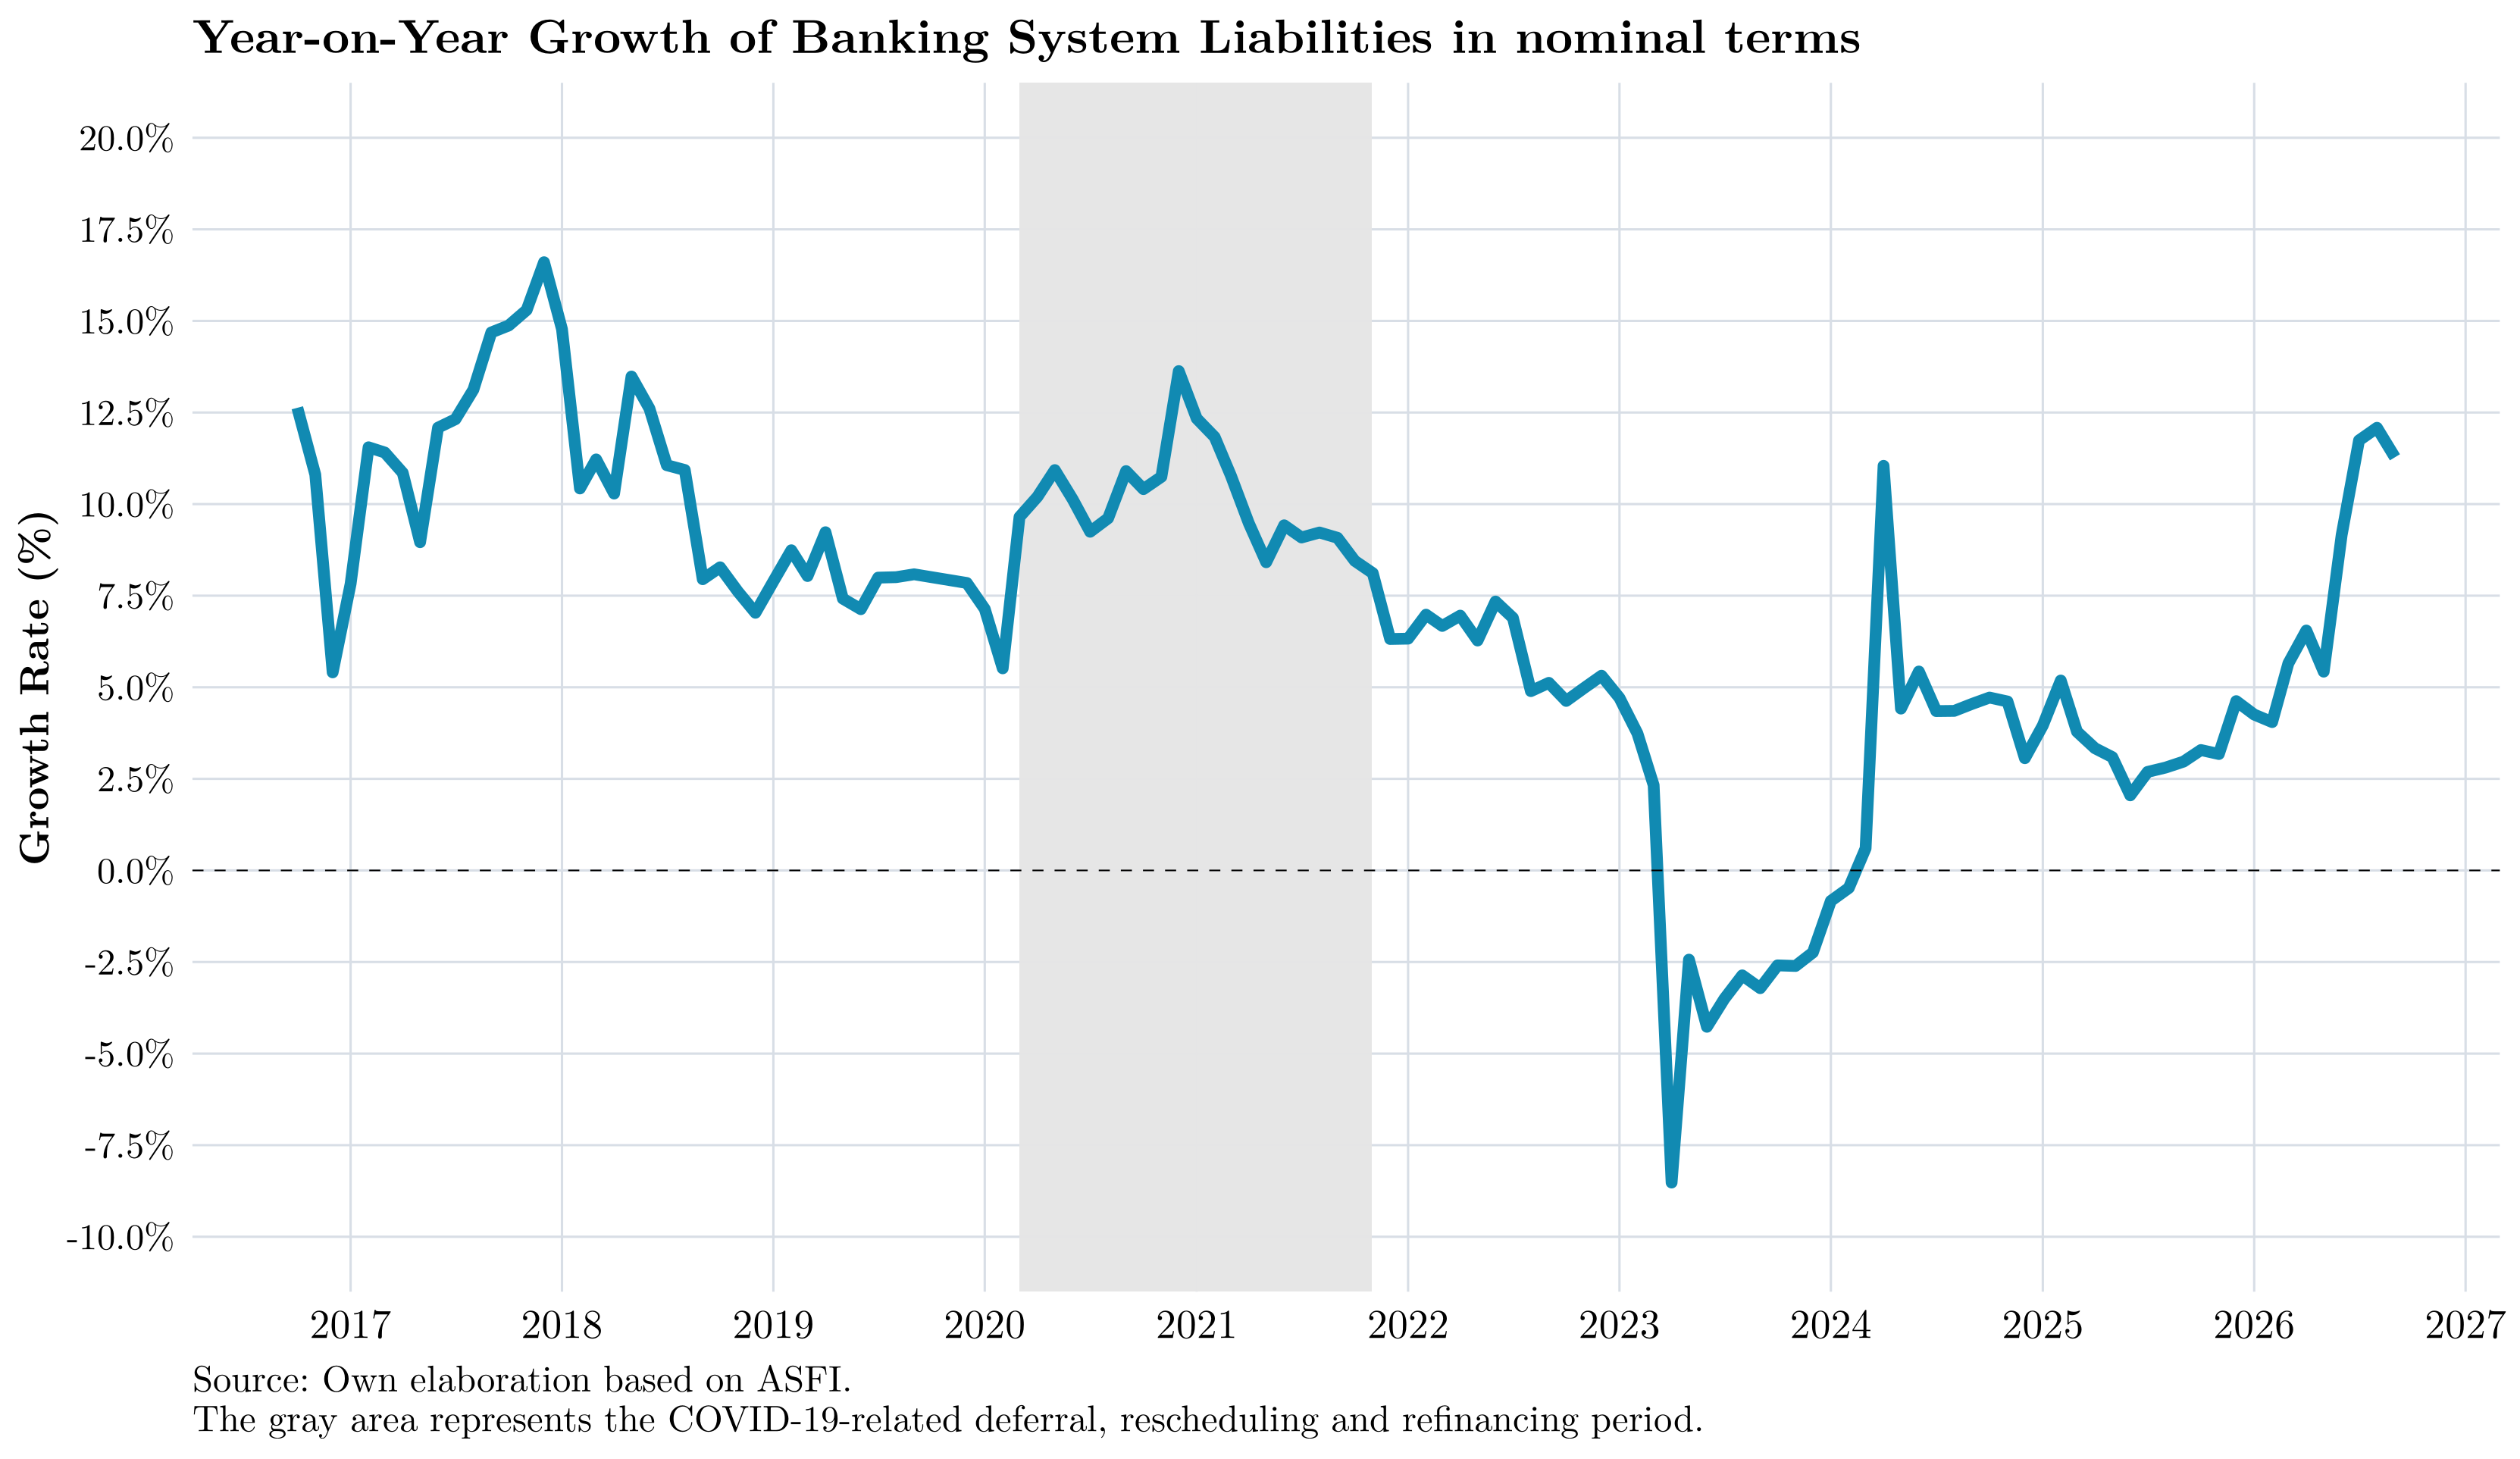
In this report, liabilities are measured as the total of account 200.00. Relative to the previous month, liabilities increased by BOB 936 million (0.3%); relative to the previous quarter, they increased by BOB 11,046 million (3.8%); and relative to the same month of the previous year, they rose by BOB 30,572 million (11.3%).
Within this total, account 210.00 corresponds to obligations to the public:
Represents funds received as deposits and other types of obligations to the general public. This category does not include obligations to public-sector entities (government accounts), the Central Bank of Bolivia, other banks, or financing institutions.
The following chart shows the evolution of banking-system liabilities as of each December in recent years, together with the most recent date for which data are available.
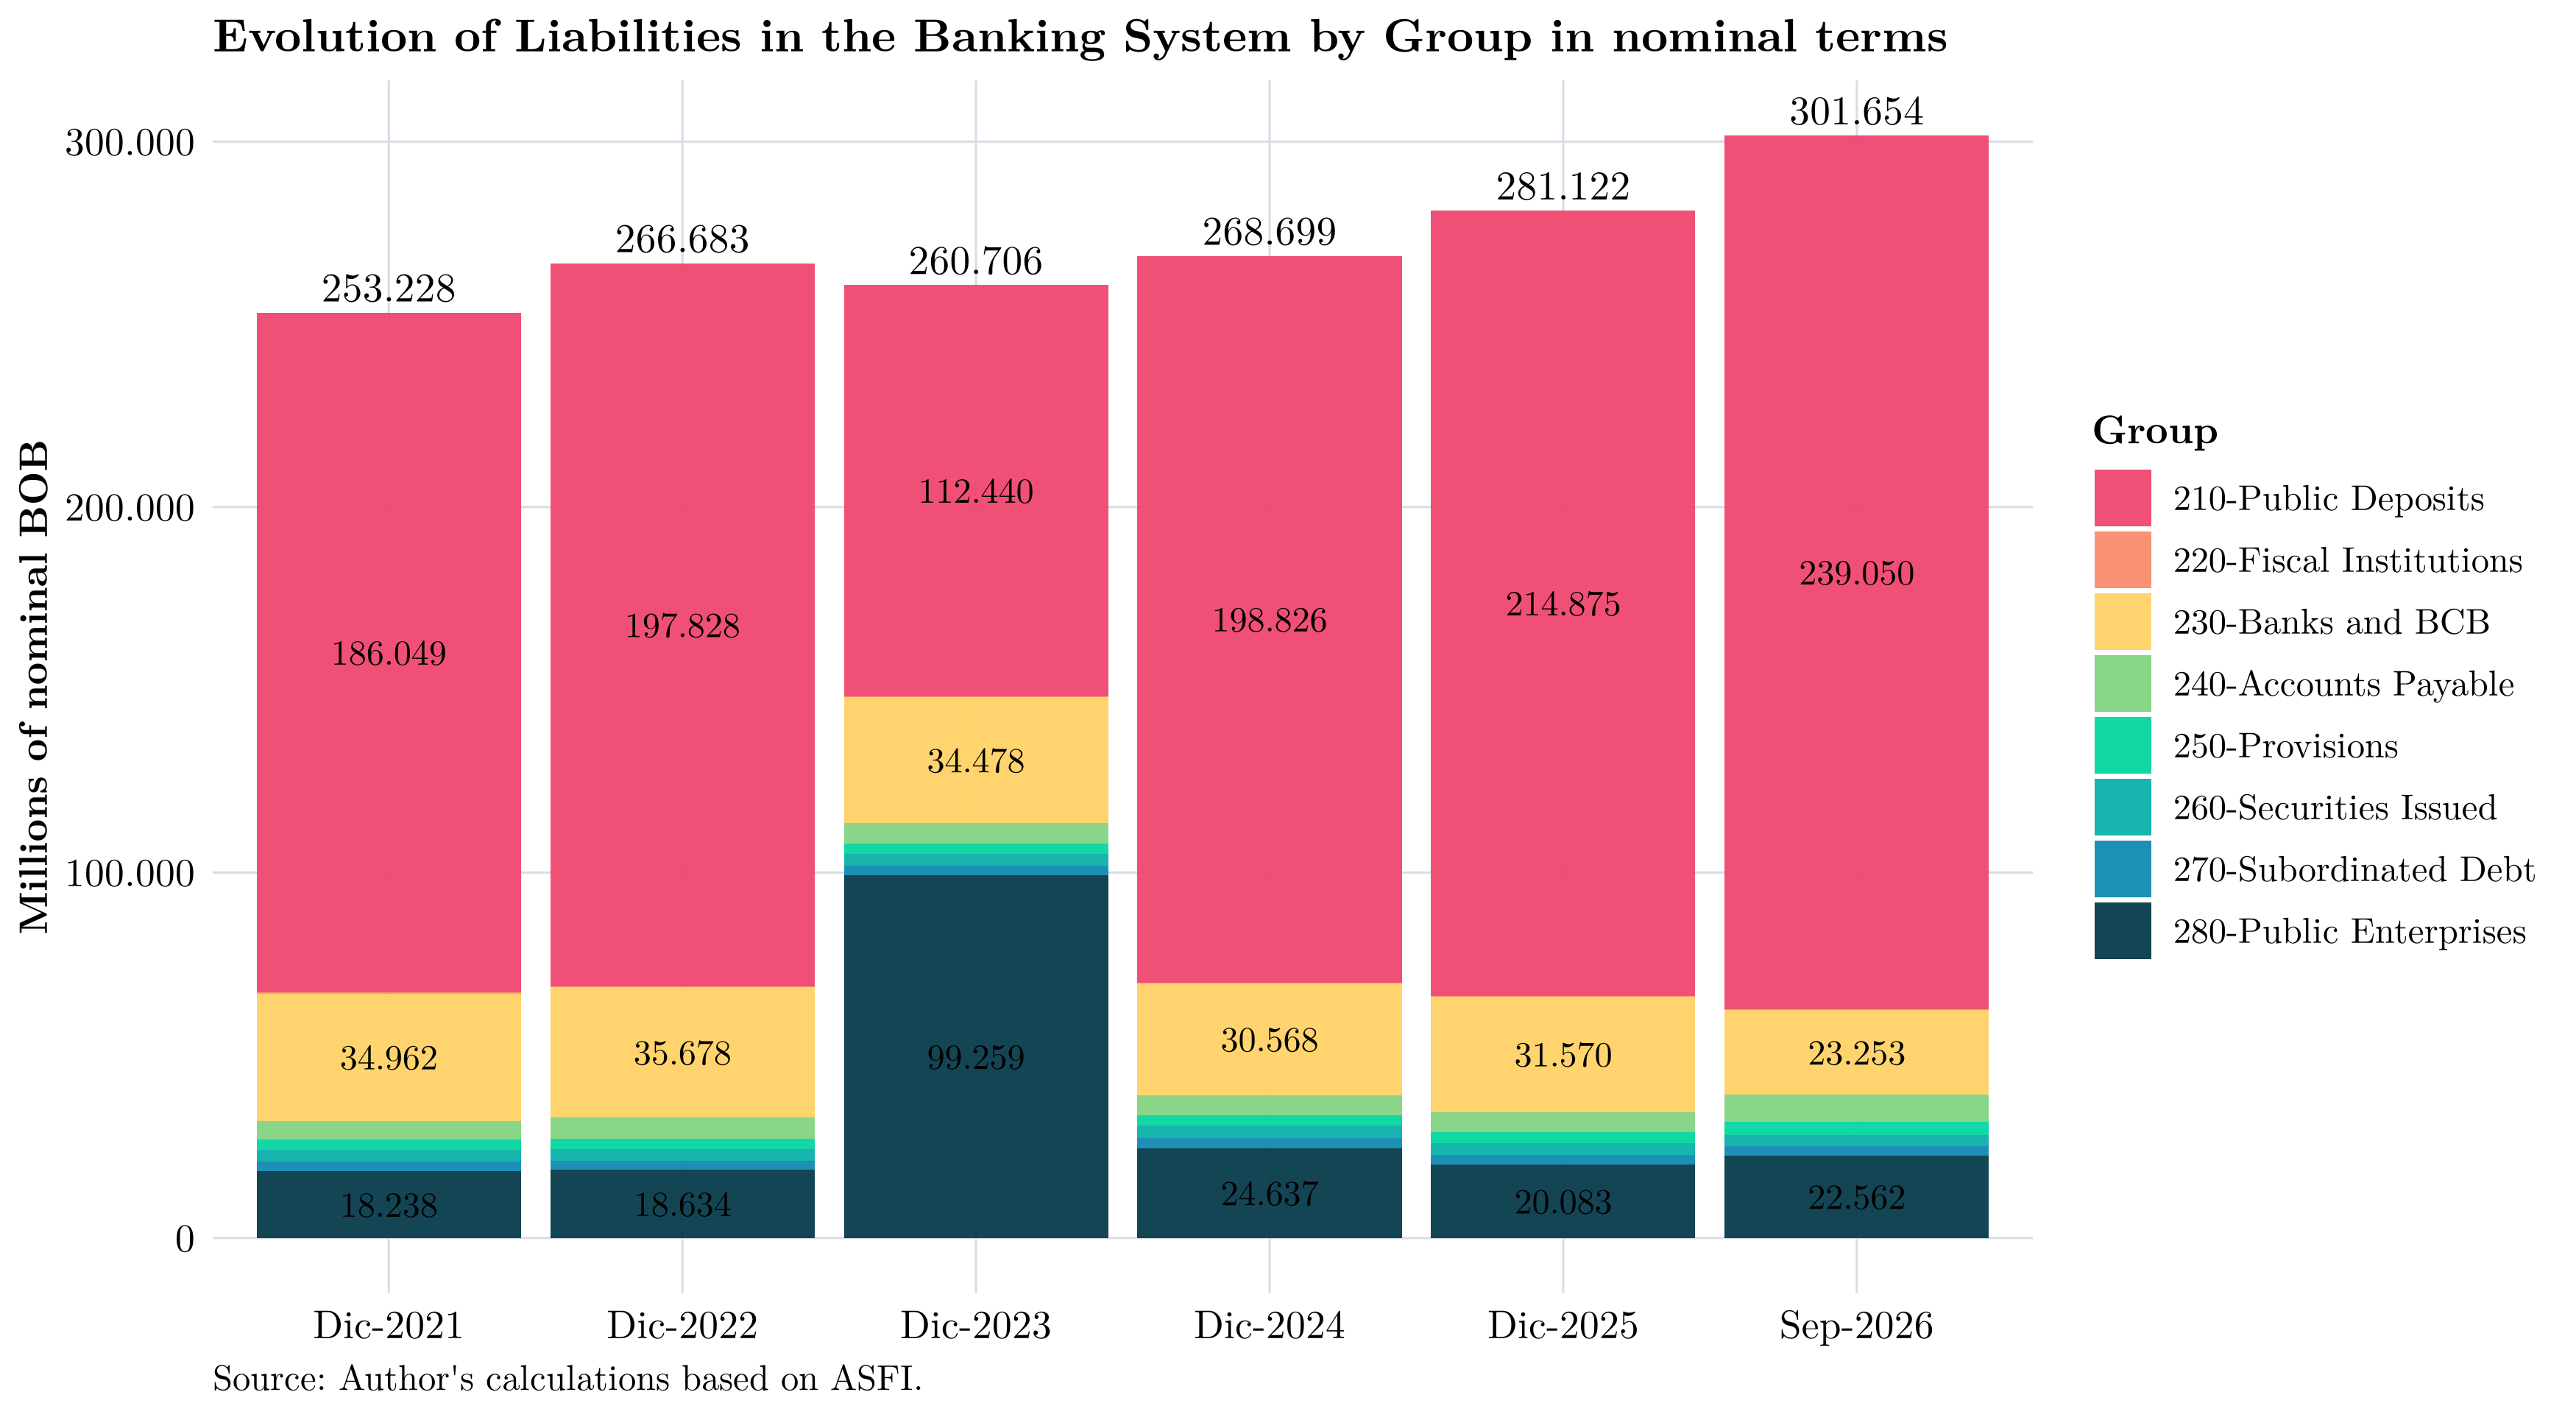
Note that, in December 2023, account 280, reserved for public enterprises, increased. This was due to an accounting reclassification from the pension fund administrators (AFPs) to the public pension fund manager (Gestora Pública), which manages pension funds. Clearly, almost 40% of bank funding was concentrated in a single institution, raising liquidity-management concerns because it gave that institution significant market power. This accounting reclassification was subsequently reversed, however, and the available information does not allow the importance of Gestora Pública in bank funding to be identified precisely.
One important point emerging from the chart is that the evolution of liabilities during the year depends on banks’ ability to continue attracting deposits from the public. If banks cannot raise funds, they cannot sustain lending—their core business and main source of income. Their options, therefore, are to raise interest rates to attract deposits or negotiate directly with large institutional depositors to obtain liquidity, also by offering higher rates. Either way, because interest rates on social housing and productive-sector loans are fixed, higher deposit rates will reduce banks’ profitability.
Alternatively, liabilities can be reclassified by deposit type:
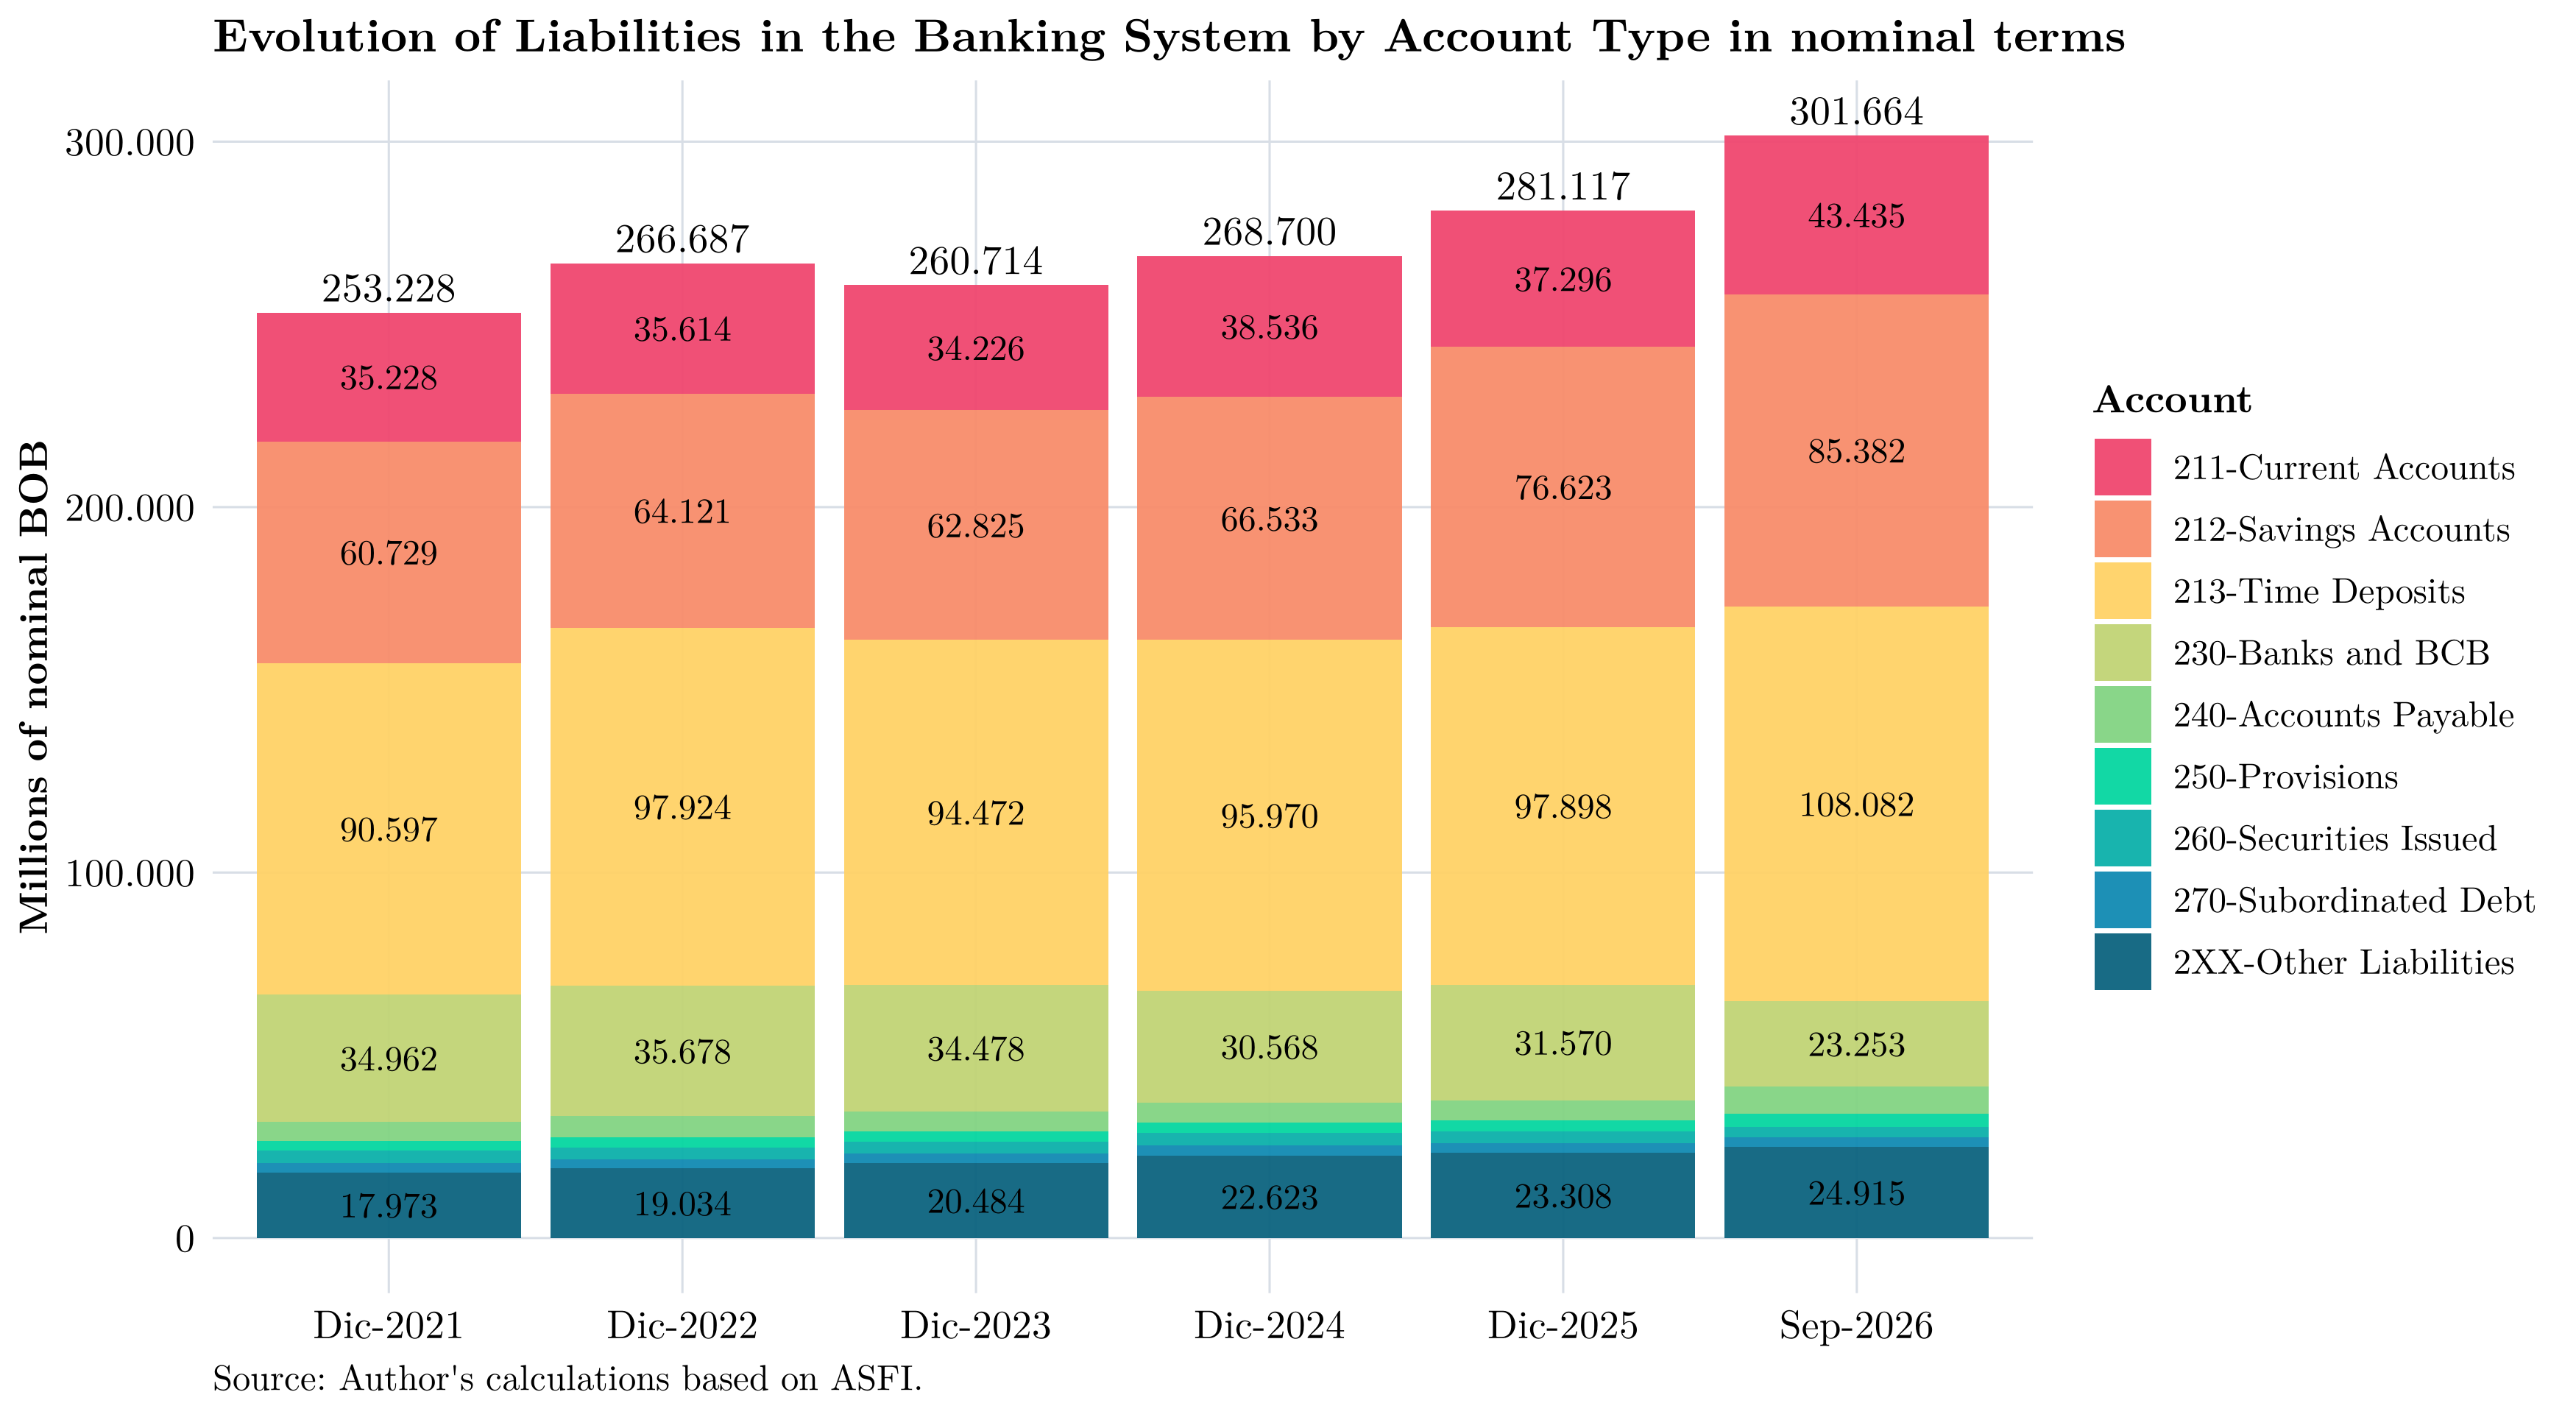
For example, as noted earlier, current-account deposits increased by BOB 683 million (1.6%) relative to the previous month, by BOB 4,081 million (10.4%) relative to the previous quarter, and by BOB 7,327 million (20.3%) relative to the same month of the previous year. Savings deposits rose by BOB 1,144 million (1.4%) relative to the previous month, by BOB 5,178 million (6.5%) relative to the previous quarter, and by BOB 16,708 million (24.3%) relative to the same month of the previous year. Finally, term deposits increased by BOB 147 million (0.1%) relative to the previous month, by BOB 2,707 million (2.6%) relative to the previous quarter, and by BOB 11,719 million (12.2%) relative to the same month of the previous year.
Funding Growth
How have the banking system’s liabilities evolved? Overall, bank liabilities have continued to grow when each month is compared with the corresponding month of the previous year, but growth rates are declining:
Looking at year-on-year growth by institution:
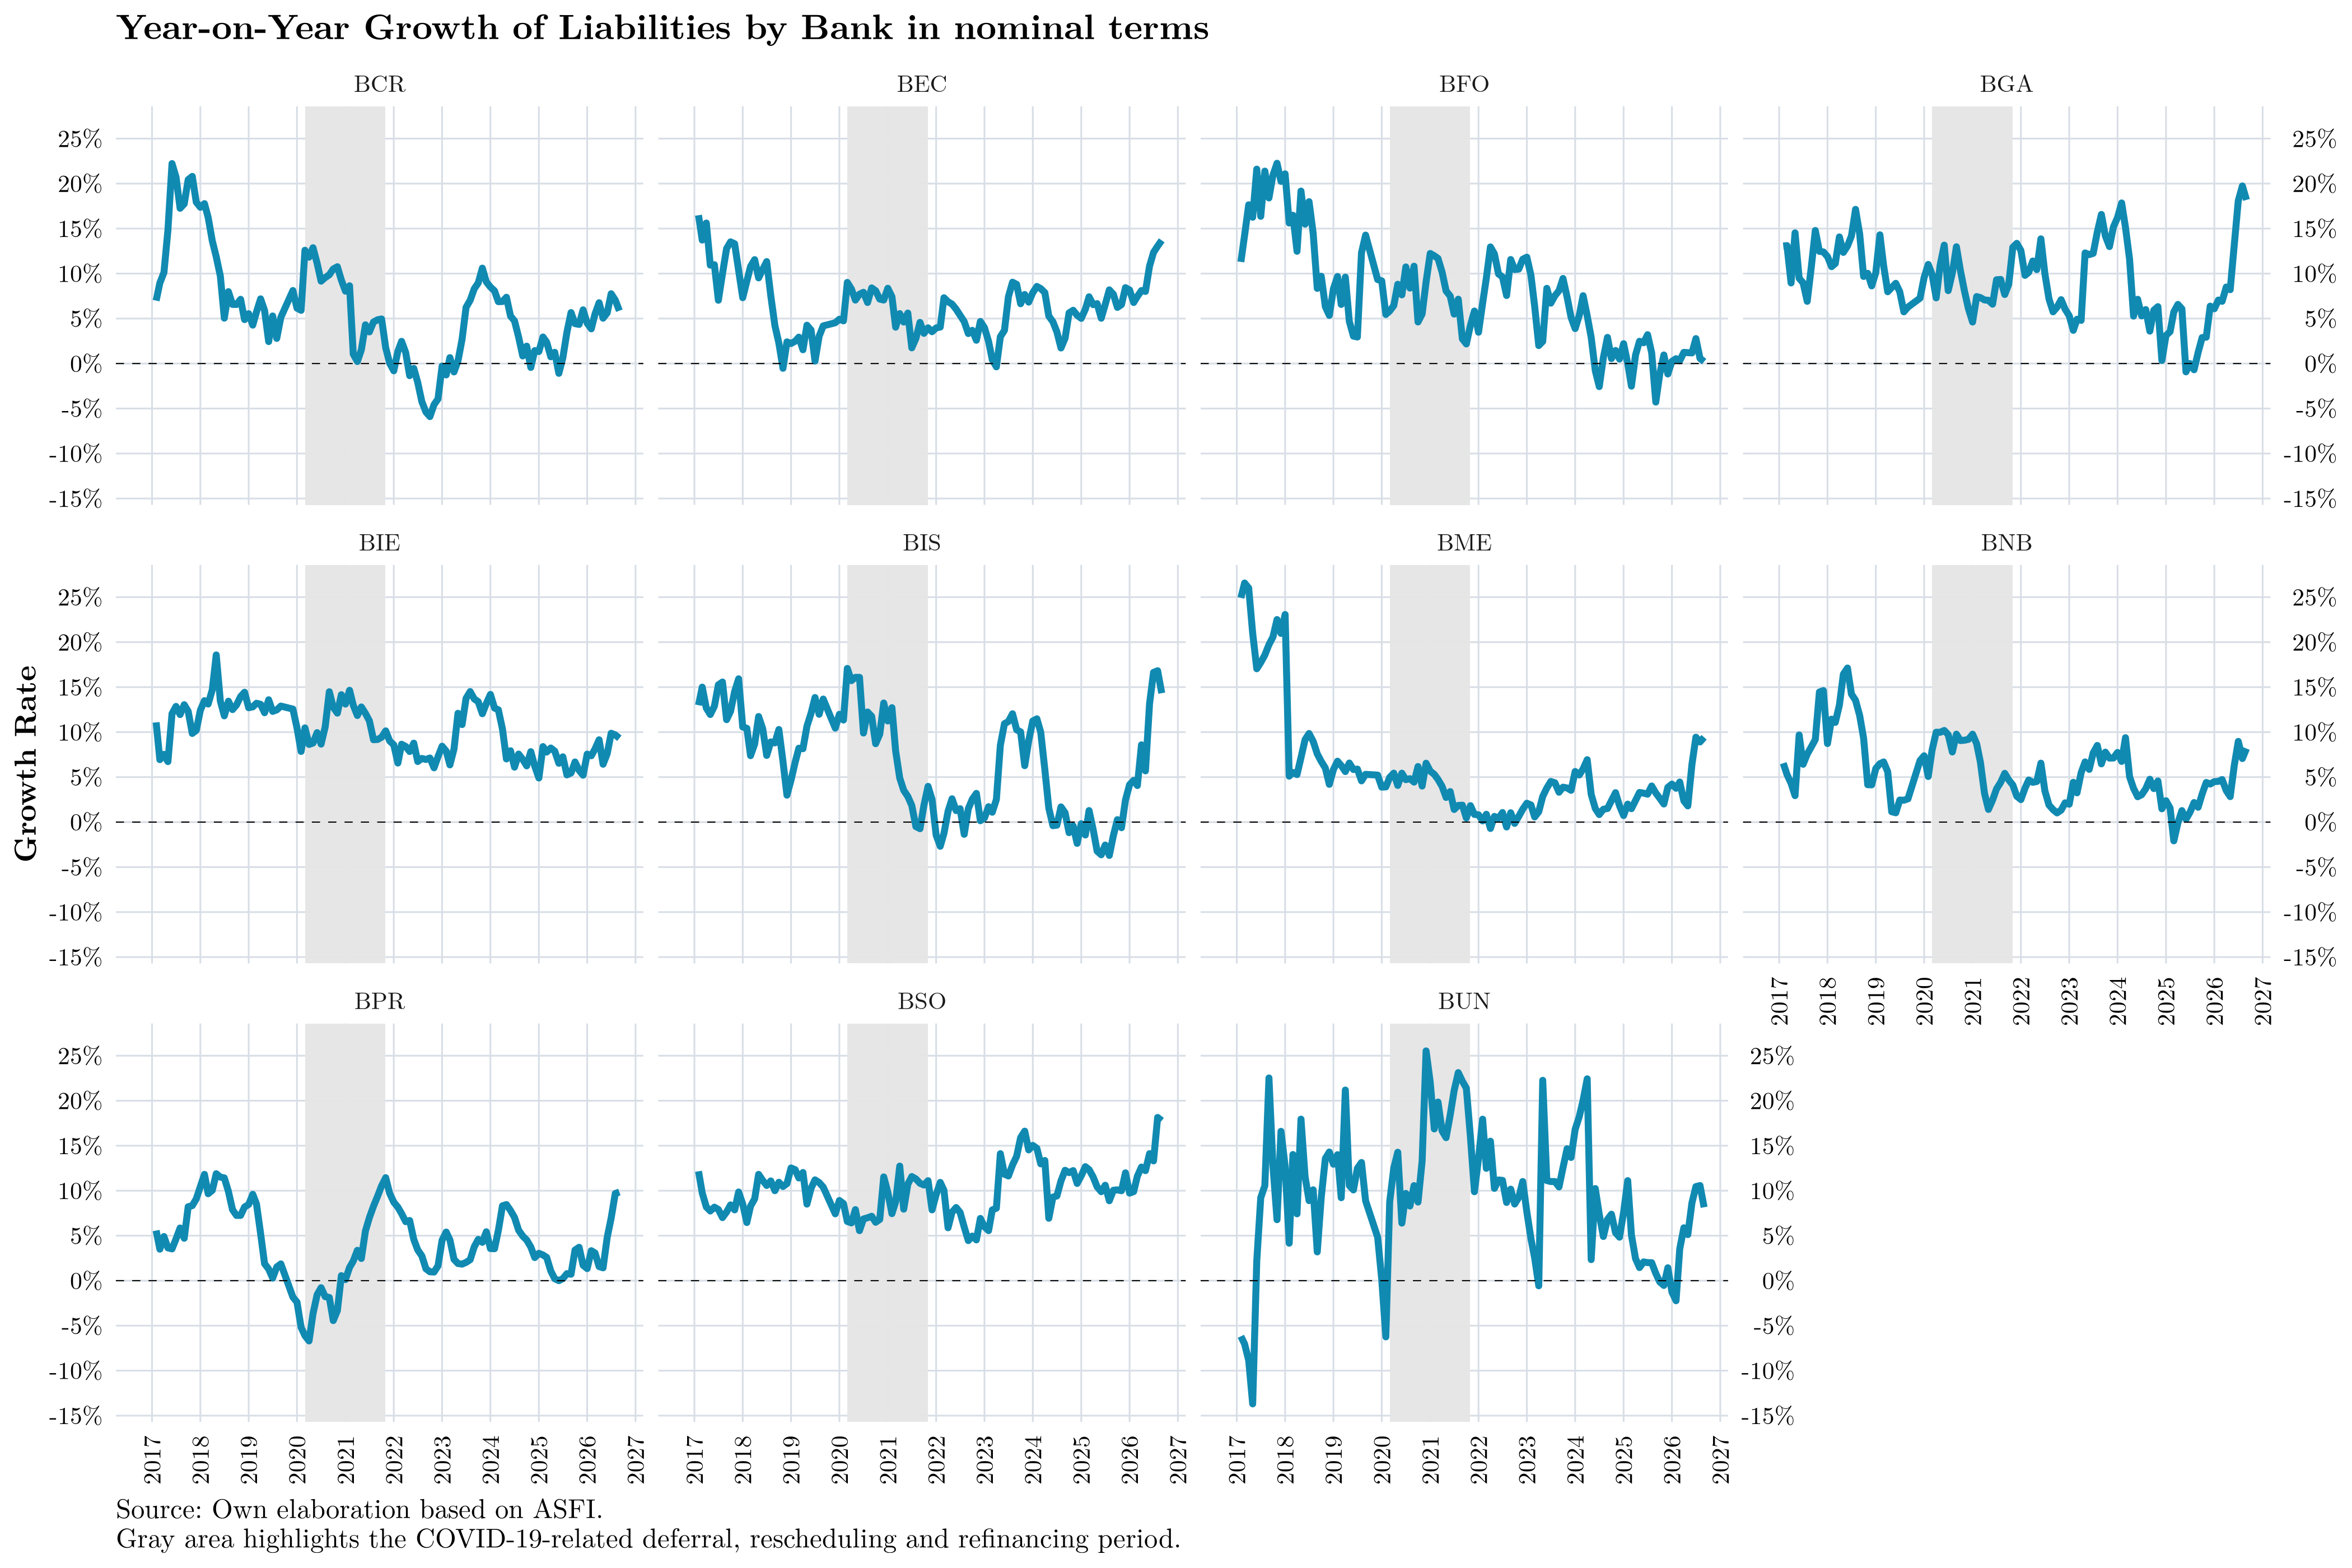
The chart above shows that, although bank liabilities are generally increasing, not all institutions are growing at the same pace. Some have managed to maintain year-on-year liability growth above the system average, while others have experienced a significant slowdown. This may reflect differences in funding strategies, depositor confidence, and banks’ ability to offer attractive products in a competitive environment.
Contributions to Liability Growth
As with asset growth, it is possible to decompose the growth of liabilities. The following chart shows this decomposition by account type over time. This evolution mirrors that of assets:
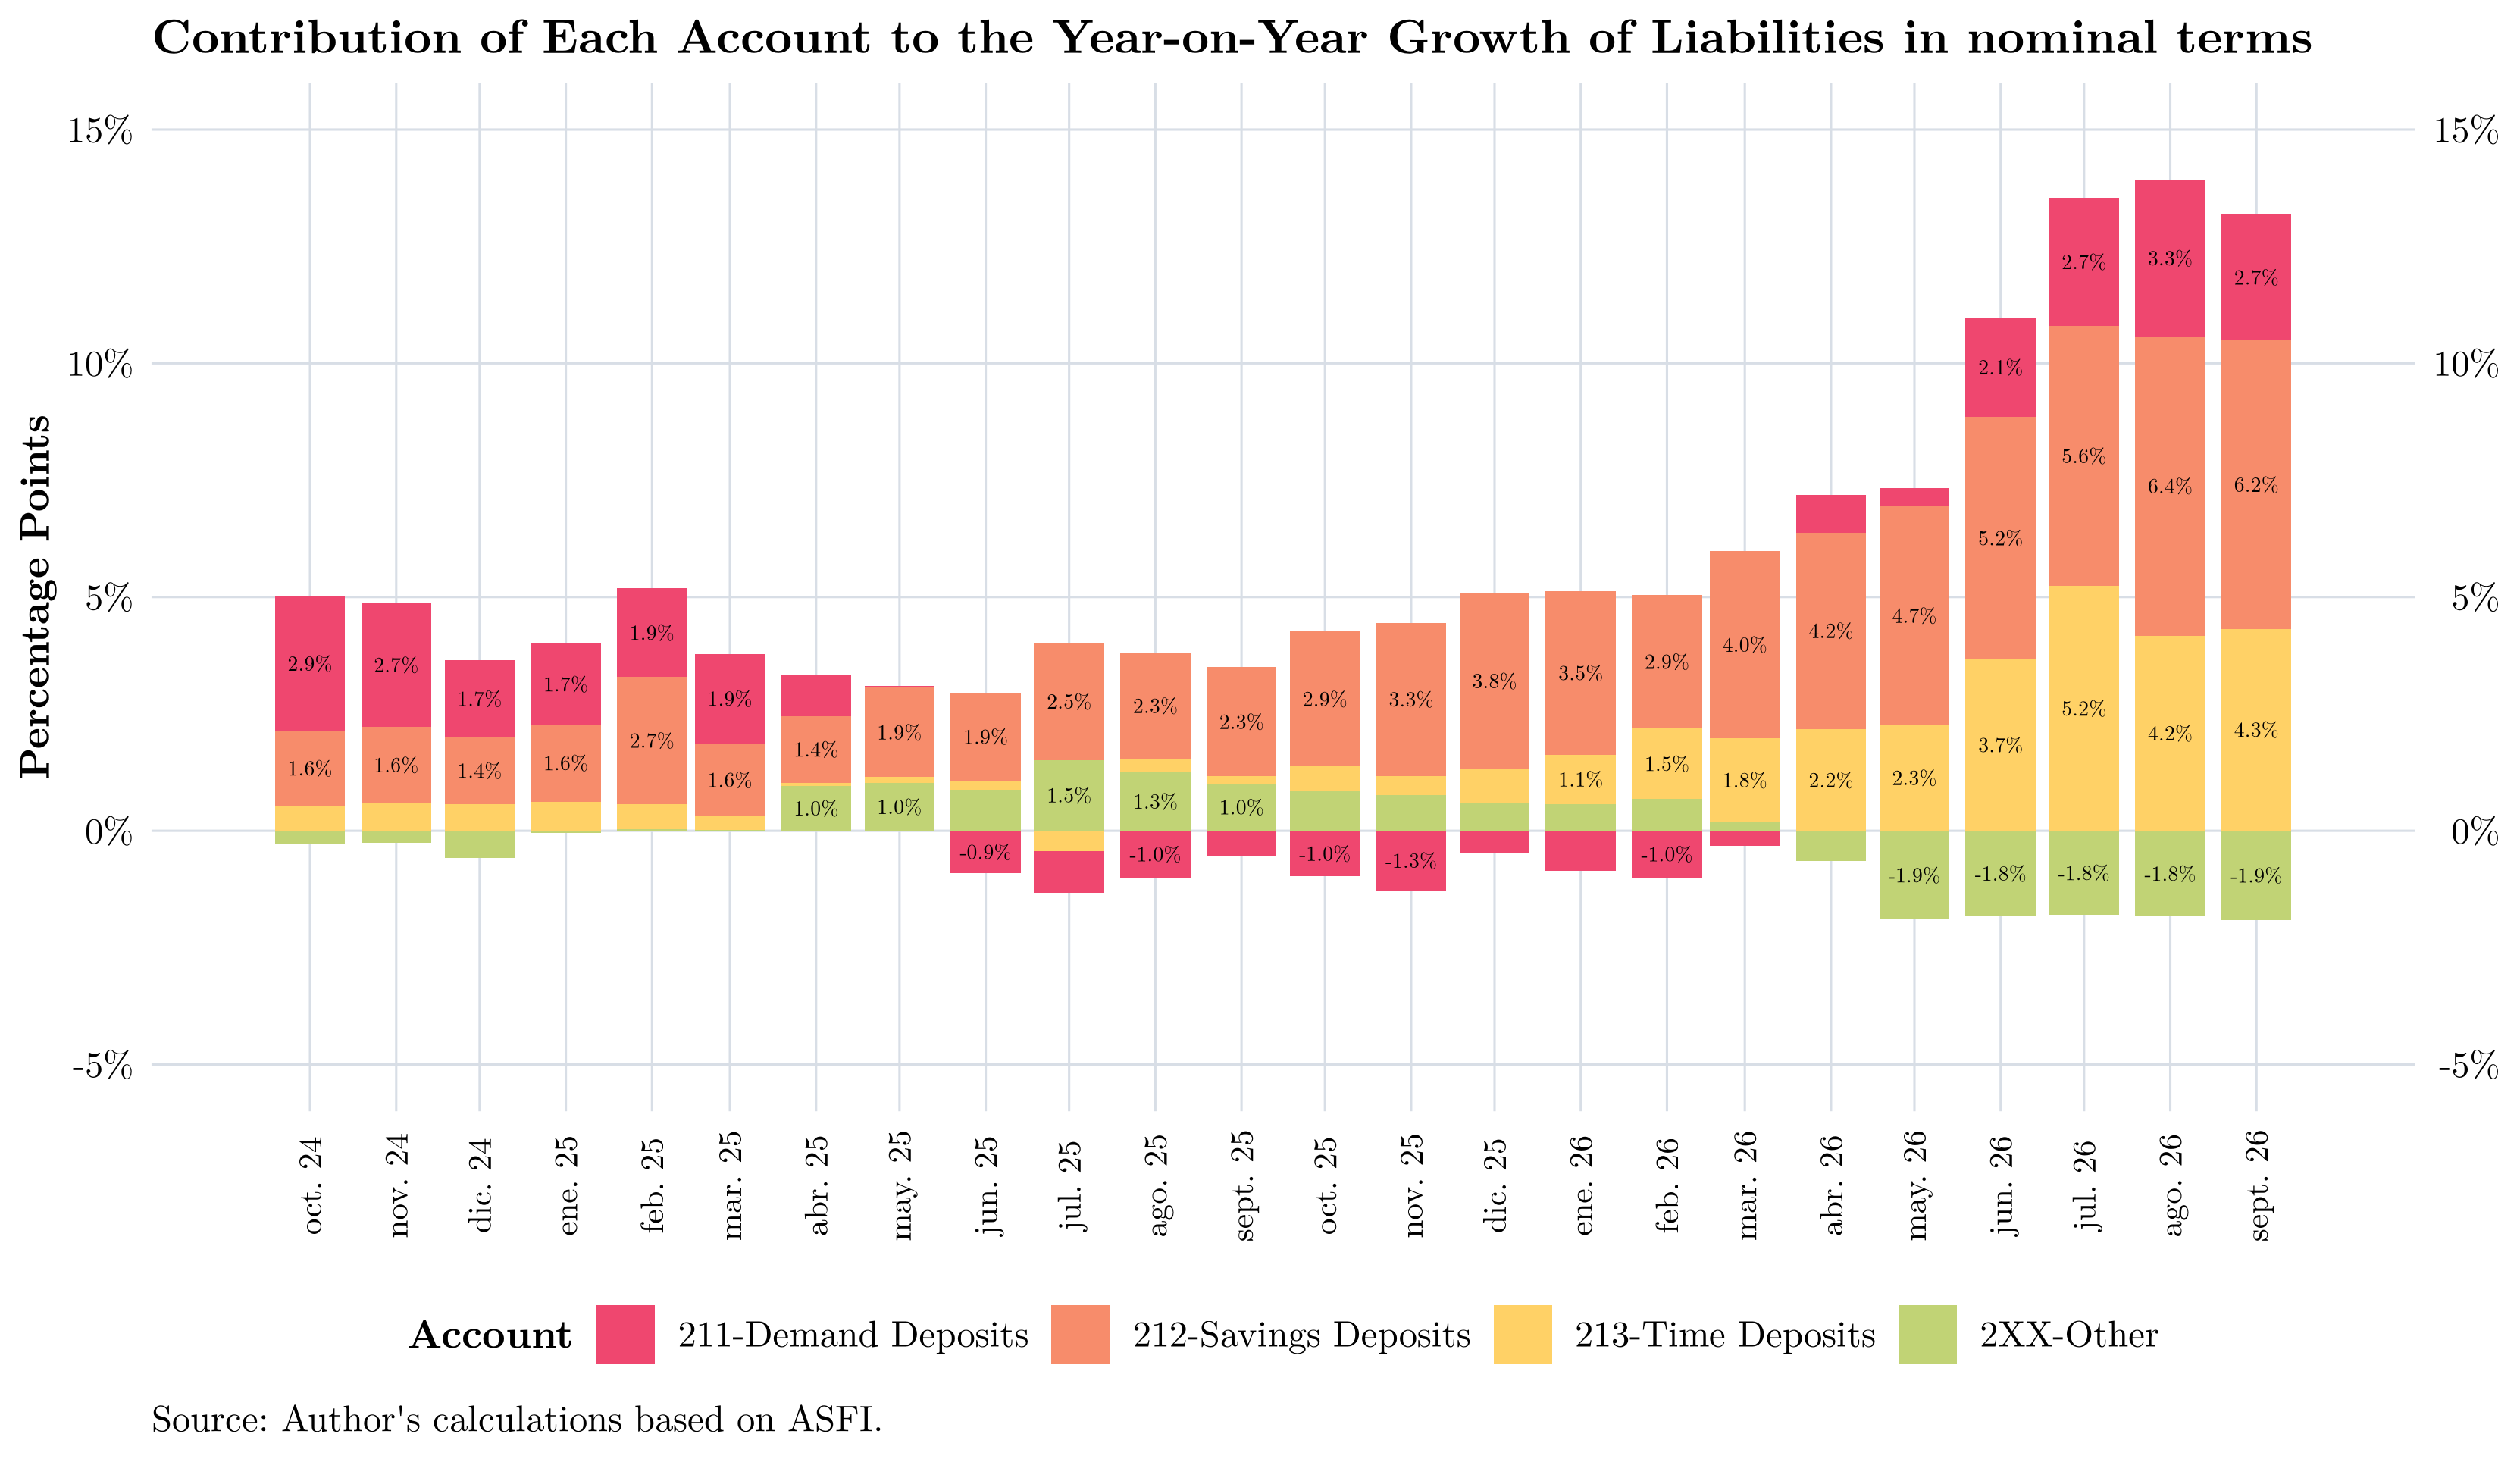
What can be inferred from the chart above?
- Banking-system liability growth has been driven mainly by savings accounts, at least since May 2025.
- Beginning in February 2026, term deposits started making a more significant contribution to year-on-year liability growth.
- Although current accounts made a negative contribution to year-on-year liability growth for several months, their contribution turned positive from June 2026 onward, supporting liability growth.
The following table shows year-on-year growth for the latest available month, broken down by deposit type:
Contribution of each deposit type to year-on-year liability growth
| Deposit type | Contribution |
|---|---|
| 211 — Current accounts | 2.7% |
| 212 — Savings deposits | 6.2% |
| 213 — Term deposits | 4.3% |
| 2XX — Other | -1.9% |
| Total | 11.3% |
Finally, year-on-year growth can also be examined by deposit type:
Lending: The Loan Portfolio
According to ASFI’s Chart of Accounts Manual for Financial Institutions, account 130.00, the Loan Portfolio category:
Comprises loans granted by the institution to third parties, arising from its main financial intermediation activity. The Loan Portfolio category is structured to disclose the repayment status of loans through accounts for performing, overdue, and loans under legal recovery proceedings, as well as performing, overdue, and loans under legal recovery proceedings that have been rescheduled or restructured. Subaccounts are organized by lending modality, except for certain financing arrangements that are reported separately when they are subject to specific lending requirements.
Relative to the previous month, the loan portfolio increased by BOB 859 million (0.4%); relative to the previous quarter, it rose by BOB 1,968 million (1.0%); and relative to the same month of the previous year, it increased by BOB 9,220 million (4.7%).
This section analyzes developments in the Bolivian banking system’s loan portfolio. Loans are the main source of interest income and one of the principal assets of Bolivian banks.
Loan Portfolio by Type of Credit
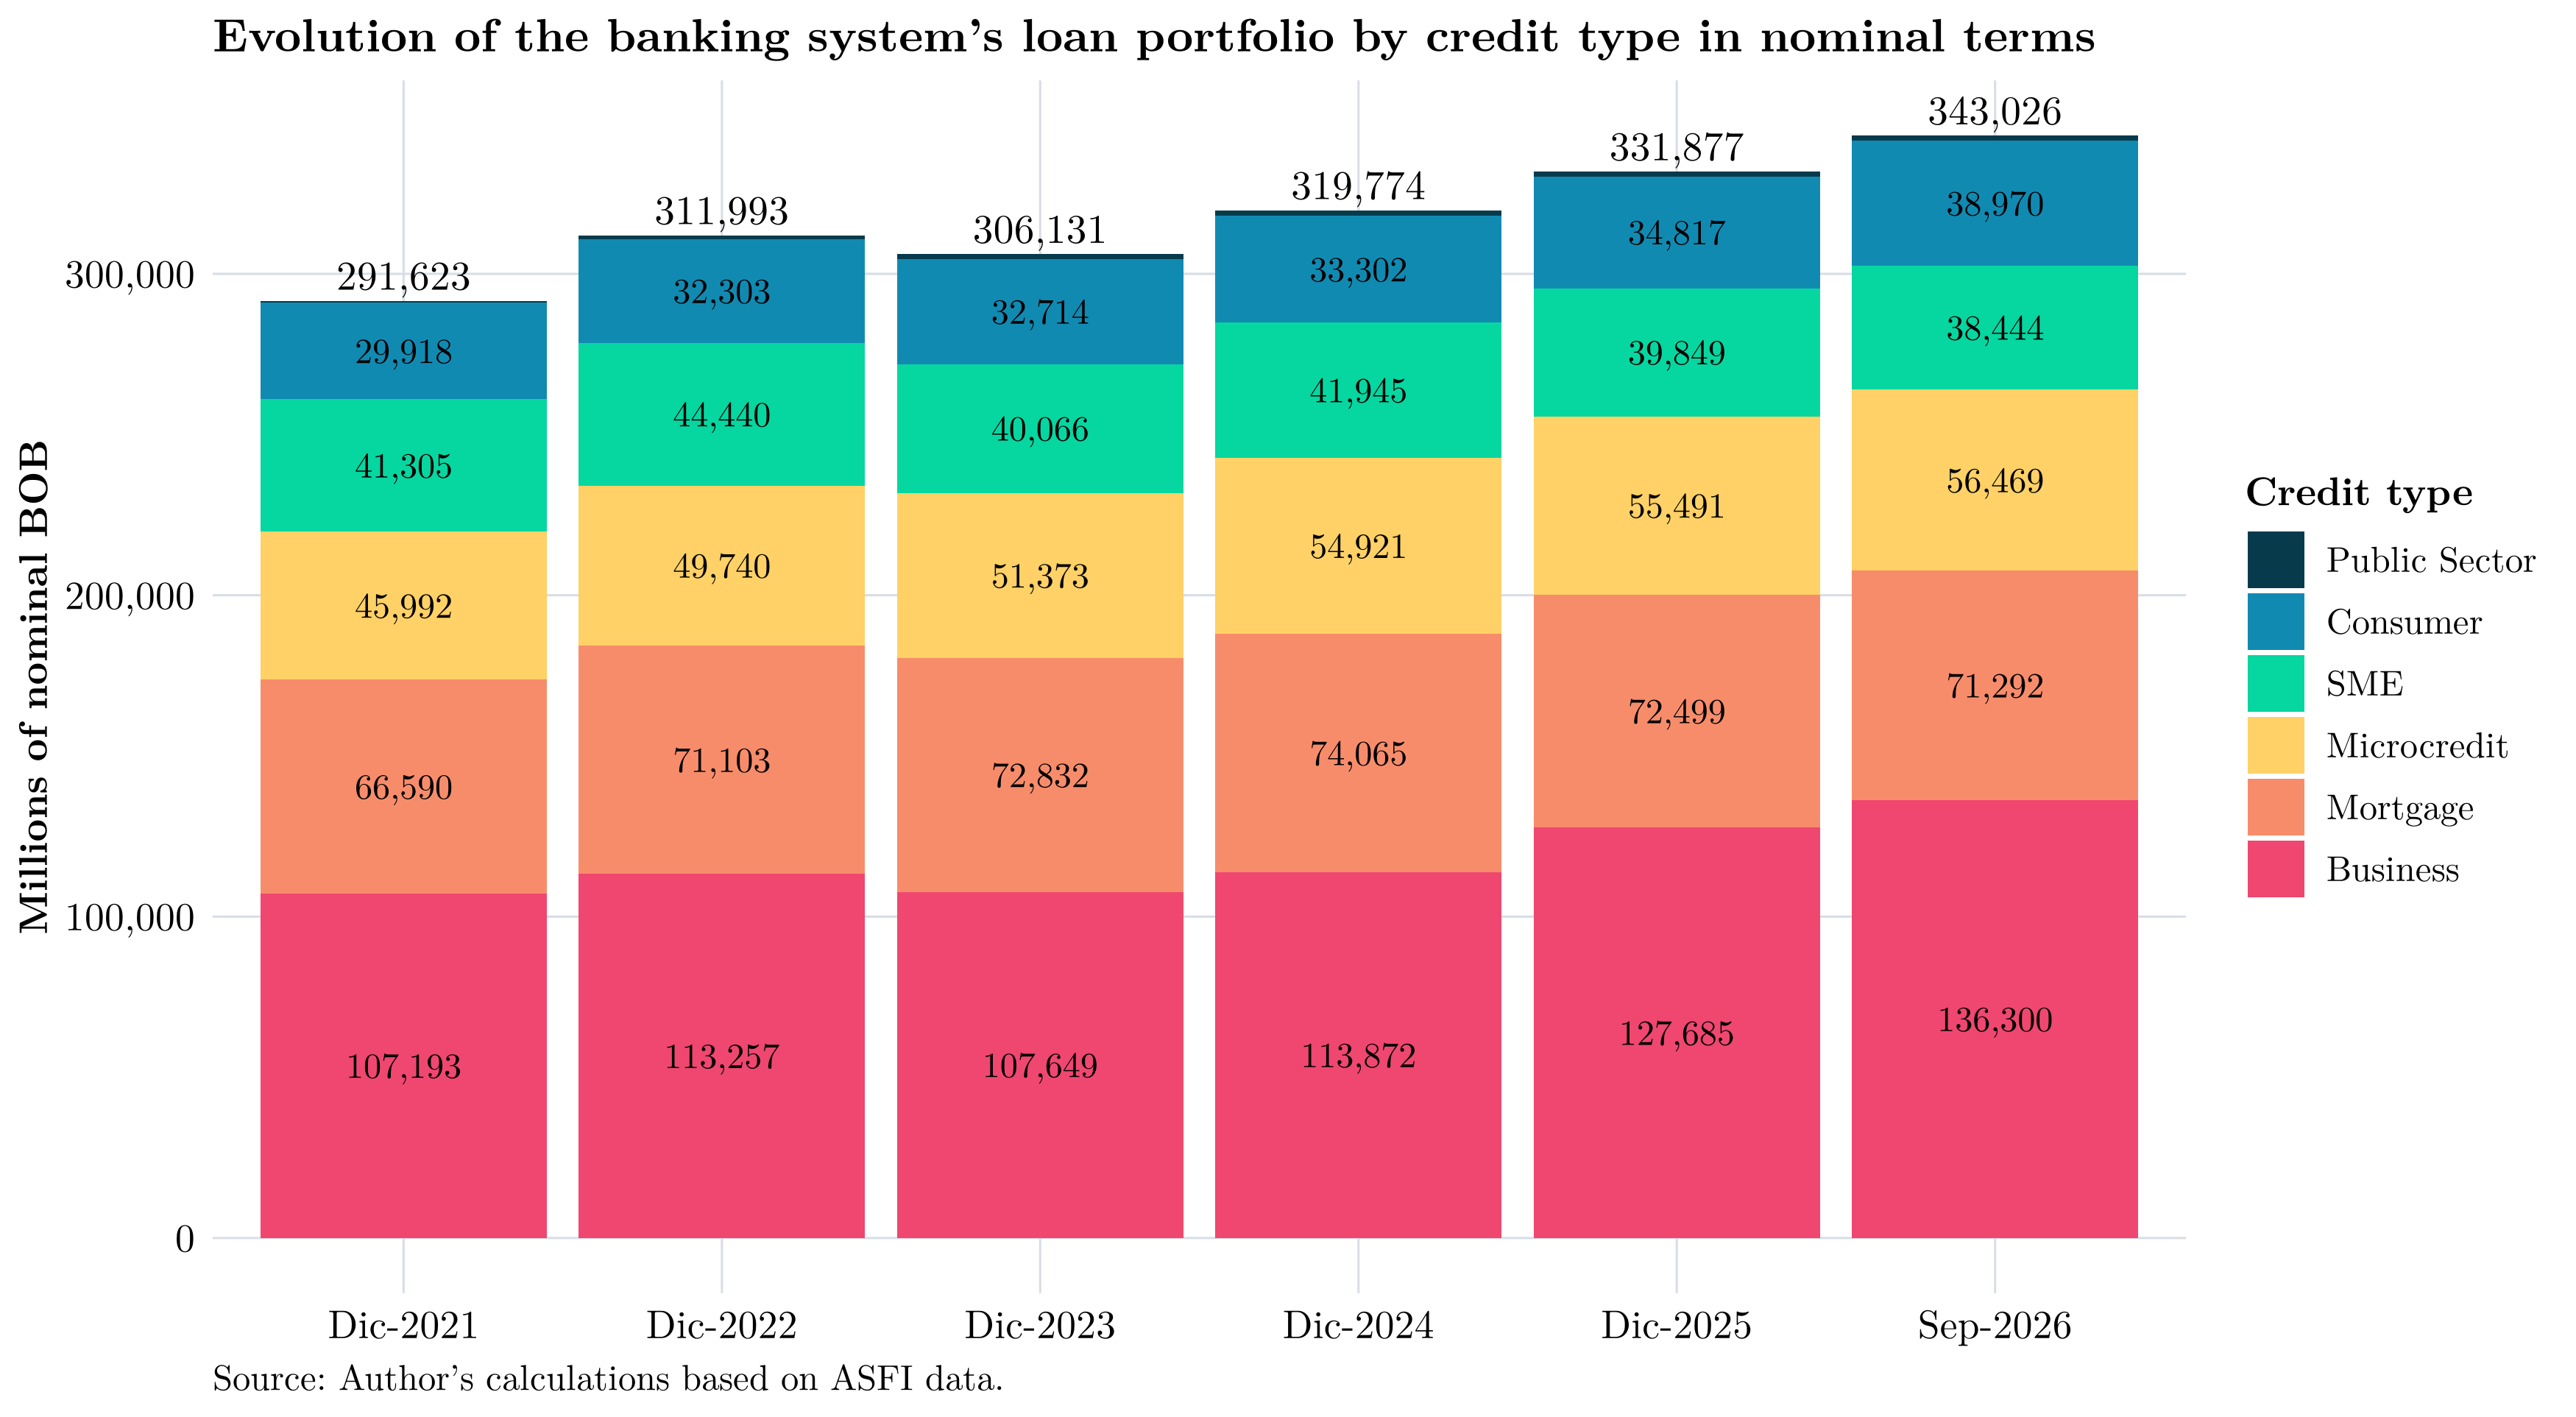
One way to analyze the loan portfolio is by type of credit. As shown in the following chart, the portfolio has grown steadily over time, while the relative shares of each loan category have remained fairly stable.
Growth
A first question is how the loan portfolio has grown in recent years. This matters for several reasons, because both excessive growth and insufficient growth can be symptoms of other underlying problems. On the one hand, rapid growth may signal a credit expansion that, if poorly managed, could lead to solvency problems in the future. On the other hand, slow growth may indicate a contraction in aggregate demand, which may in turn point to problems in the real economy.
The following chart shows the year-on-year growth of the loan portfolio—the current month relative to the same month of the previous year—excluding loan-loss provisions and accrued interest receivable. It illustrates, for example, the slowdown in portfolio growth, which stabilized at around 5% in 2025 and 2026:
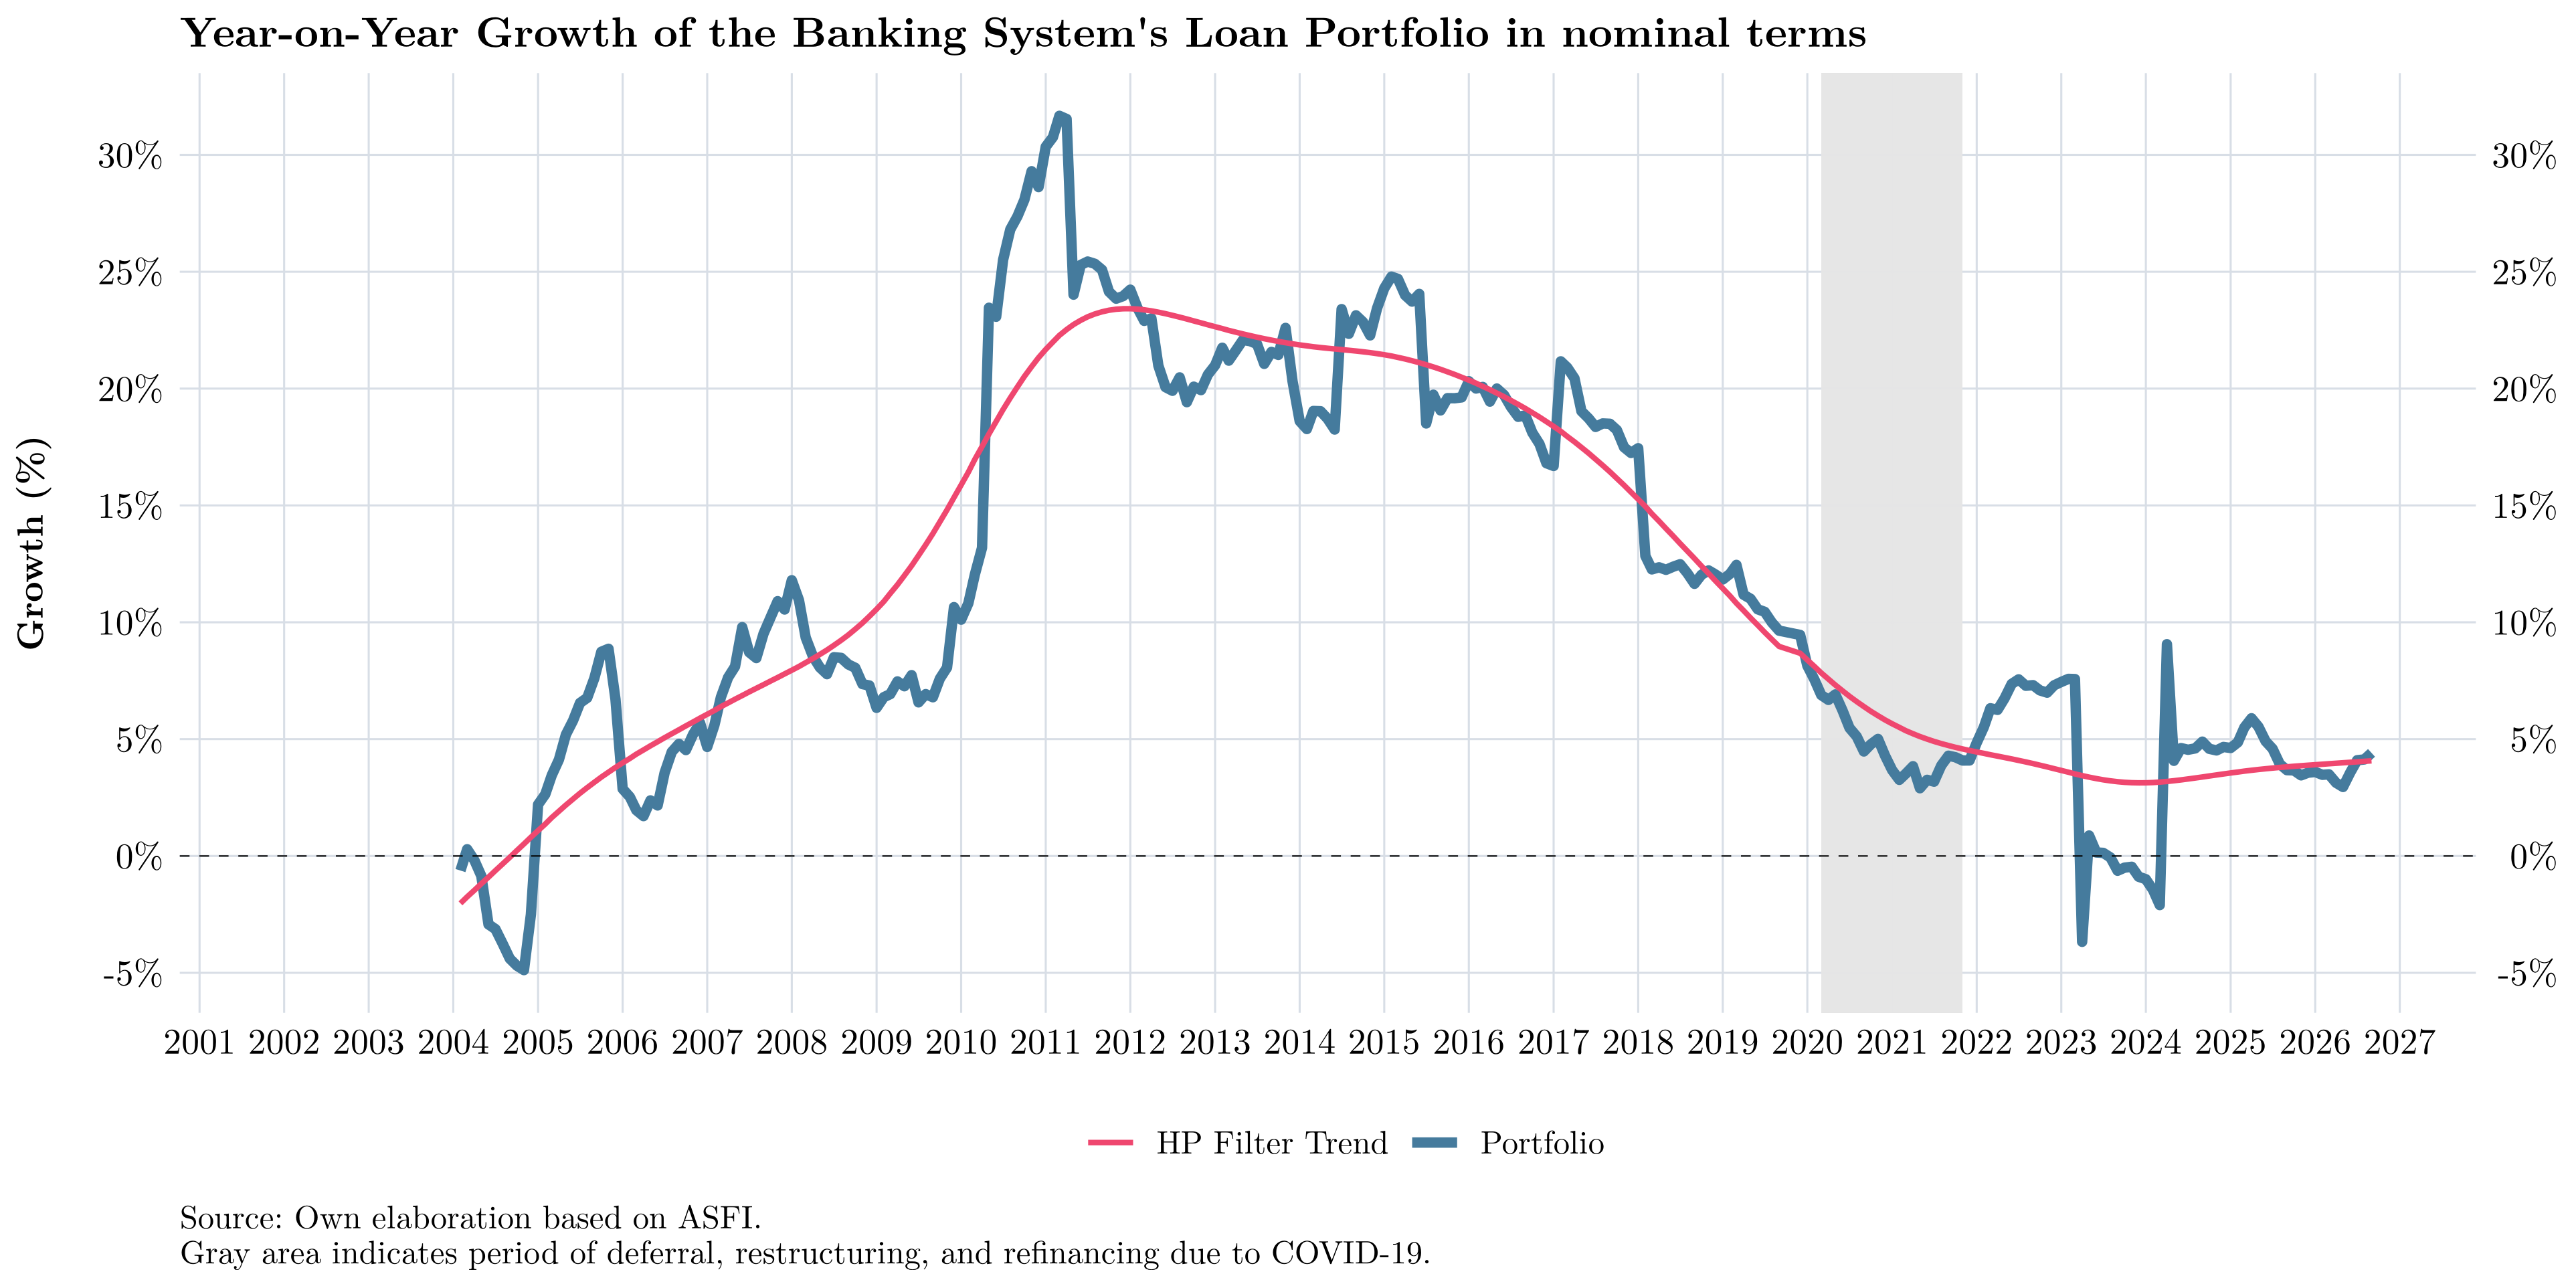
In addition, the loan portfolio grew strongly during the second half of the 2010s and reached its peak growth rate around March 2011. From that point onward, growth lost momentum and, although it remained positive and in double digits, it gradually decelerated over time.
By financial institution:
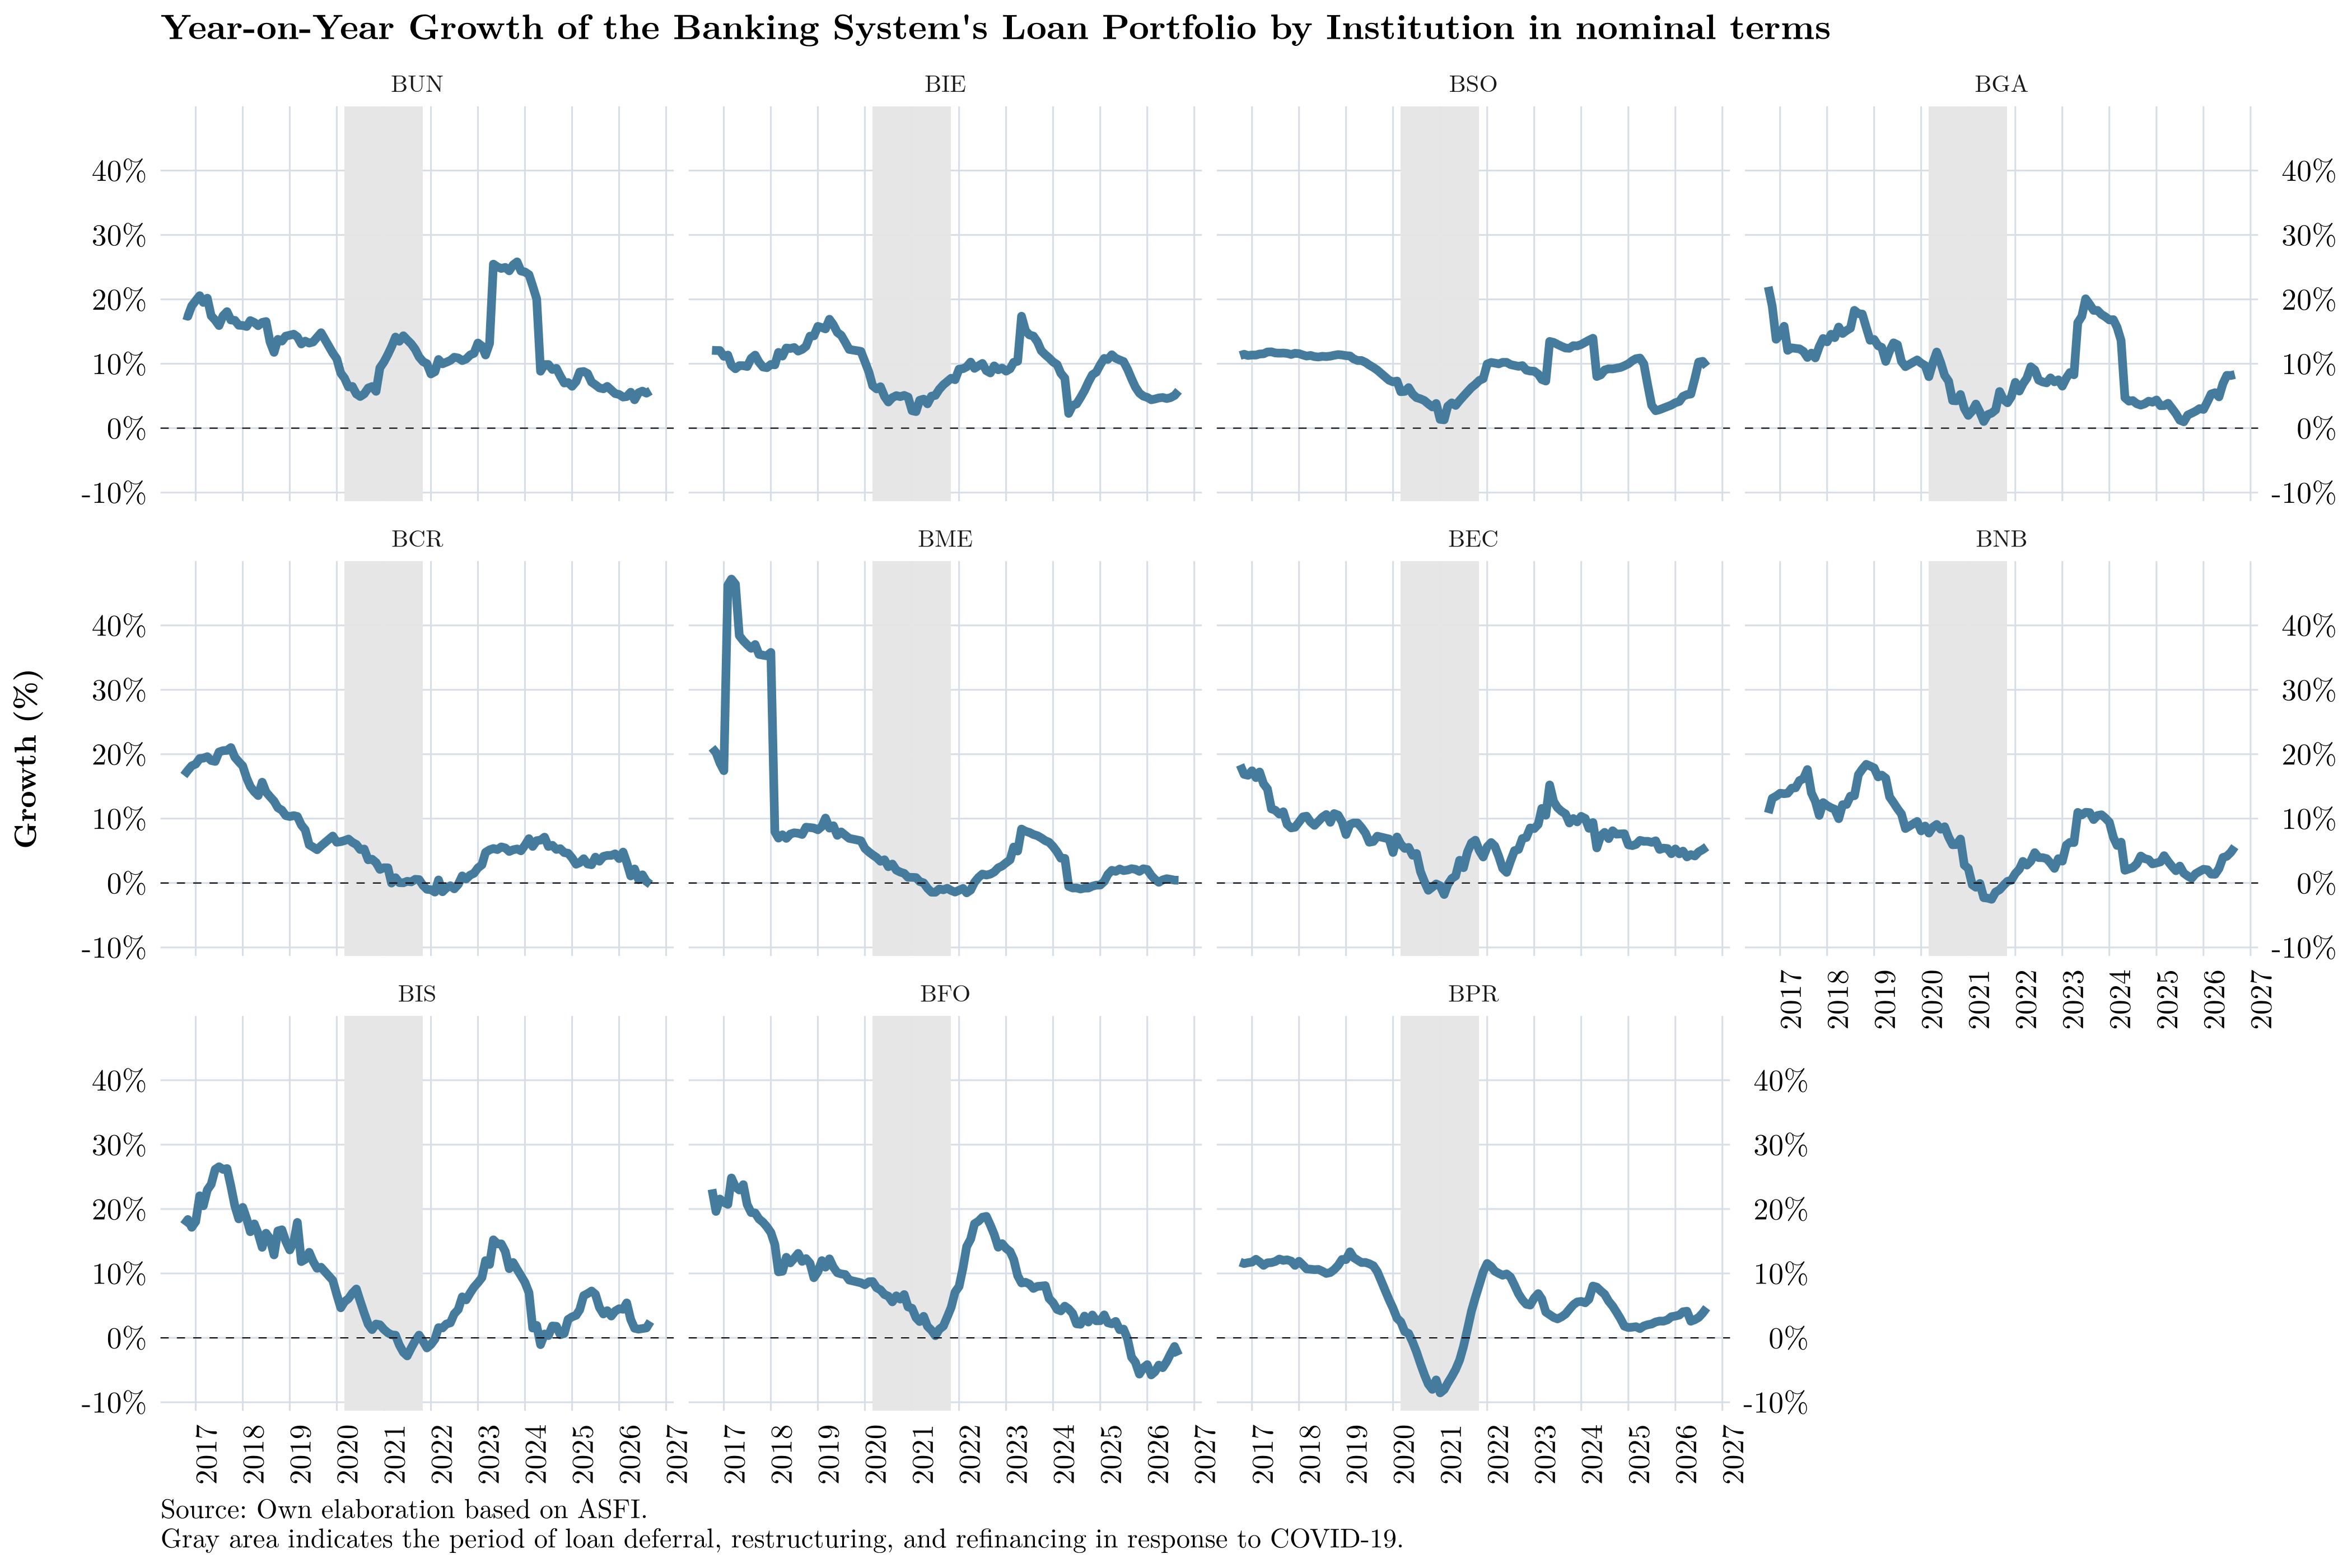
The preceding chart indicates that loan growth has slowed considerably at most institutions, many of which are now expanding their portfolios more slowly than in the early months of the pandemic. This situation warrants close monitoring, as it reflects the slowdown in the domestic economy and, consequently, weaker demand for credit.
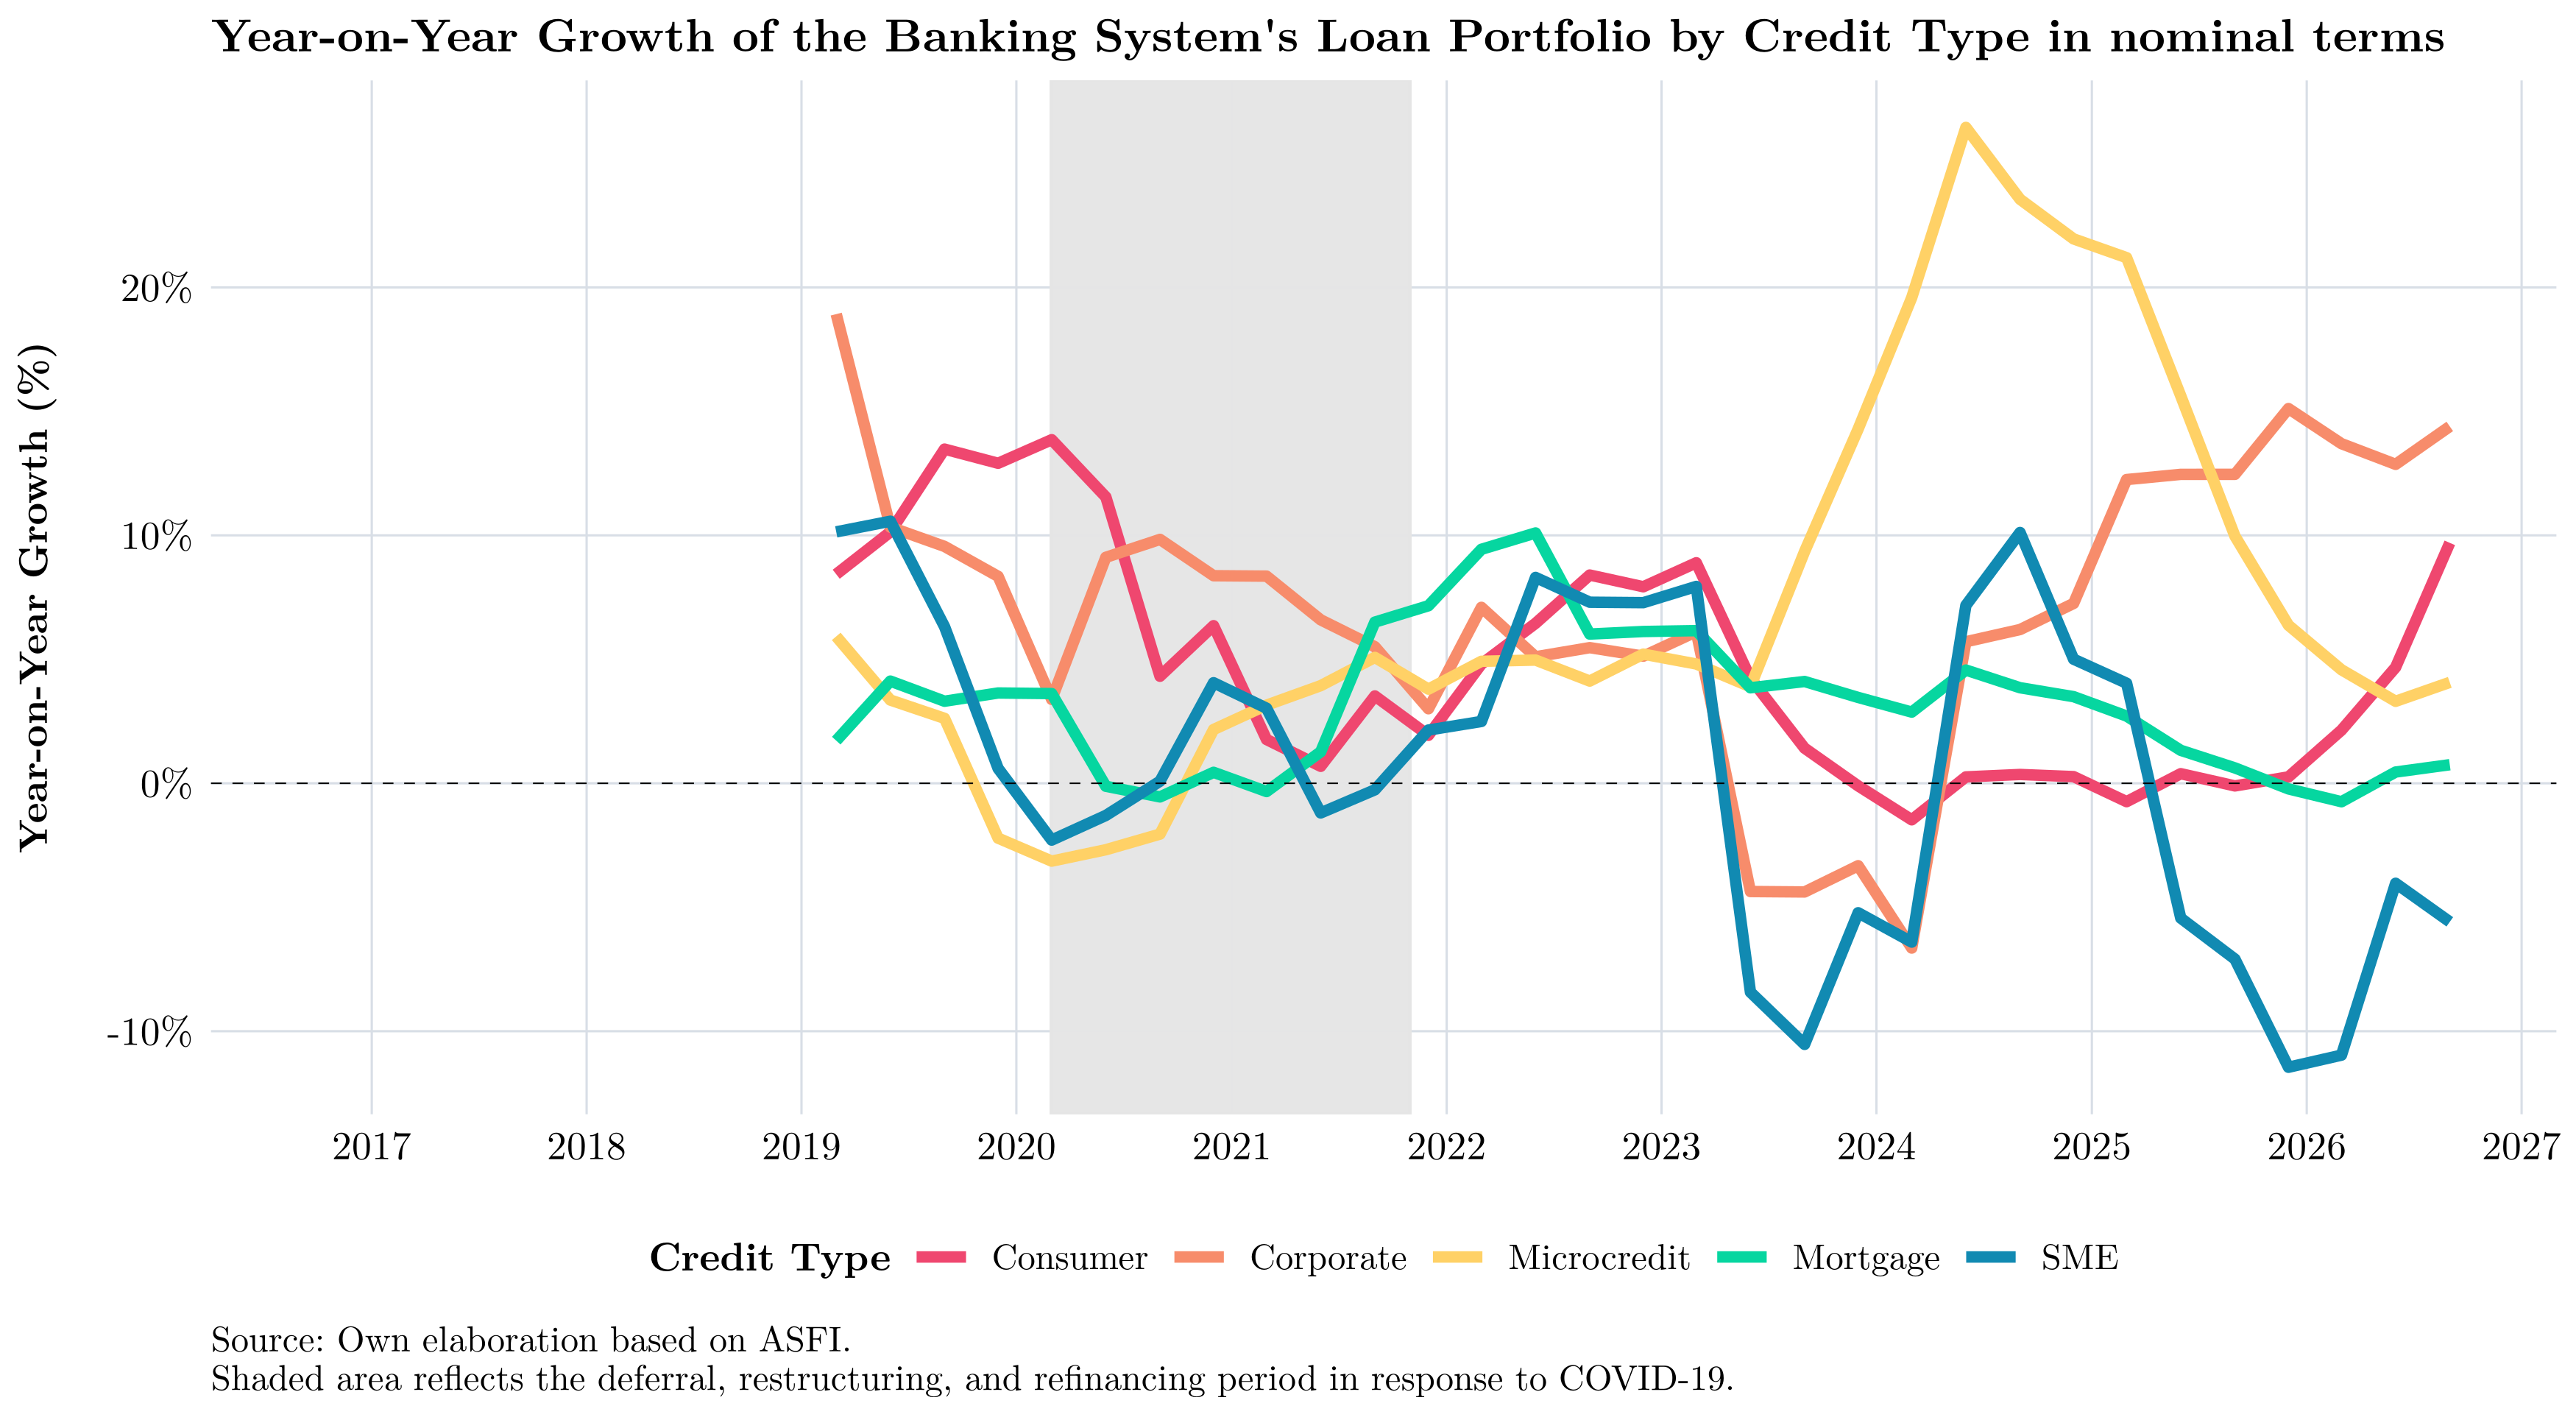
Growth by Type of Credit
Finally, with regard to growth, it is useful to examine how the loan portfolio performs by type of credit. The following chart shows year-on-year portfolio growth by credit category:
Credit Risk
Having described the dynamics of the loan portfolio, the next step is to assess its quality. The non-performing loan ratio and the rescheduled loan portfolio provide indications of whether macroeconomic deterioration is being transmitted to banks’ balance sheets.
Non-Performing Loans
The non-performing loan (NPL) ratio, commonly referred to as mora in Spanish, measures all loans with payments more than 30 days past due as a proportion of the total loan portfolio.
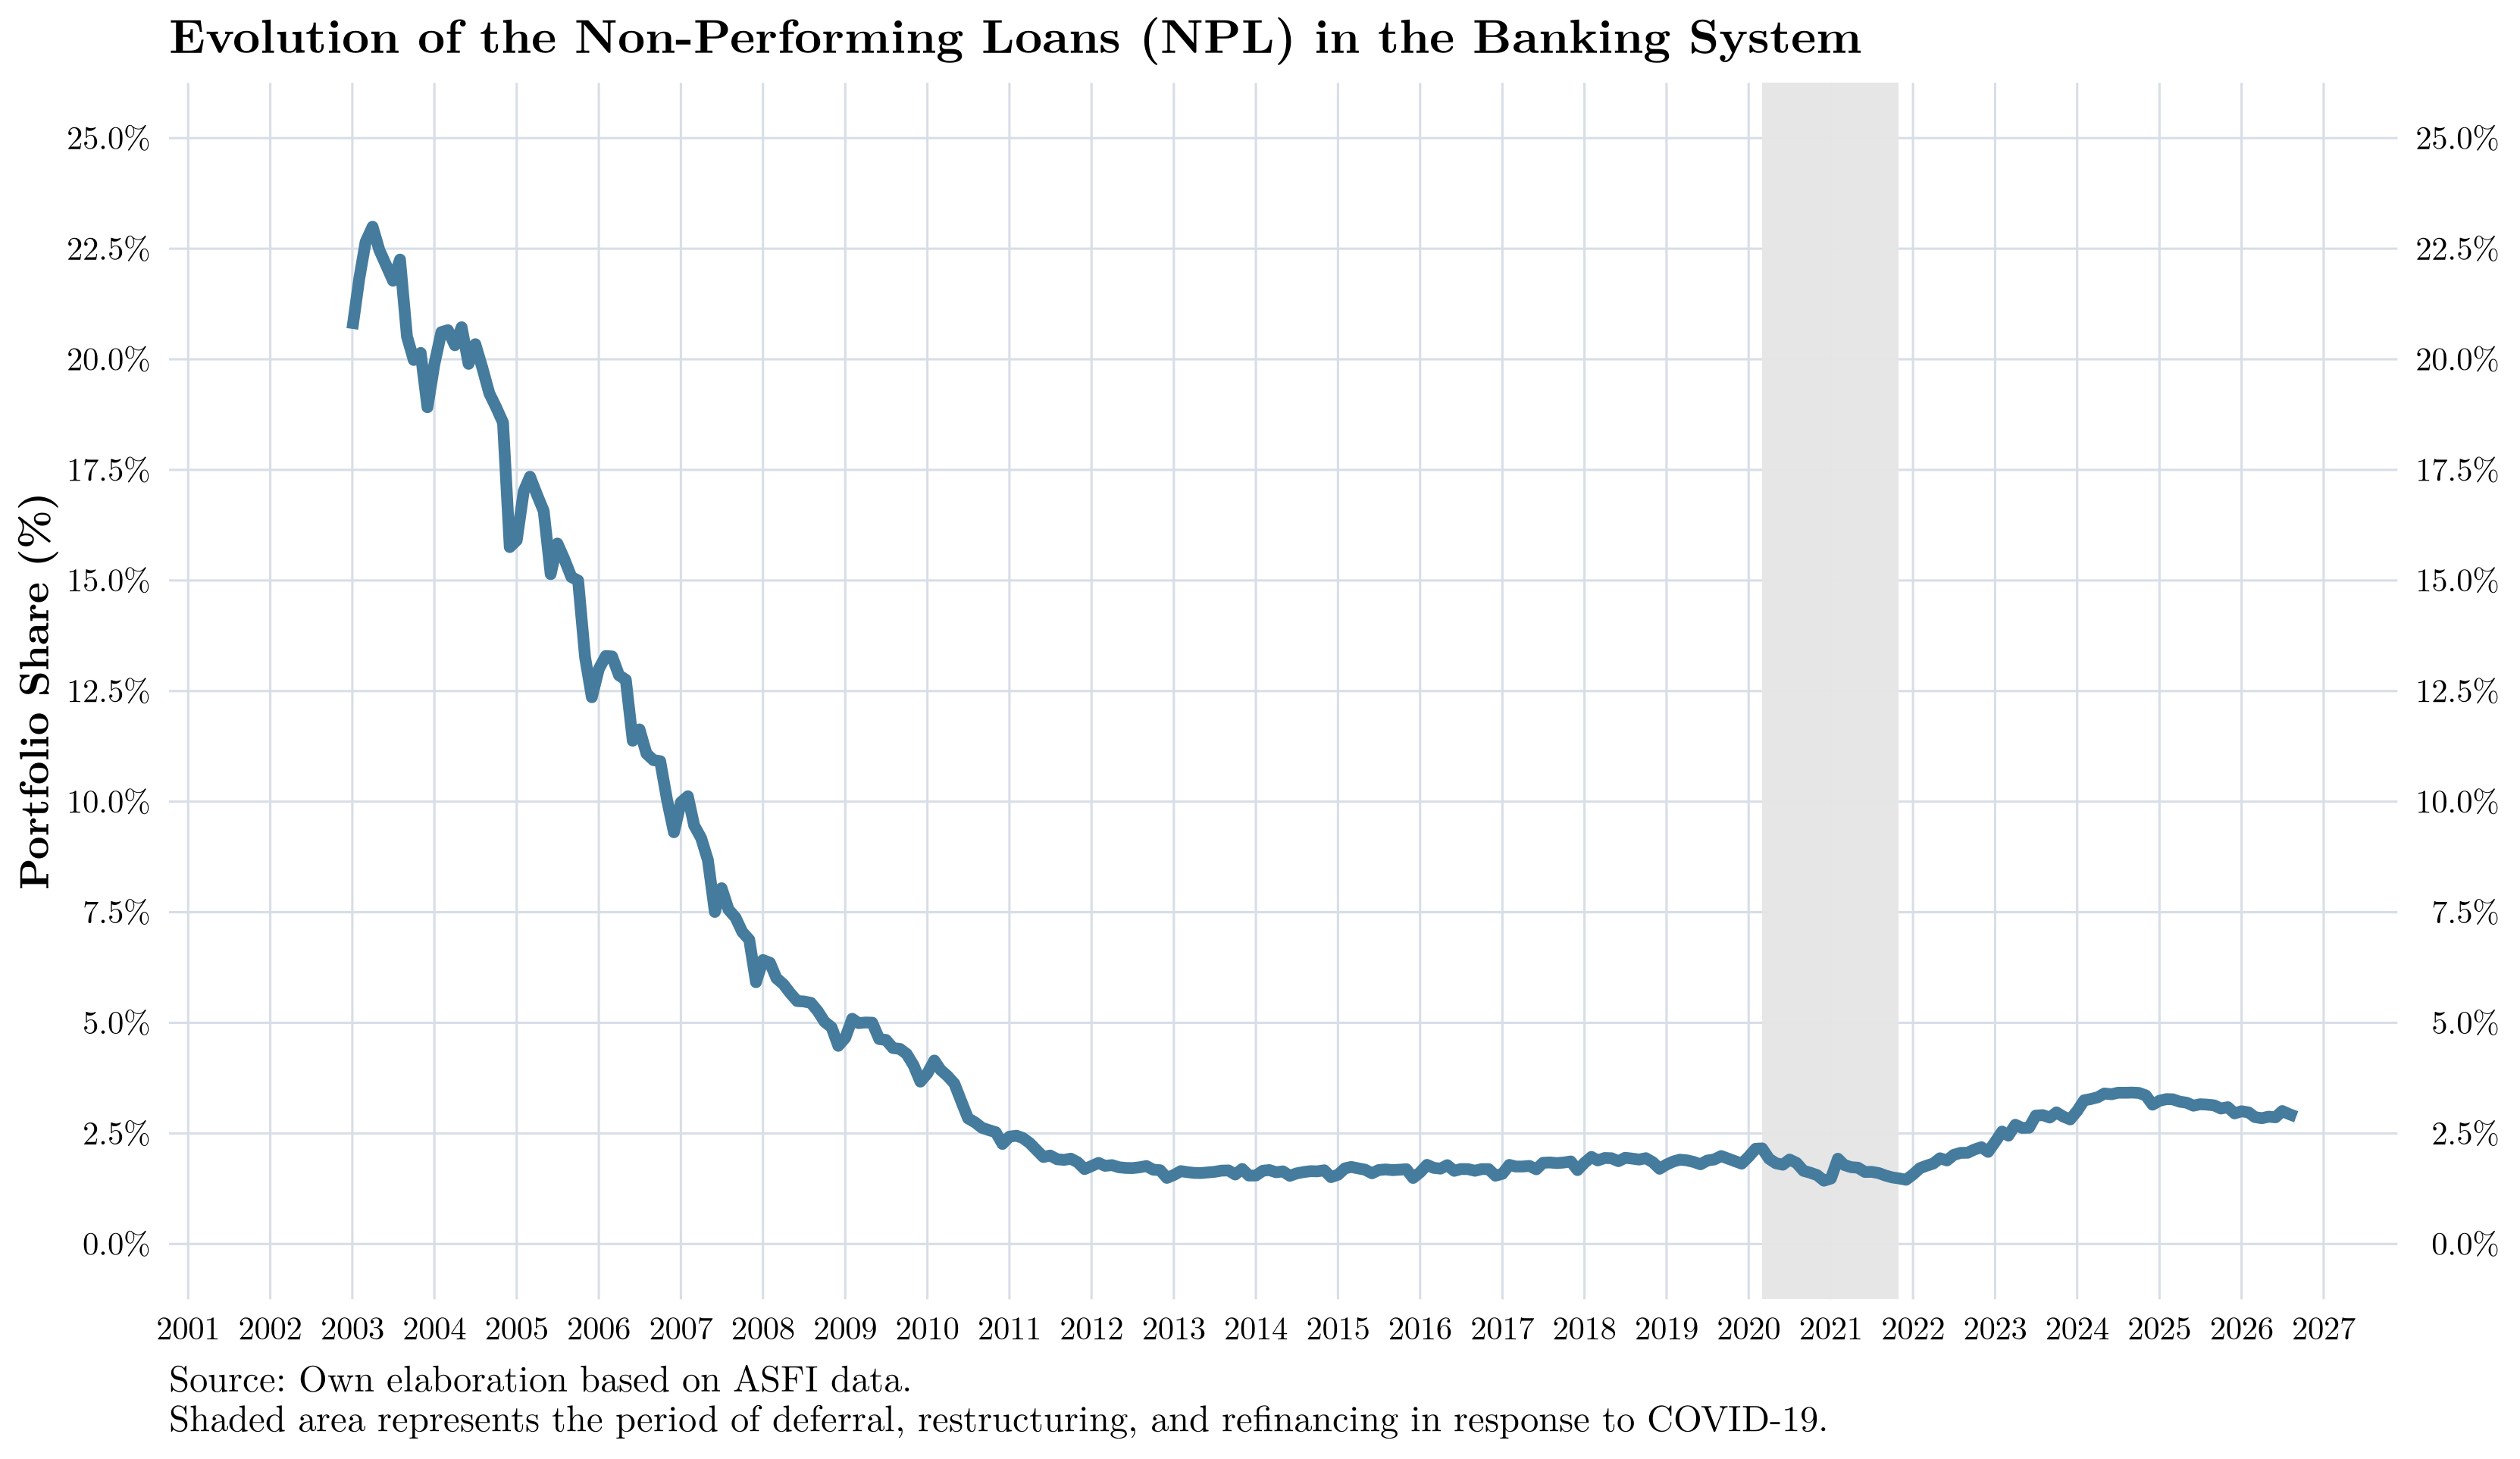
The following chart shows the evolution of the NPL ratio since January 2003. As the figure illustrates, in 2003 the ratio reached a peak of around 23%, a level that would be sufficient to declare the banking system insolvent. It is worth recalling that the crisis of the early 2000s was particularly difficult for the Bolivian economy.
Subsequently, however, the NPL ratio has remained under control. It returned to single digits in 2007 and reached a low of 1.55% in 2013. Thereafter, the ratio increased systematically but in a controlled manner, to around 1.8% before the pandemic, when refinancing, payment deferrals, and loan rescheduling measures caused the reported ratio to decline for accounting purposes.
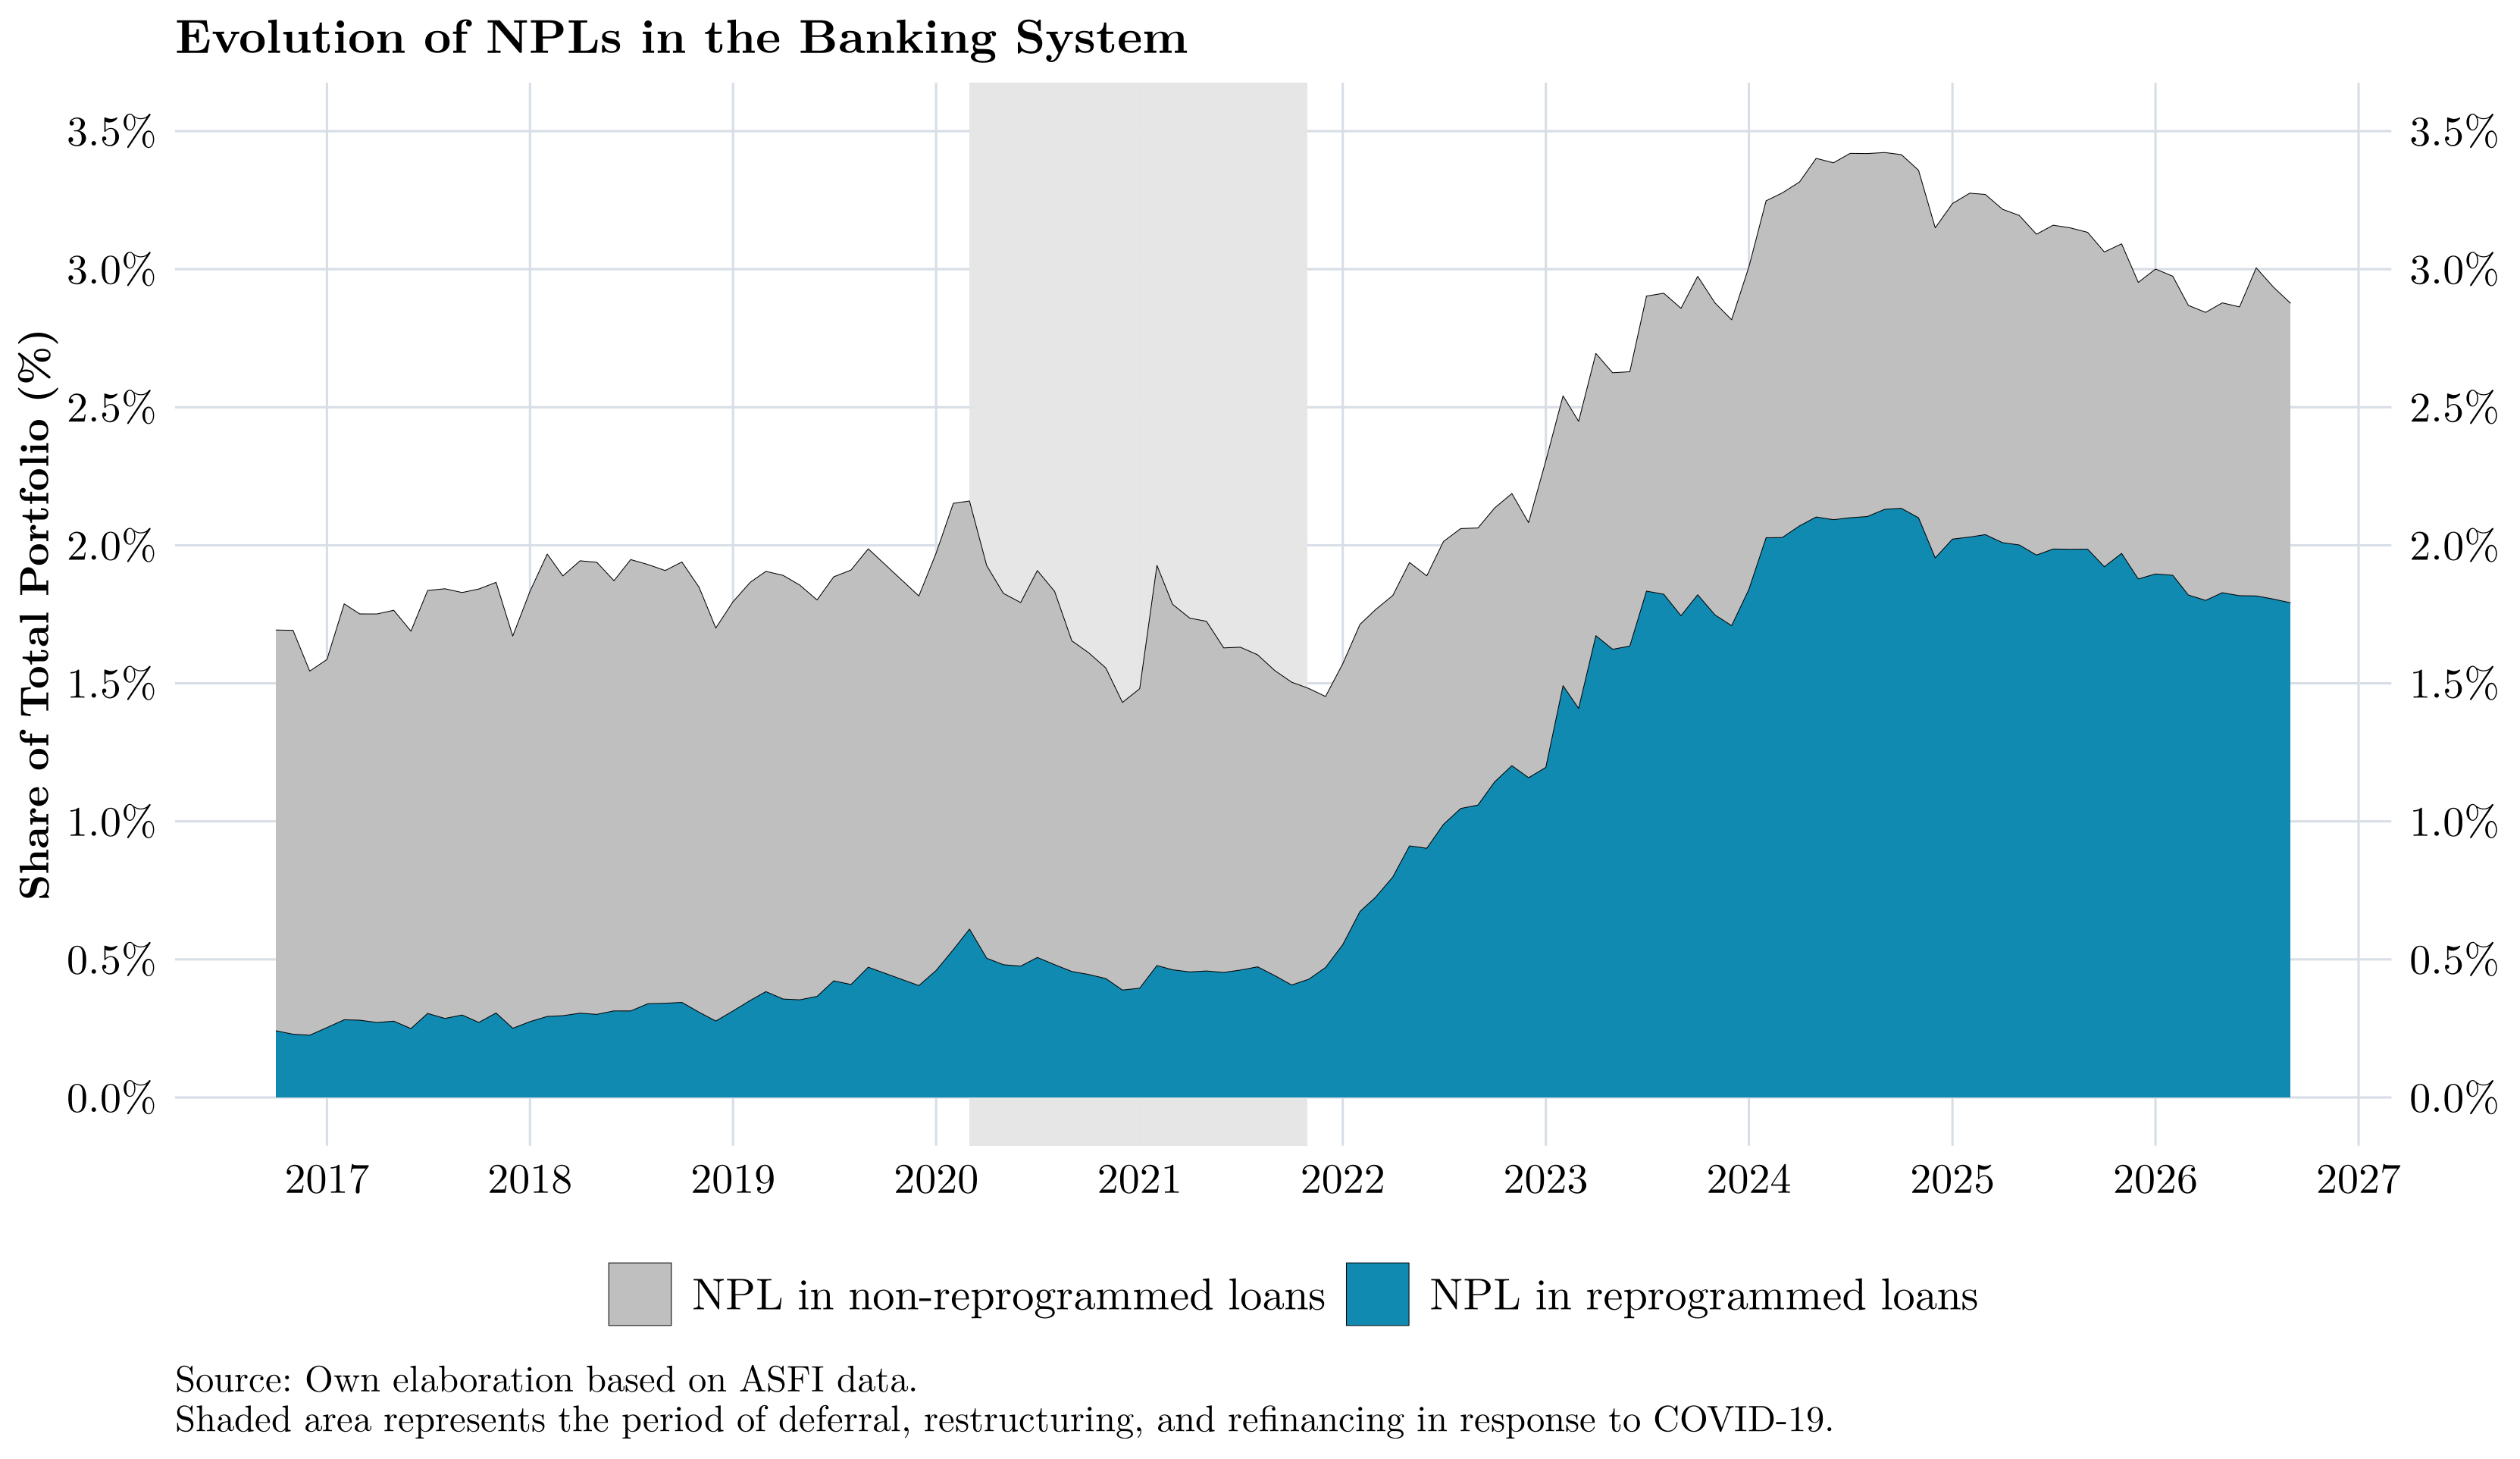
A shorter-term view of the NPL ratio shows that, although it is on a downward trend, it has almost doubled relative to the levels recorded after the pandemic. The current ratio stands at 2.88%, which is still historically low.
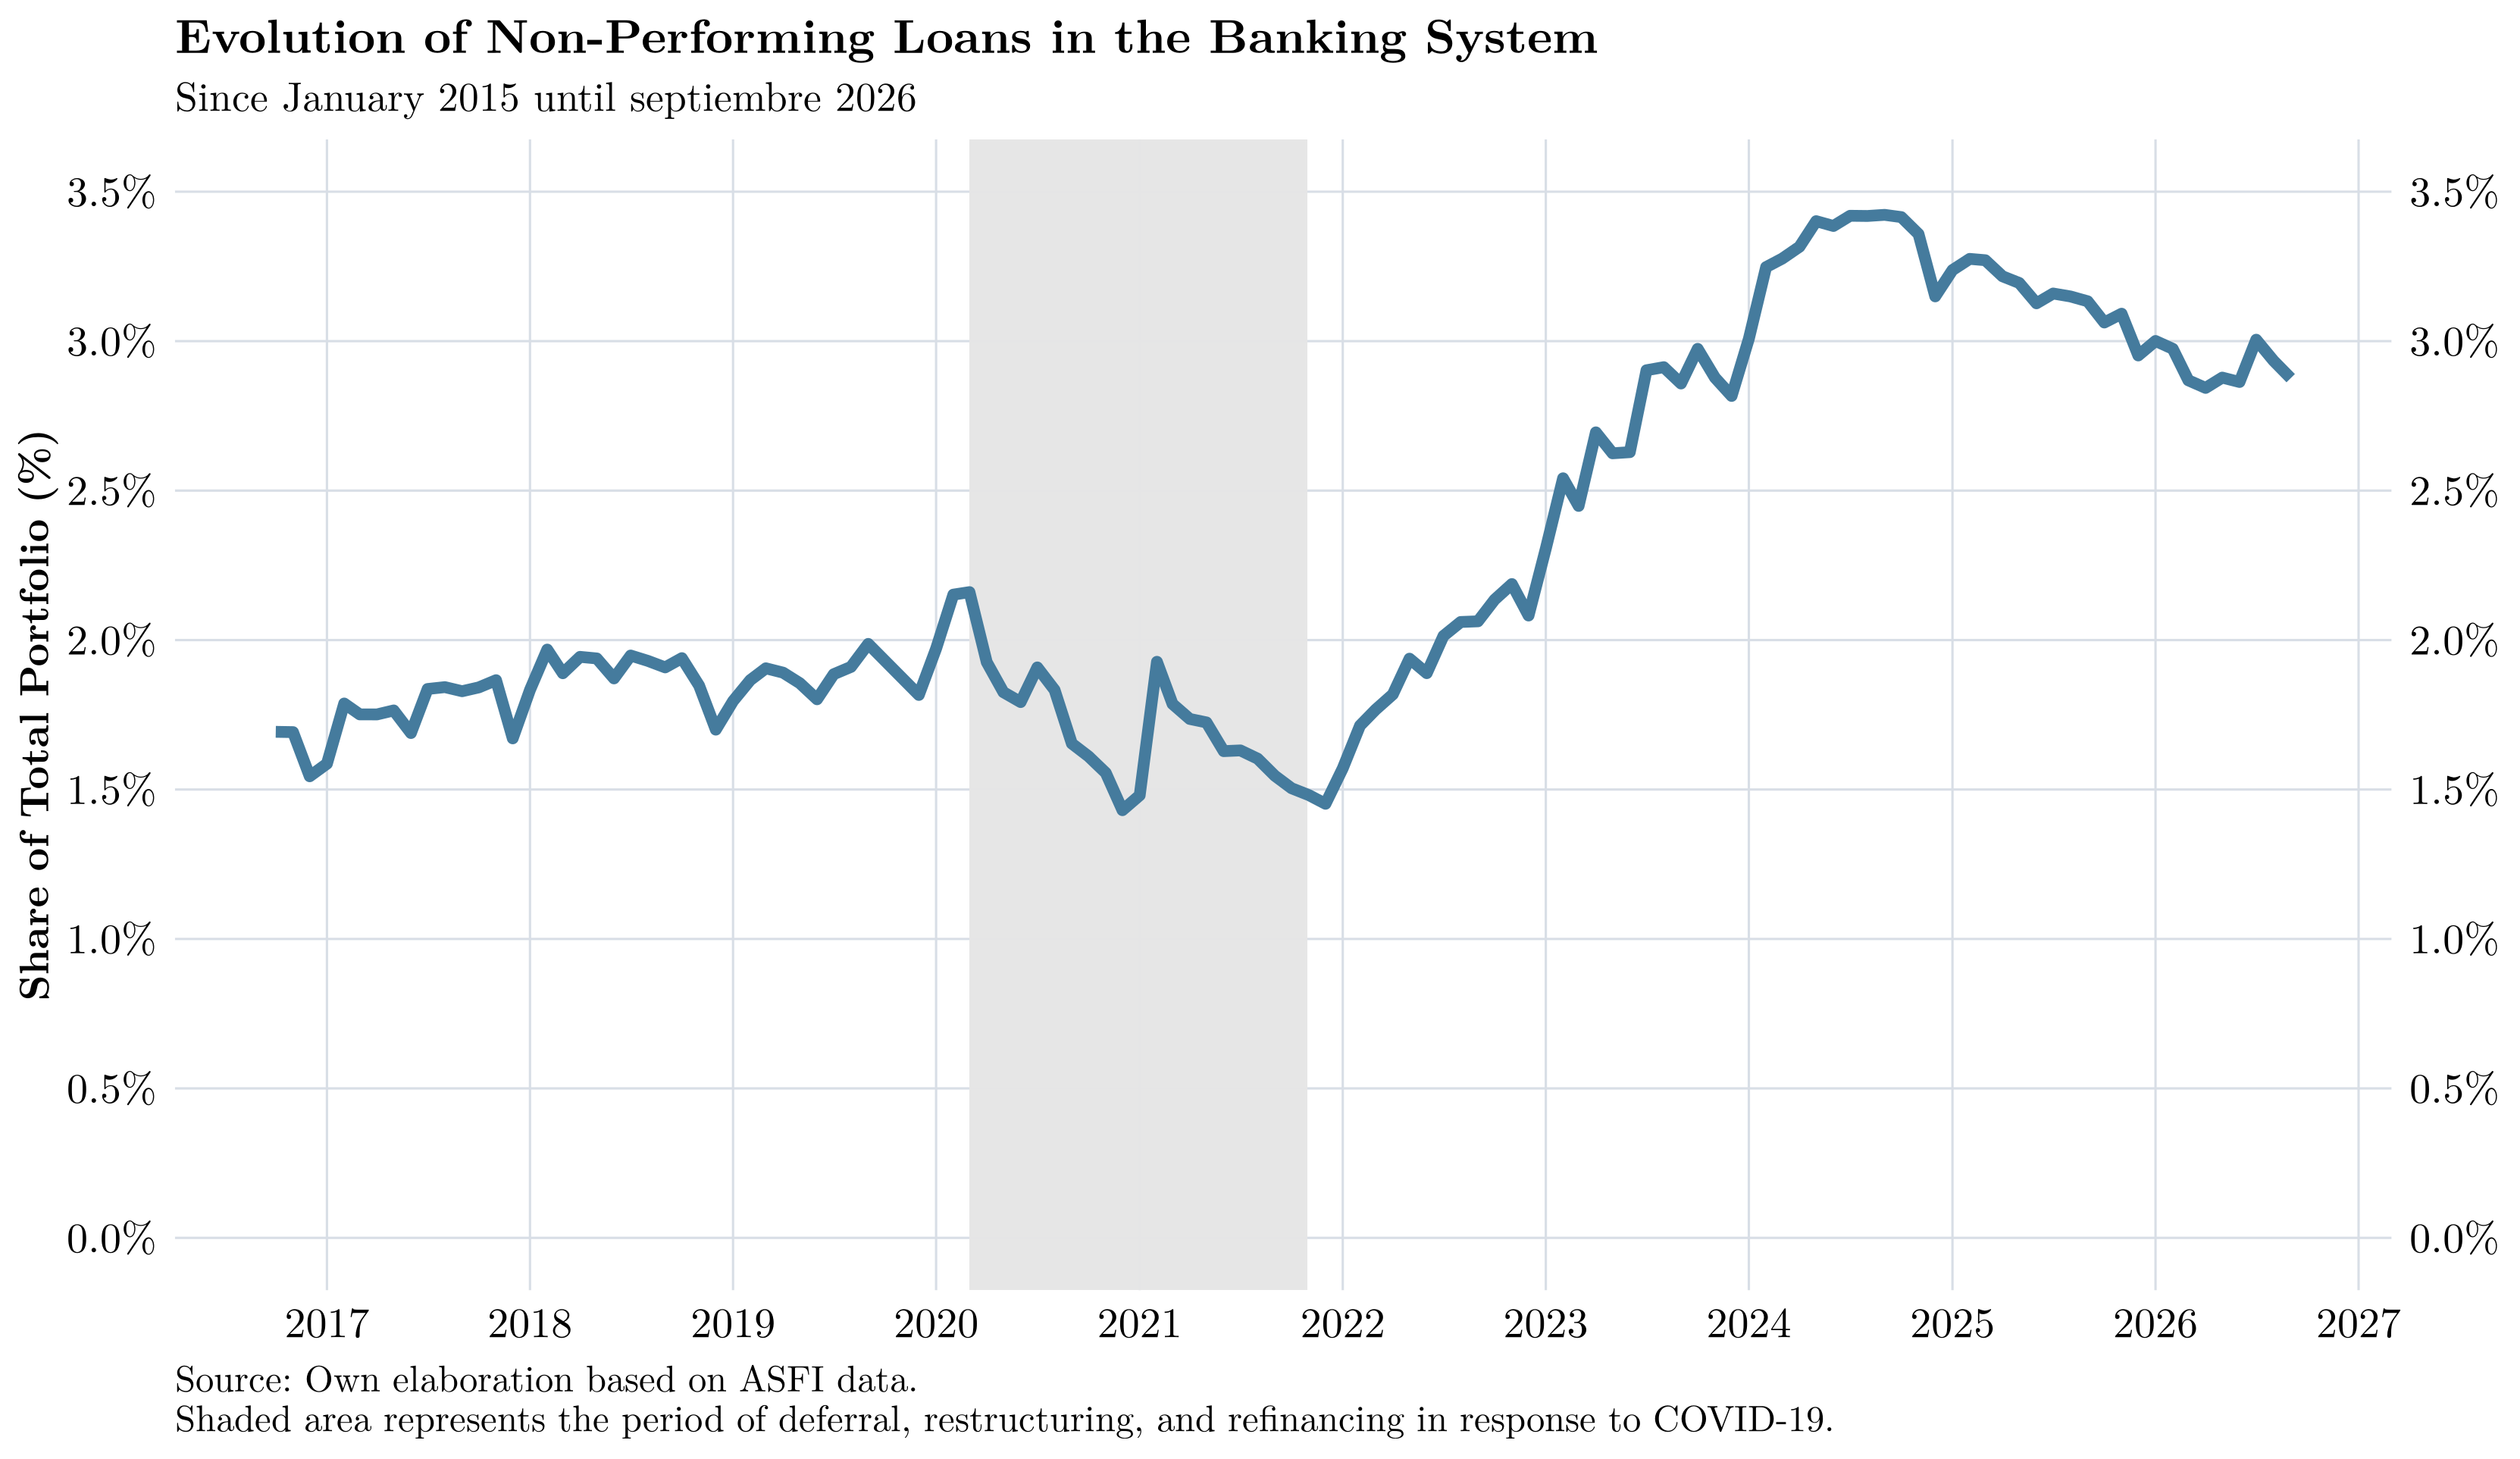
What is striking, however, is that the NPL ratio began to decline in the final quarter of 2024, even as lending—and the economy more broadly—lost momentum. Several explanations may lie behind this pattern. Financial institutions may be taking a more cautious approach to granting loans, or customers may be prioritizing the repayment of their financial obligations. It is also possible that some non-performing loans are being rescheduled and therefore no longer recorded as non-performing but instead classified as performing rescheduled loans.
Finally, separating non-performing loans arising from the rescheduled portfolio from those originating elsewhere shows that most non-performing loans belong to the first category. In other words, rescheduled loans are generating the greatest problems for financial institutions:
By institution:
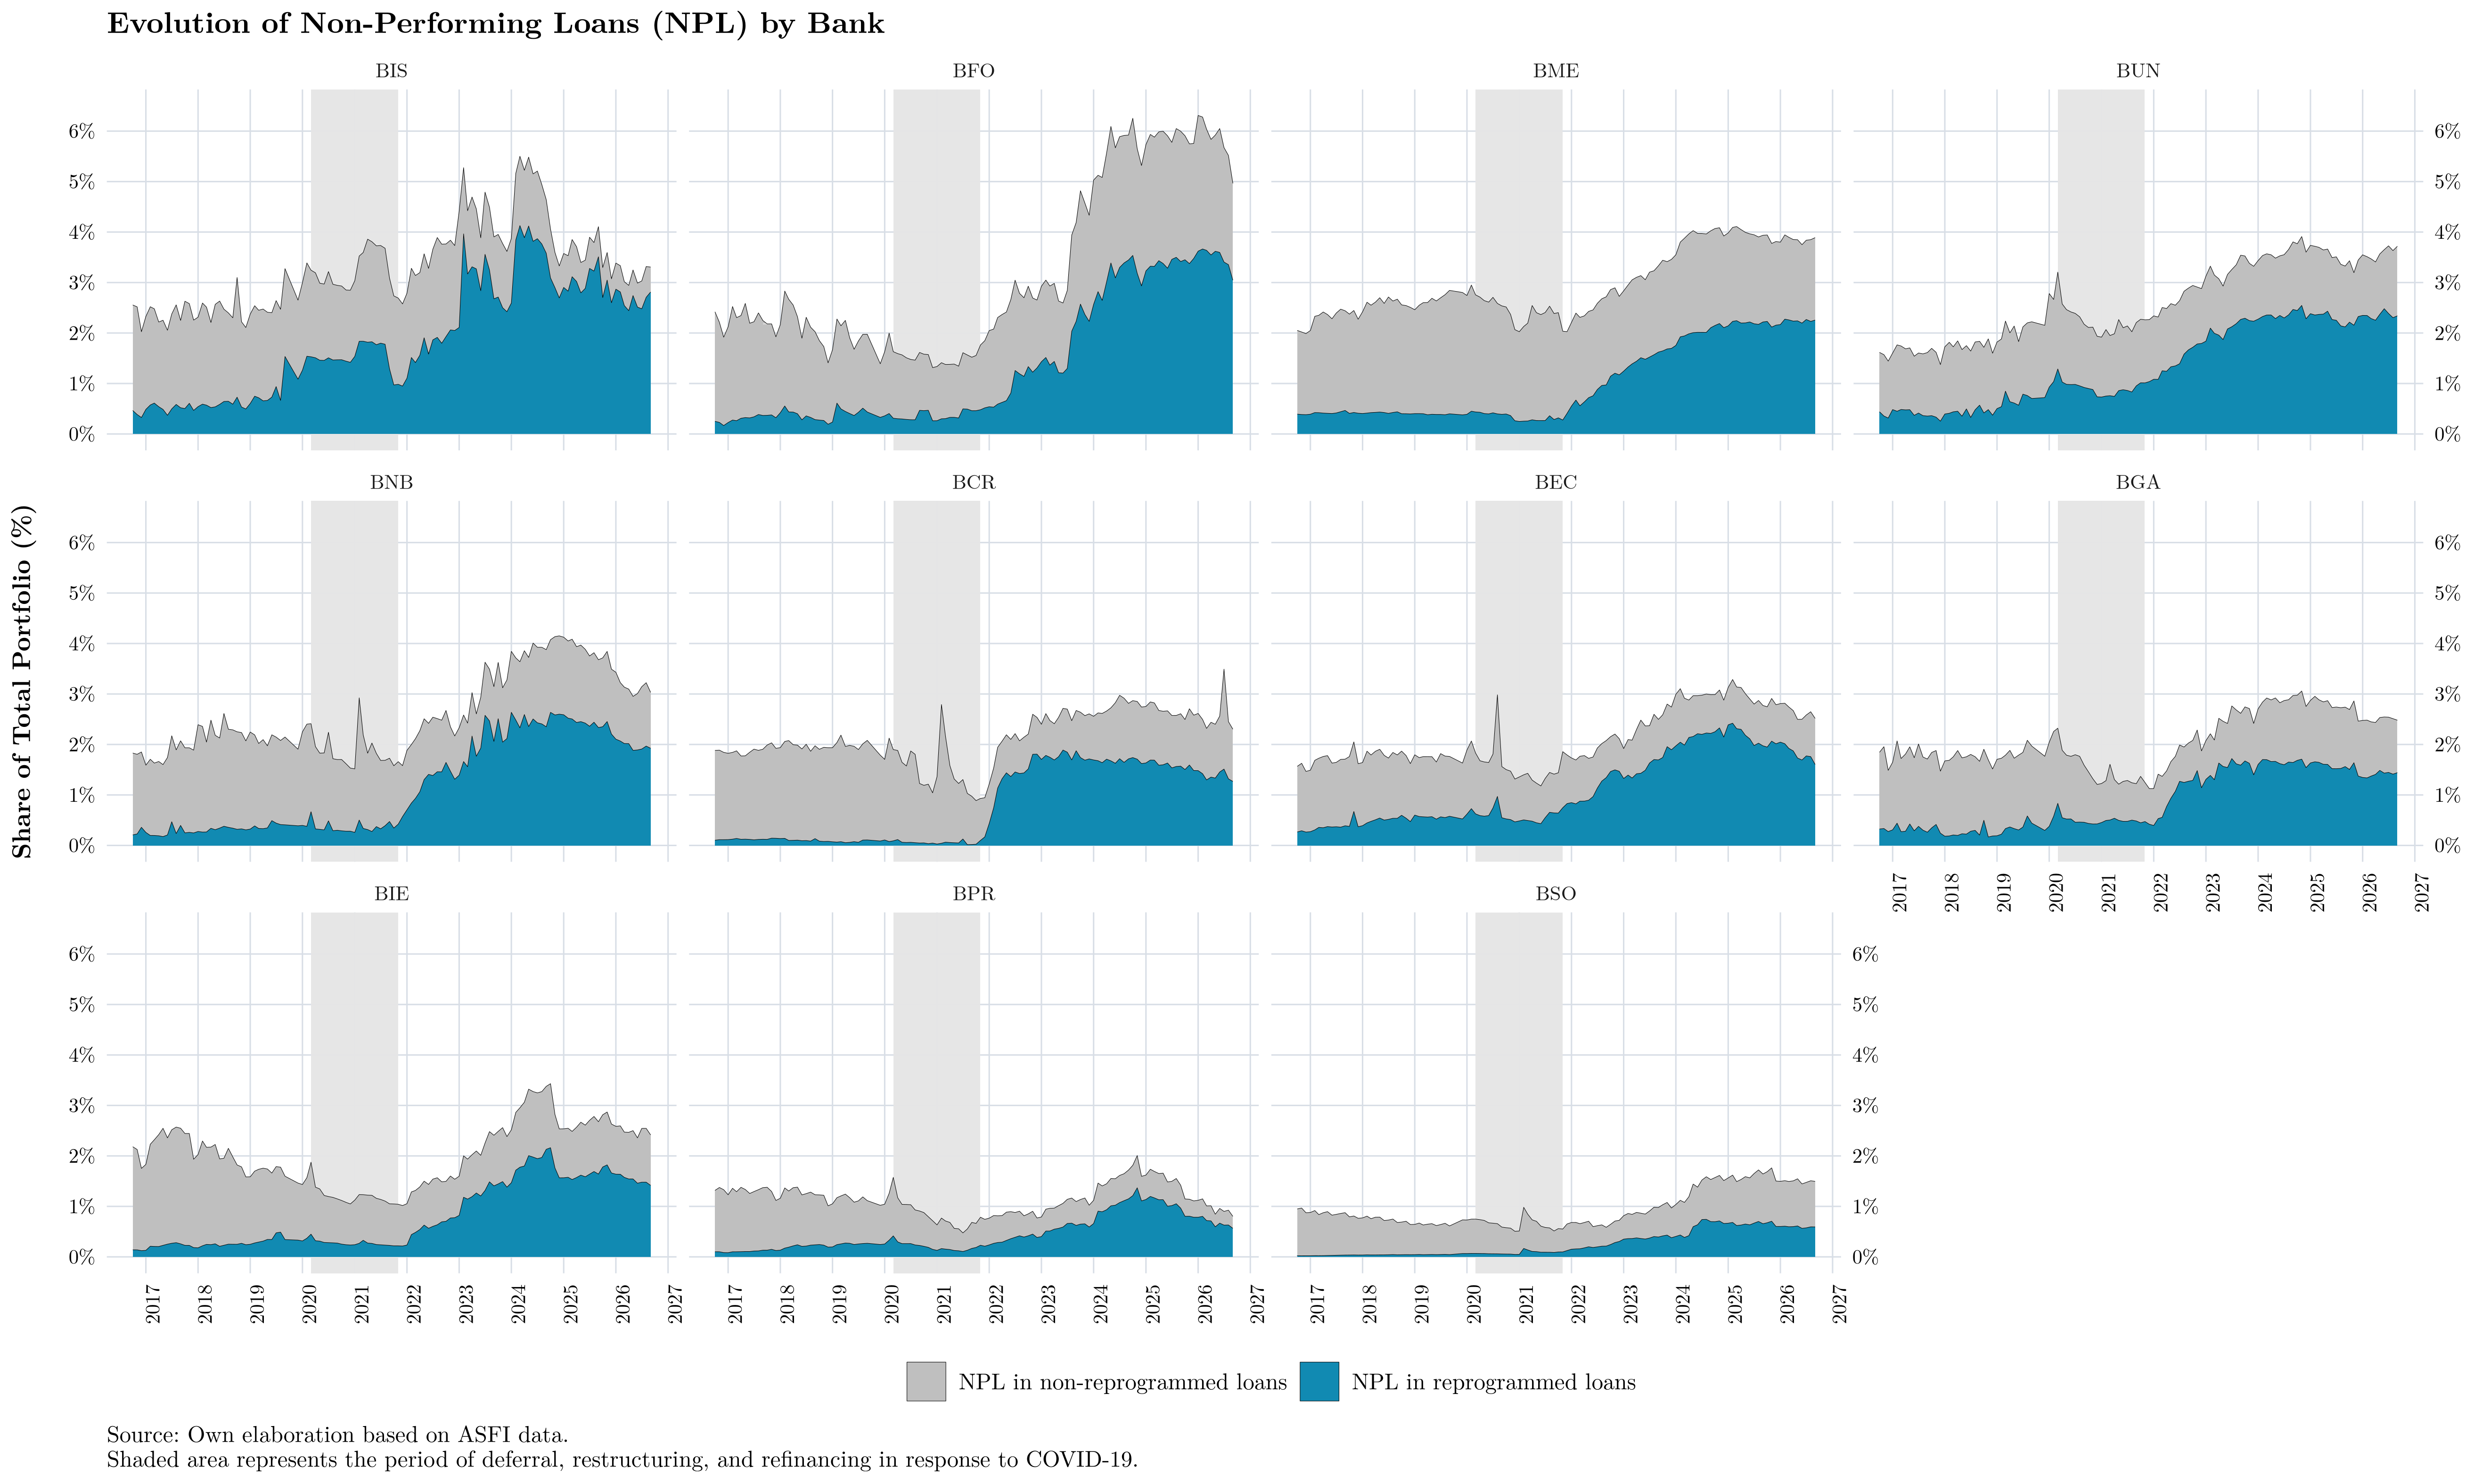
One noteworthy feature of the chart above is that, at some institutions—such as Banco Bisa, Banco Económico, and Banco Prodem—almost all non-performing loans are classified as rescheduled.
This is striking because, before the pandemic, the situation was precisely the opposite: when customers failed to repay their loans, they were classified as delinquent without first going through a rescheduling process. Now, however, either newly disbursed loans are not creating problems for financial institutions—which would be unusual given the economic context—or banks are systematically rescheduling loans, which could become problematic if the rescheduled portfolio is not sustainable over time. We will return to this issue below.
We can also examine the NPL ratio by type of credit, making it possible to identify problems among particular segments of banking-system borrowers:
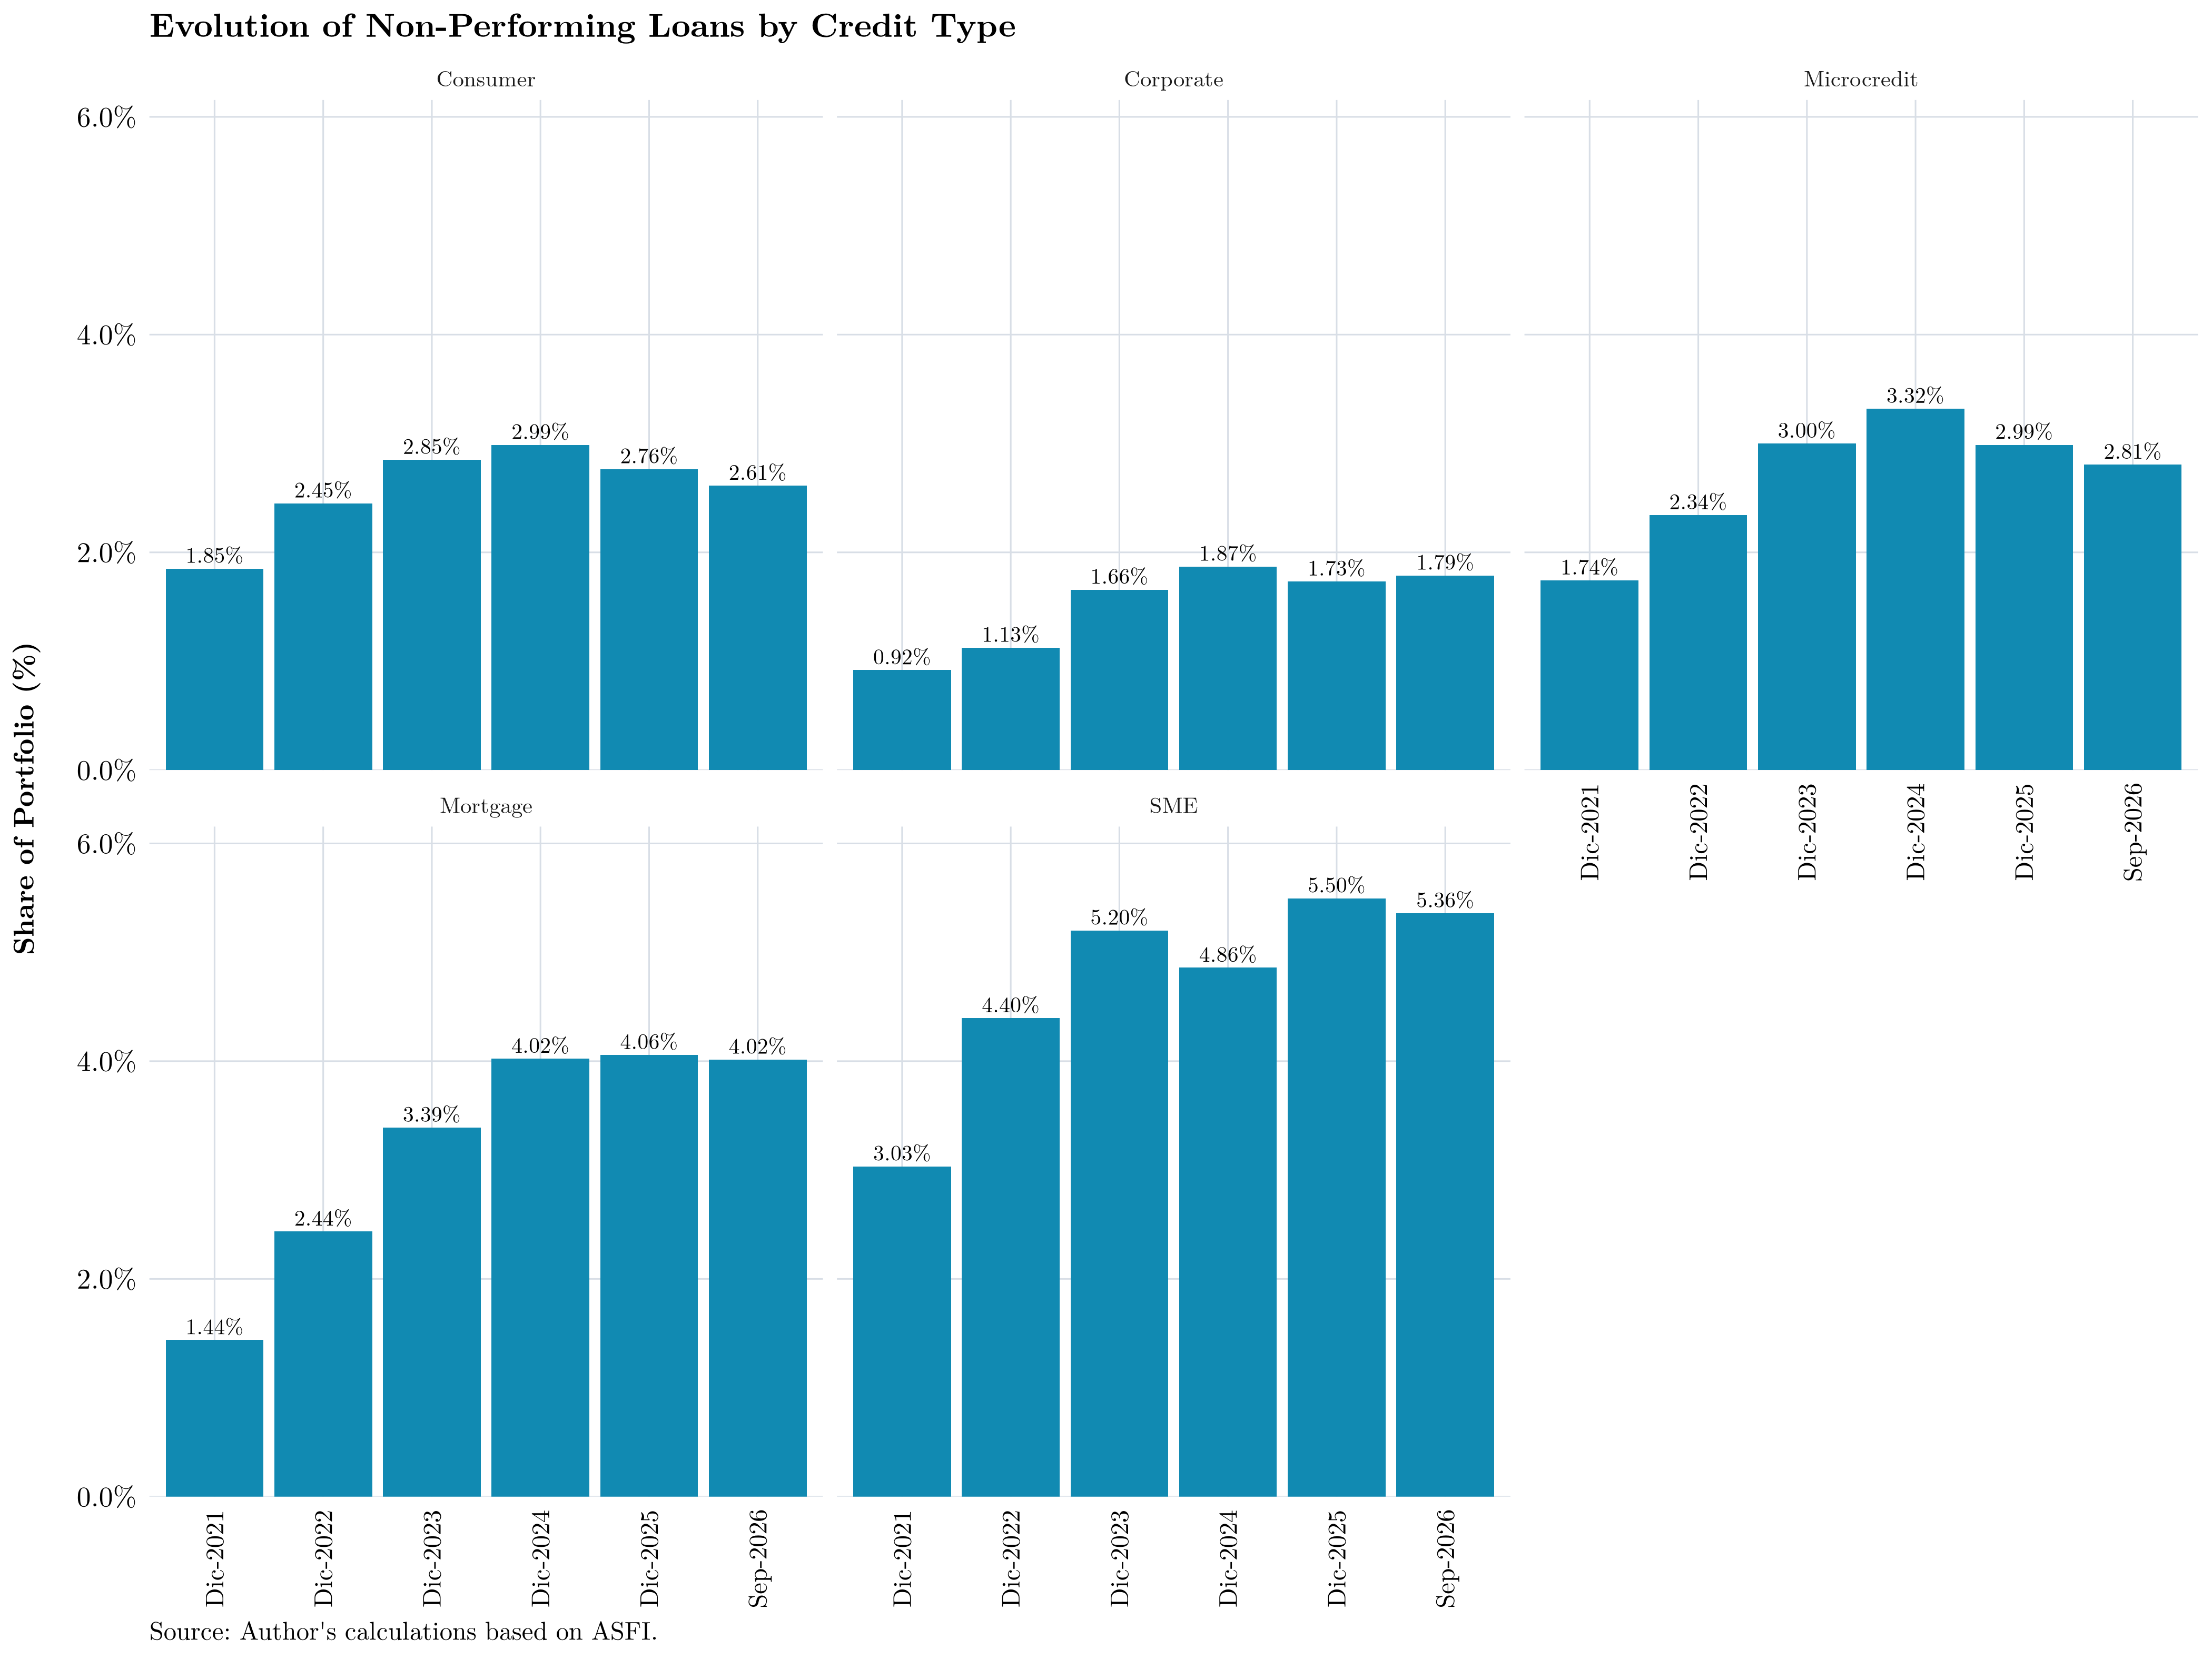
Note that, with the exception of large-corporate lending, the NPL ratio has increased significantly across the different loan categories, particularly mortgages and SME lending.
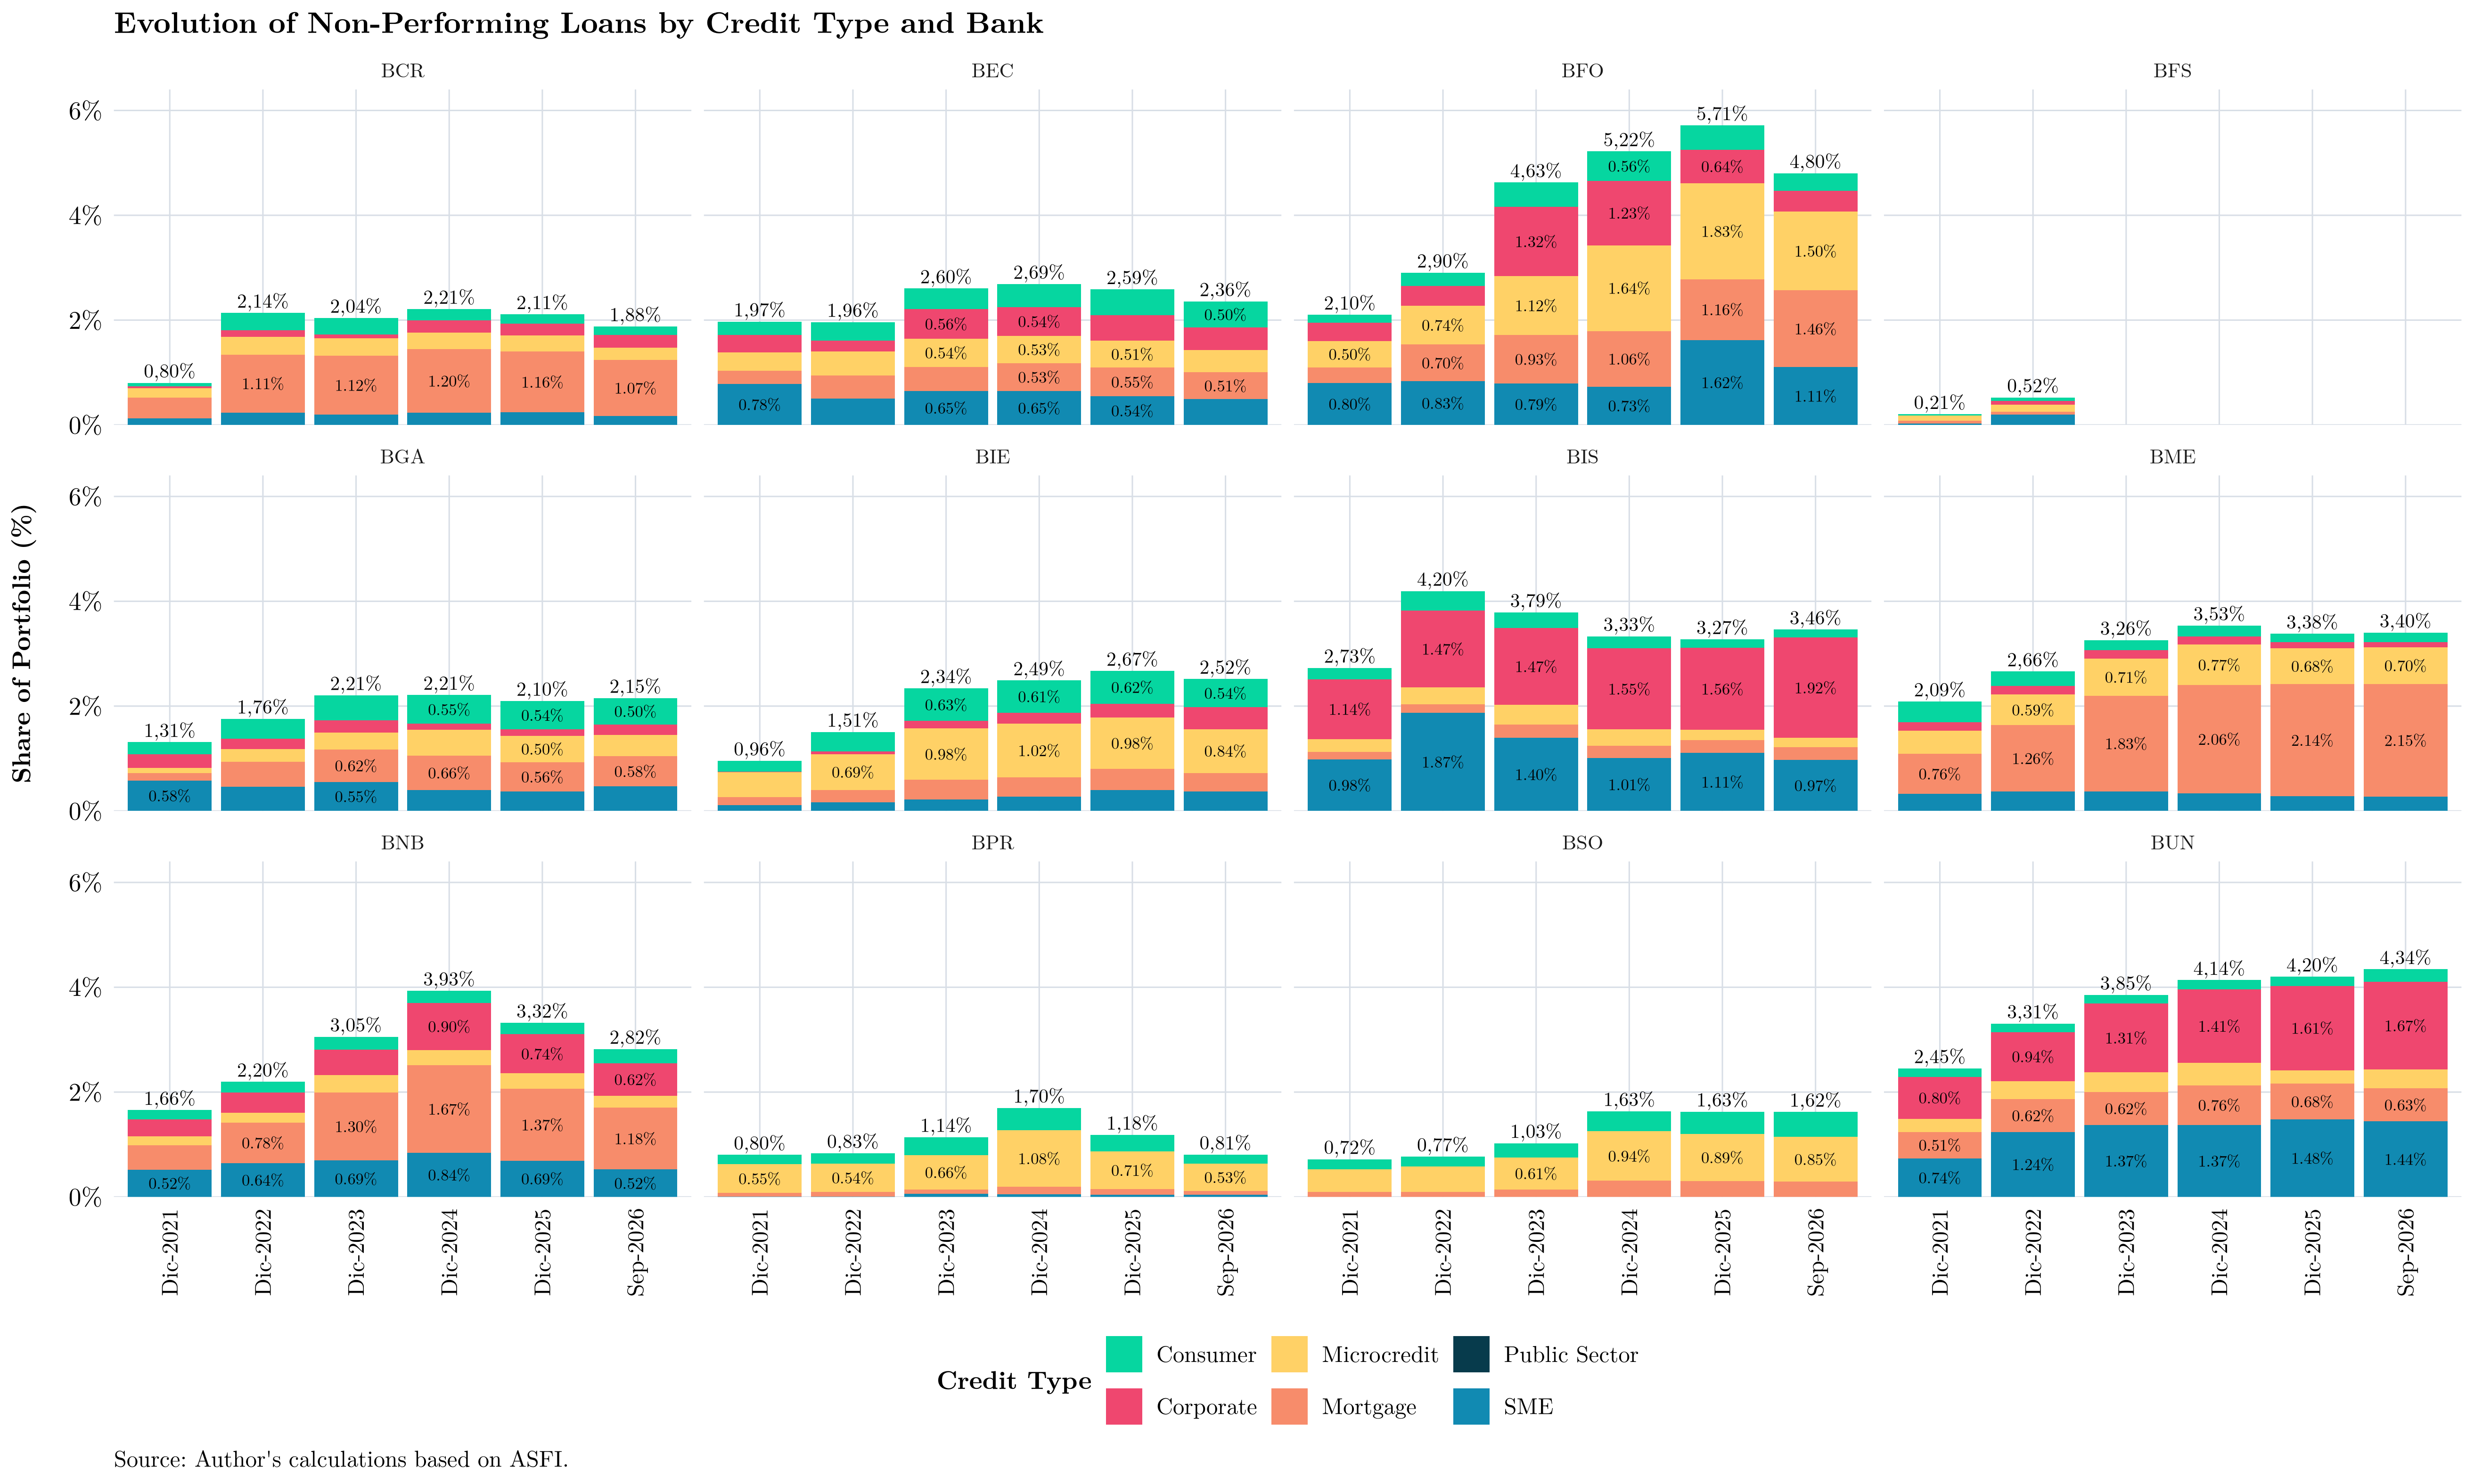
The NPL ratio can also be examined by institution and credit category:
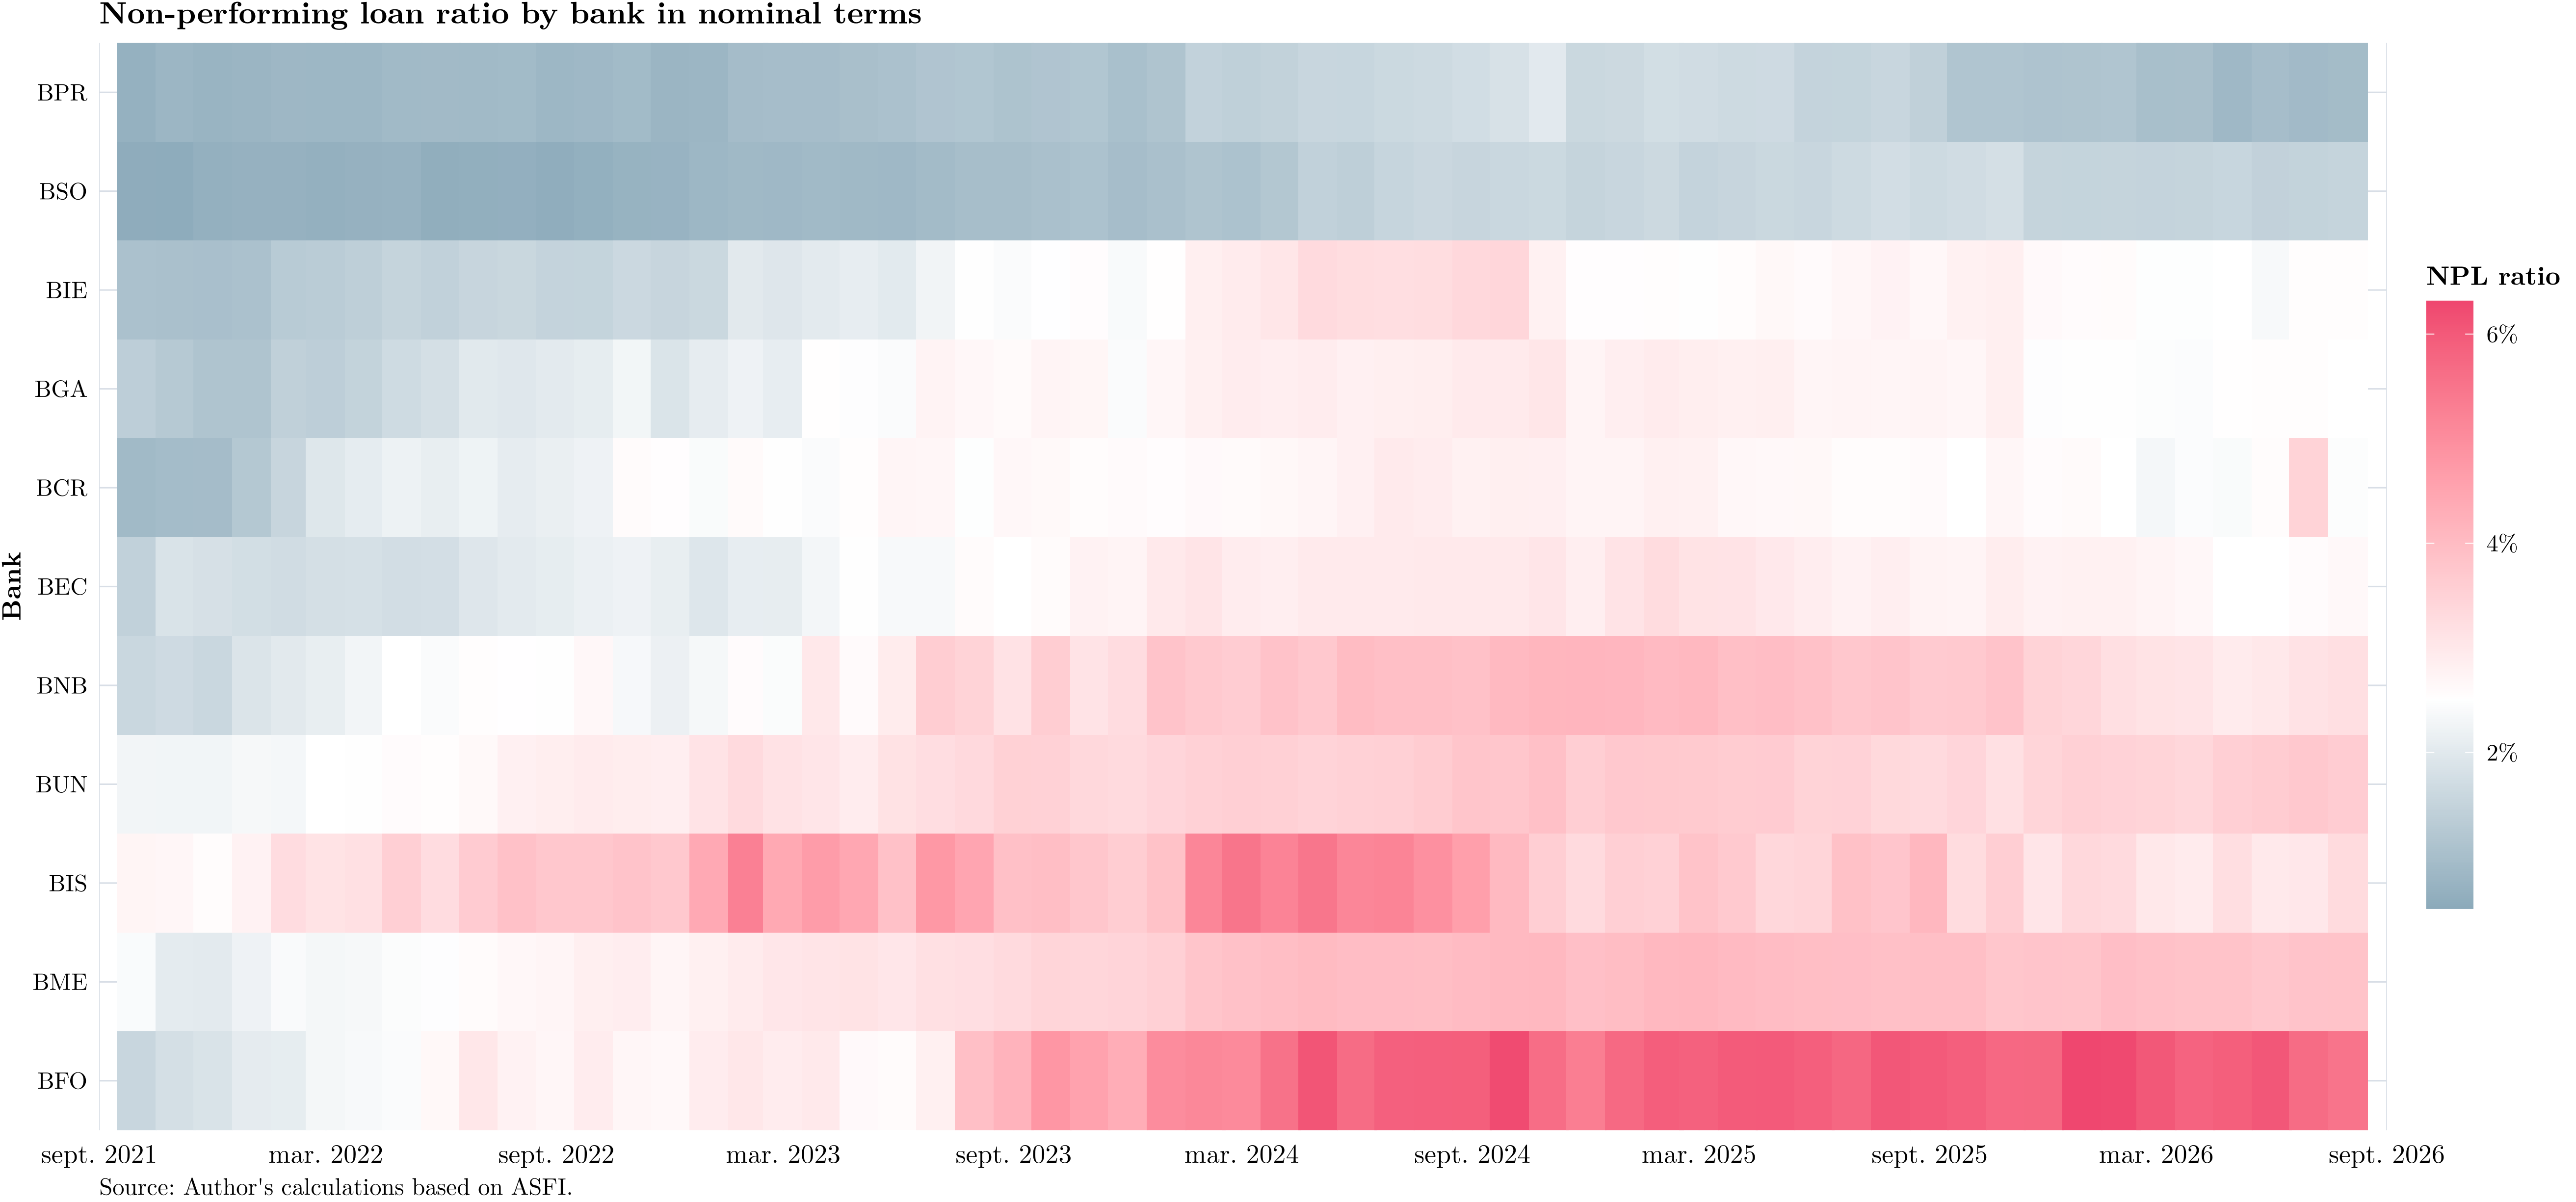
Finally, a heat map showing the evolution of the NPL ratio by institution makes it possible to identify banks with credit-quality problems at a glance:
Rescheduled Loan Portfolio
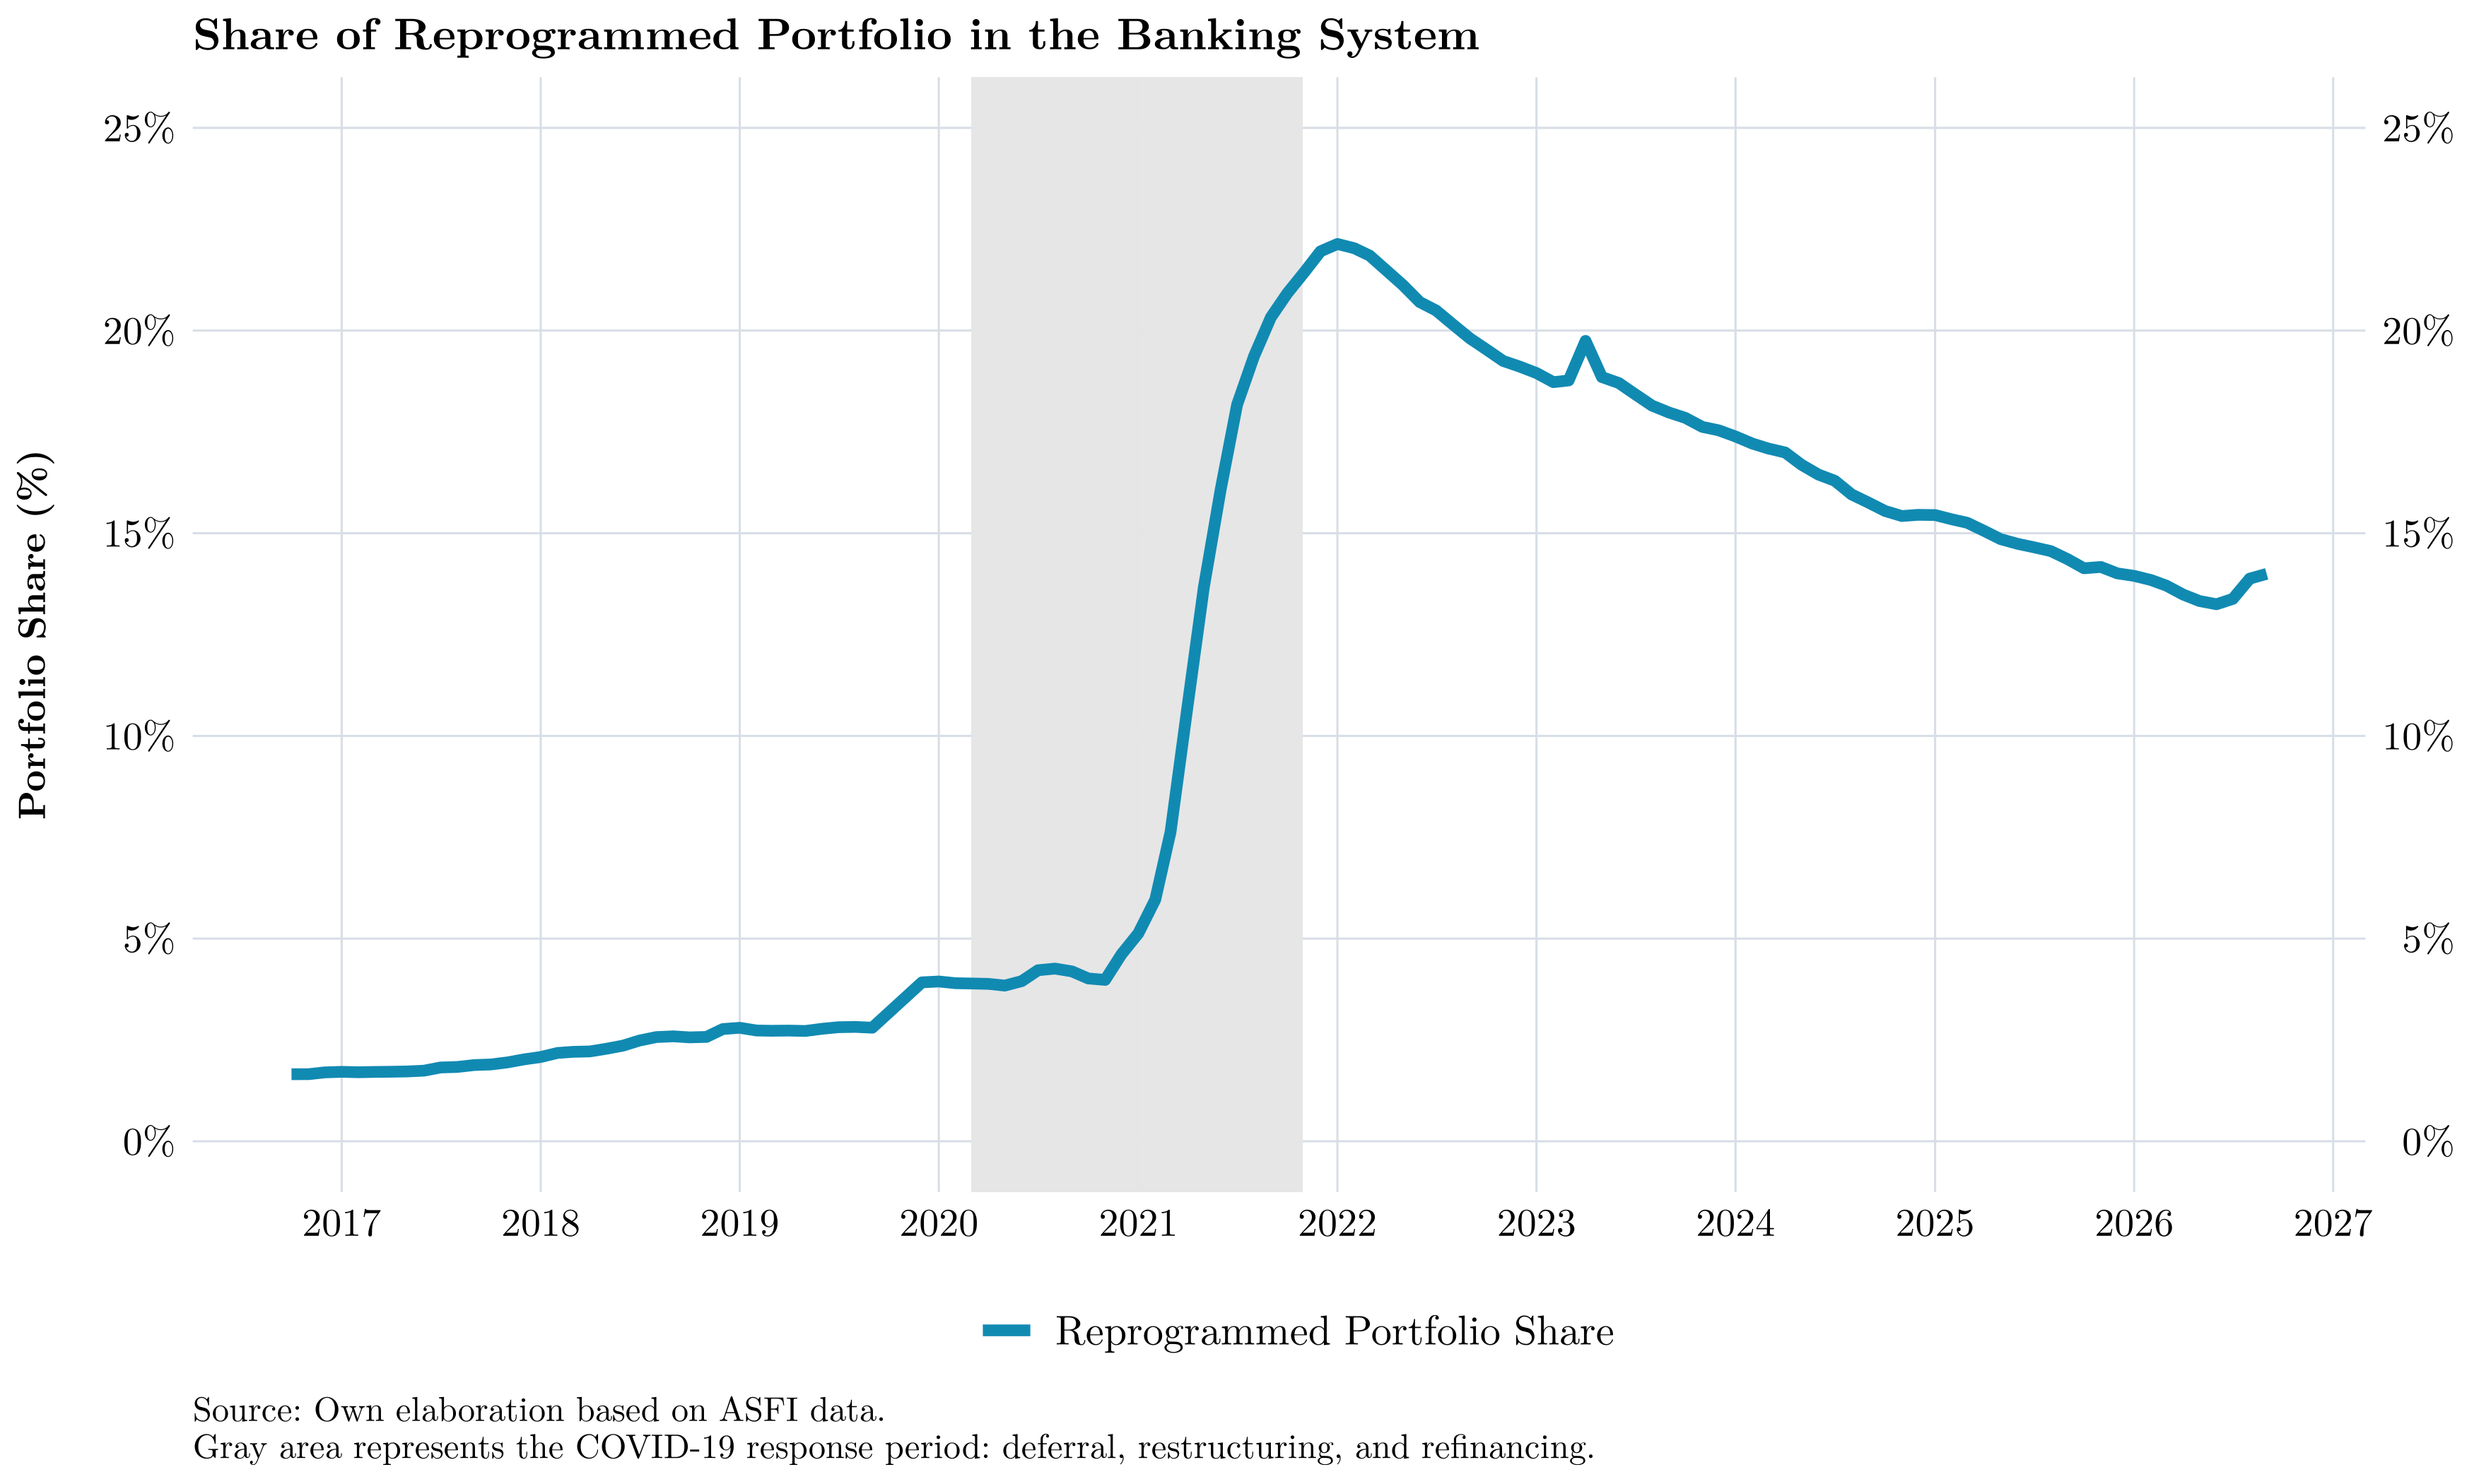
Rescheduled loans, which are more likely to fall into default, continue to account for around 15% of the total loan portfolio. Although some institutions have sought to reduce this exposure, others have maintained their loan-rescheduling policies. Thus, the argument I made last year remains valid:
“… In previous years, a loan would be rescheduled when the borrower indicated that, for some reason—perhaps temporary—they would be unable to meet their repayment obligations. On a case-by-case basis, institutions decided whether to modify the original repayment schedule by reducing interest rates, extending maturities, or lowering installments to prevent the loan from deteriorating over time. However, the fact that a customer cannot repay today makes it riskier to assume that they will be able to repay in the future.”
First, the rescheduled loan portfolio had been declining in recent months as some loans matured and the overall loan portfolio continued to grow. In the latest months, however, it has started to increase again, potentially indicating that businesses are once more facing difficulties meeting their repayment obligations.
The issue with rescheduled loans is that they are more likely to become non-performing because borrowers have already shown signs of repayment difficulties. Accordingly, it is important to monitor not only troubled rescheduled loans but the entire rescheduled portfolio. The following chart shows rescheduled loans in millions of BOB, broken down by repayment status:
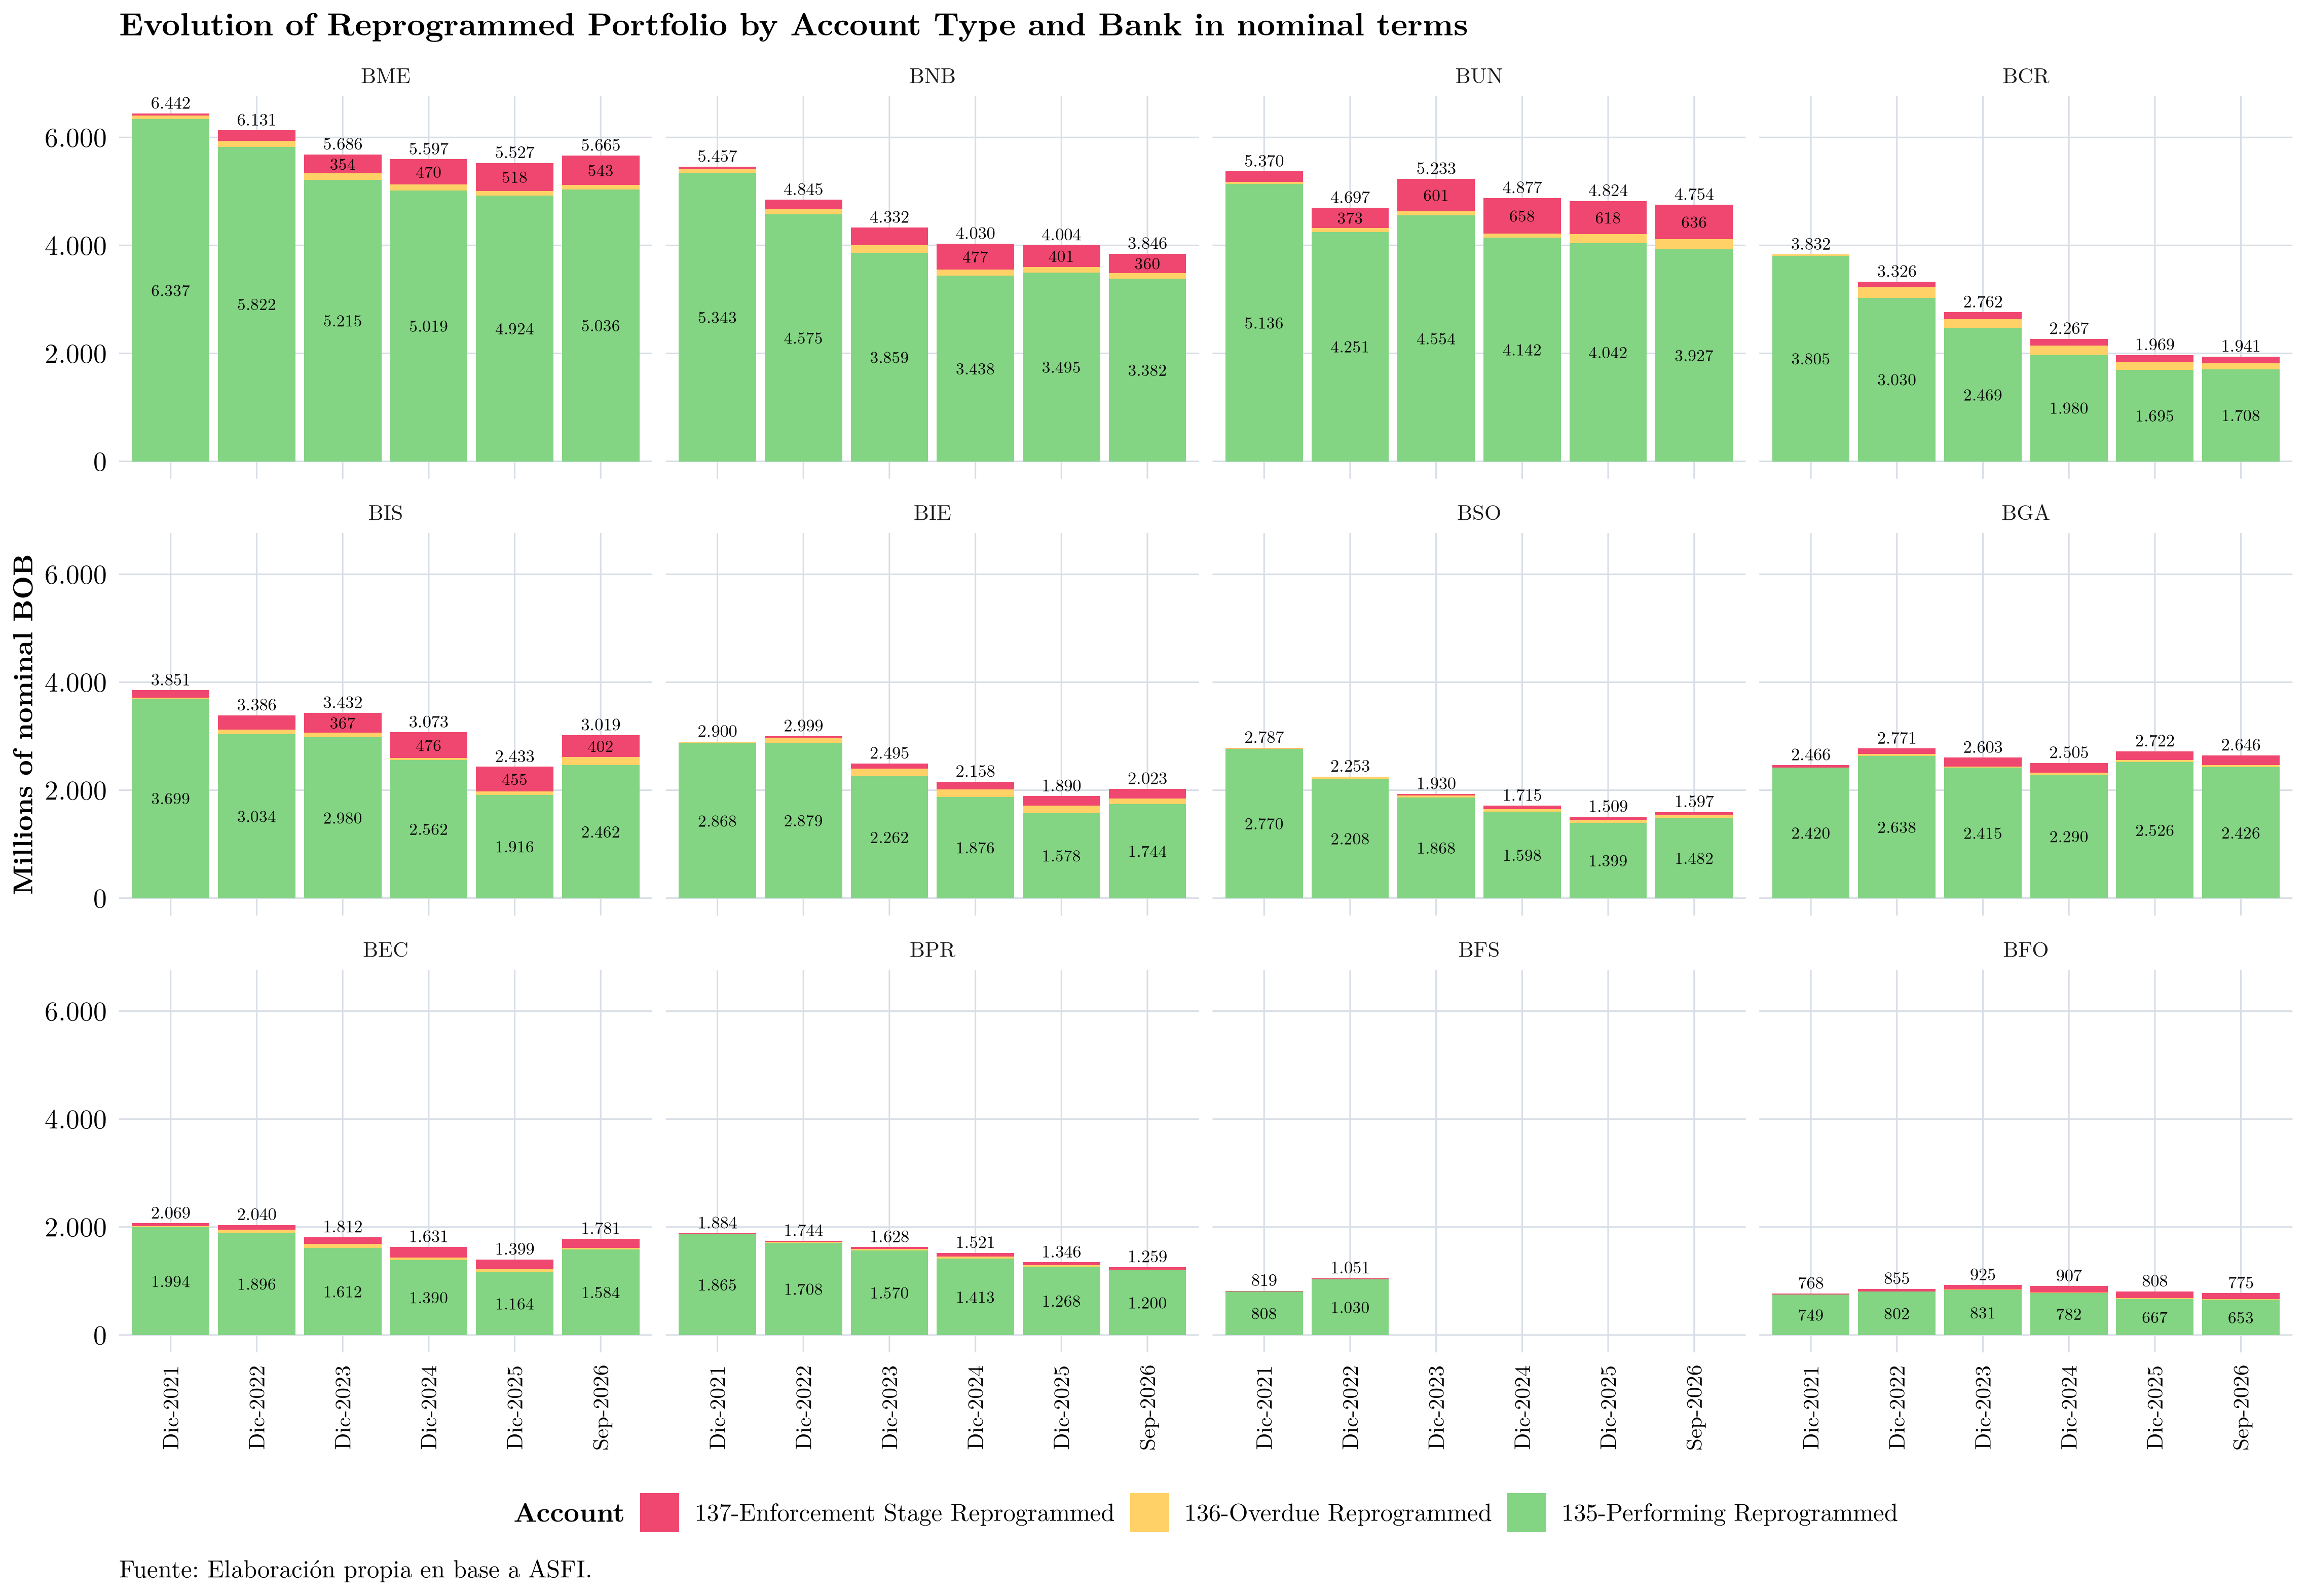
In this regard, the main concern lies with performing rescheduled loans, which may be the next to become non-performing and which continue to grow at some institutions.
Financial Results and Profitability
Financial results show the income and expenses recognized by institutions during the reporting period. This section uses net income from account CC0.07. As of September 2026, net income increased by BOB 390 million (13.2%) relative to the previous month, by BOB 1,311 million (64.4%) relative to the previous quarter, and by BOB 1,318 million (65.0%) relative to the same month of the previous year.
Finally, the following figure presents the Bolivian banking system’s financial results as of September 2026 for the three most recent comparable years:

Conclusions
1. Expansion with a more liquid asset mix: The balance sheet continues to expand in nominal terms, driven mainly by cash and cash equivalents and short-term investments, while the loan portfolio is growing at a more moderate pace. This reflects a preference for liquid assets or assets with shorter times to realization.
2. Greater allocation of funds to the BCB and the public sector: Investments with the BCB and in public-sector instruments have become more important components of assets. This concentration may improve returns on surplus liquidity, but it also reduces the system’s flexibility if these resources cannot be quickly converted into cash and cash equivalents.
3. Shift toward more volatile funding instruments: Current and savings accounts are growing more dynamically than term deposits. Although this structure can support day-to-day liquidity, it increases exposure to sudden withdrawals and makes it more difficult to match funding maturities with those of the loan portfolio.
4. Slowing loan growth, with differences across segments: Aggregate loan growth is losing momentum, although corporate and consumer loan portfolios have shown more recent signs of recovery.
5. Declining NPLs, but still above post-pandemic levels: The NPL ratio currently stands at 2.88% and is trending downward; nevertheless, it is almost twice the level recorded after the pandemic. The rescheduled loan portfolio remains a significant source of credit risk and continues to put pressure on future profitability.