Are Bolivian Banks Solvent? An Introduction to the Problem of Capital Adequacy
Introduction
I have gone a few months without writing or publishing my quarterly report on the Bolivian banking system, although I hope to return to it later with the usual level of detail. Still, I did not want to miss the opportunity to contribute to a discussion that, in the current context, is particularly important: the solvency of banks in Bolivia.
The question can be stated quite simply: do Bolivian banks have enough capital to absorb significant losses? Or, put differently, do they have an adequate capital buffer to face a deterioration in the economic environment without compromising the stability of the financial system?
The answer, however, is not so simple. Bank solvency cannot be assessed solely by looking at whether an institution is profitable, whether its loan portfolio continues to grow, or whether its assets exceed its liabilities in accounting terms. In banking, what matters is not only how much an institution has, but also how much risk it has taken to generate those assets and what capacity it has to absorb losses if that risk materializes.
For that reason, this post does not aim to provide a definitive answer. Rather, it seeks to organize the problem. Before looking at the data for Bolivian banks, it is useful to review how capital adequacy is measured, what the logic behind capital requirements is, and why international prudential regulation — particularly the Basel framework — is useful for interpreting these indicators.
Prudential Regulation and Capital Adequacy
Banking activity consists, to a large extent, of transforming maturities, risks, and liquidity. Banks receive deposits from the public and other short- or medium-term funding, and turn them into loans, investments, and other financial assets. This function is essential for economic growth, but it also creates vulnerabilities.
A bank may face losses due to borrower default, deterioration in the value of collateral, changes in interest rates, liquidity problems, or macroeconomic shocks. In normal times, these losses may appear manageable. The problem emerges when economic conditions deteriorate and losses exceed expectations.
This is where prudential regulation comes in. Its purpose is to ensure that the risks banks assume — mainly using the public’s money — are reasonably measured, managed, and backed by sufficient capital.
The most important international reference in this area is the Basel Committee on Banking Supervision. This Committee is not a global regulator in the strict sense, nor are its standards applied automatically in every country. Rather, it functions as an international forum of supervisory authorities and central banks that develops common prudential criteria. Each jurisdiction then adopts these criteria according to its own legal framework and institutional reality. The collection of these criteria is known as the Basel Framework.
The central idea of the Basel Framework is simple: banks must hold capital in proportion to the risks they assume. This logic has evolved from Basel I, which introduced an initial measurement of risk-weighted assets, to Basel II and Basel III, which made risk measurement more sophisticated, strengthened the quality of capital, and introduced additional capital buffers.
From Expected Loss to Unexpected Loss
The starting point, however, is to distinguish between expected losses and unexpected losses. The expected loss is the loss that the bank anticipates as a normal part of its business. In a loan portfolio, there will always be borrowers who do not repay. That loss should be incorporated into the price of credit, into provisions — or previsiones, as they are called in Bolivia — and into ordinary risk management.
Expected loss is usually represented as:
$$ EL = PD \times LGD \times EAD $$
where $PD$ is the probability of default, $LGD$ is the loss given default, and $EAD$ is the exposure at default.
However, prudential concern does not end with expected loss. What matters for solvency is what happens when losses are greater than expected. That is, when non-performing loans increase, collateral loses value, the economy slows down, or several risks materialize at the same time.
These unexpected losses are what justify the existence of regulatory capital. Thus, provisions cover expected losses, while capital must absorb unexpected losses. The figure below illustrates these concepts, starting from a “loss distribution”.
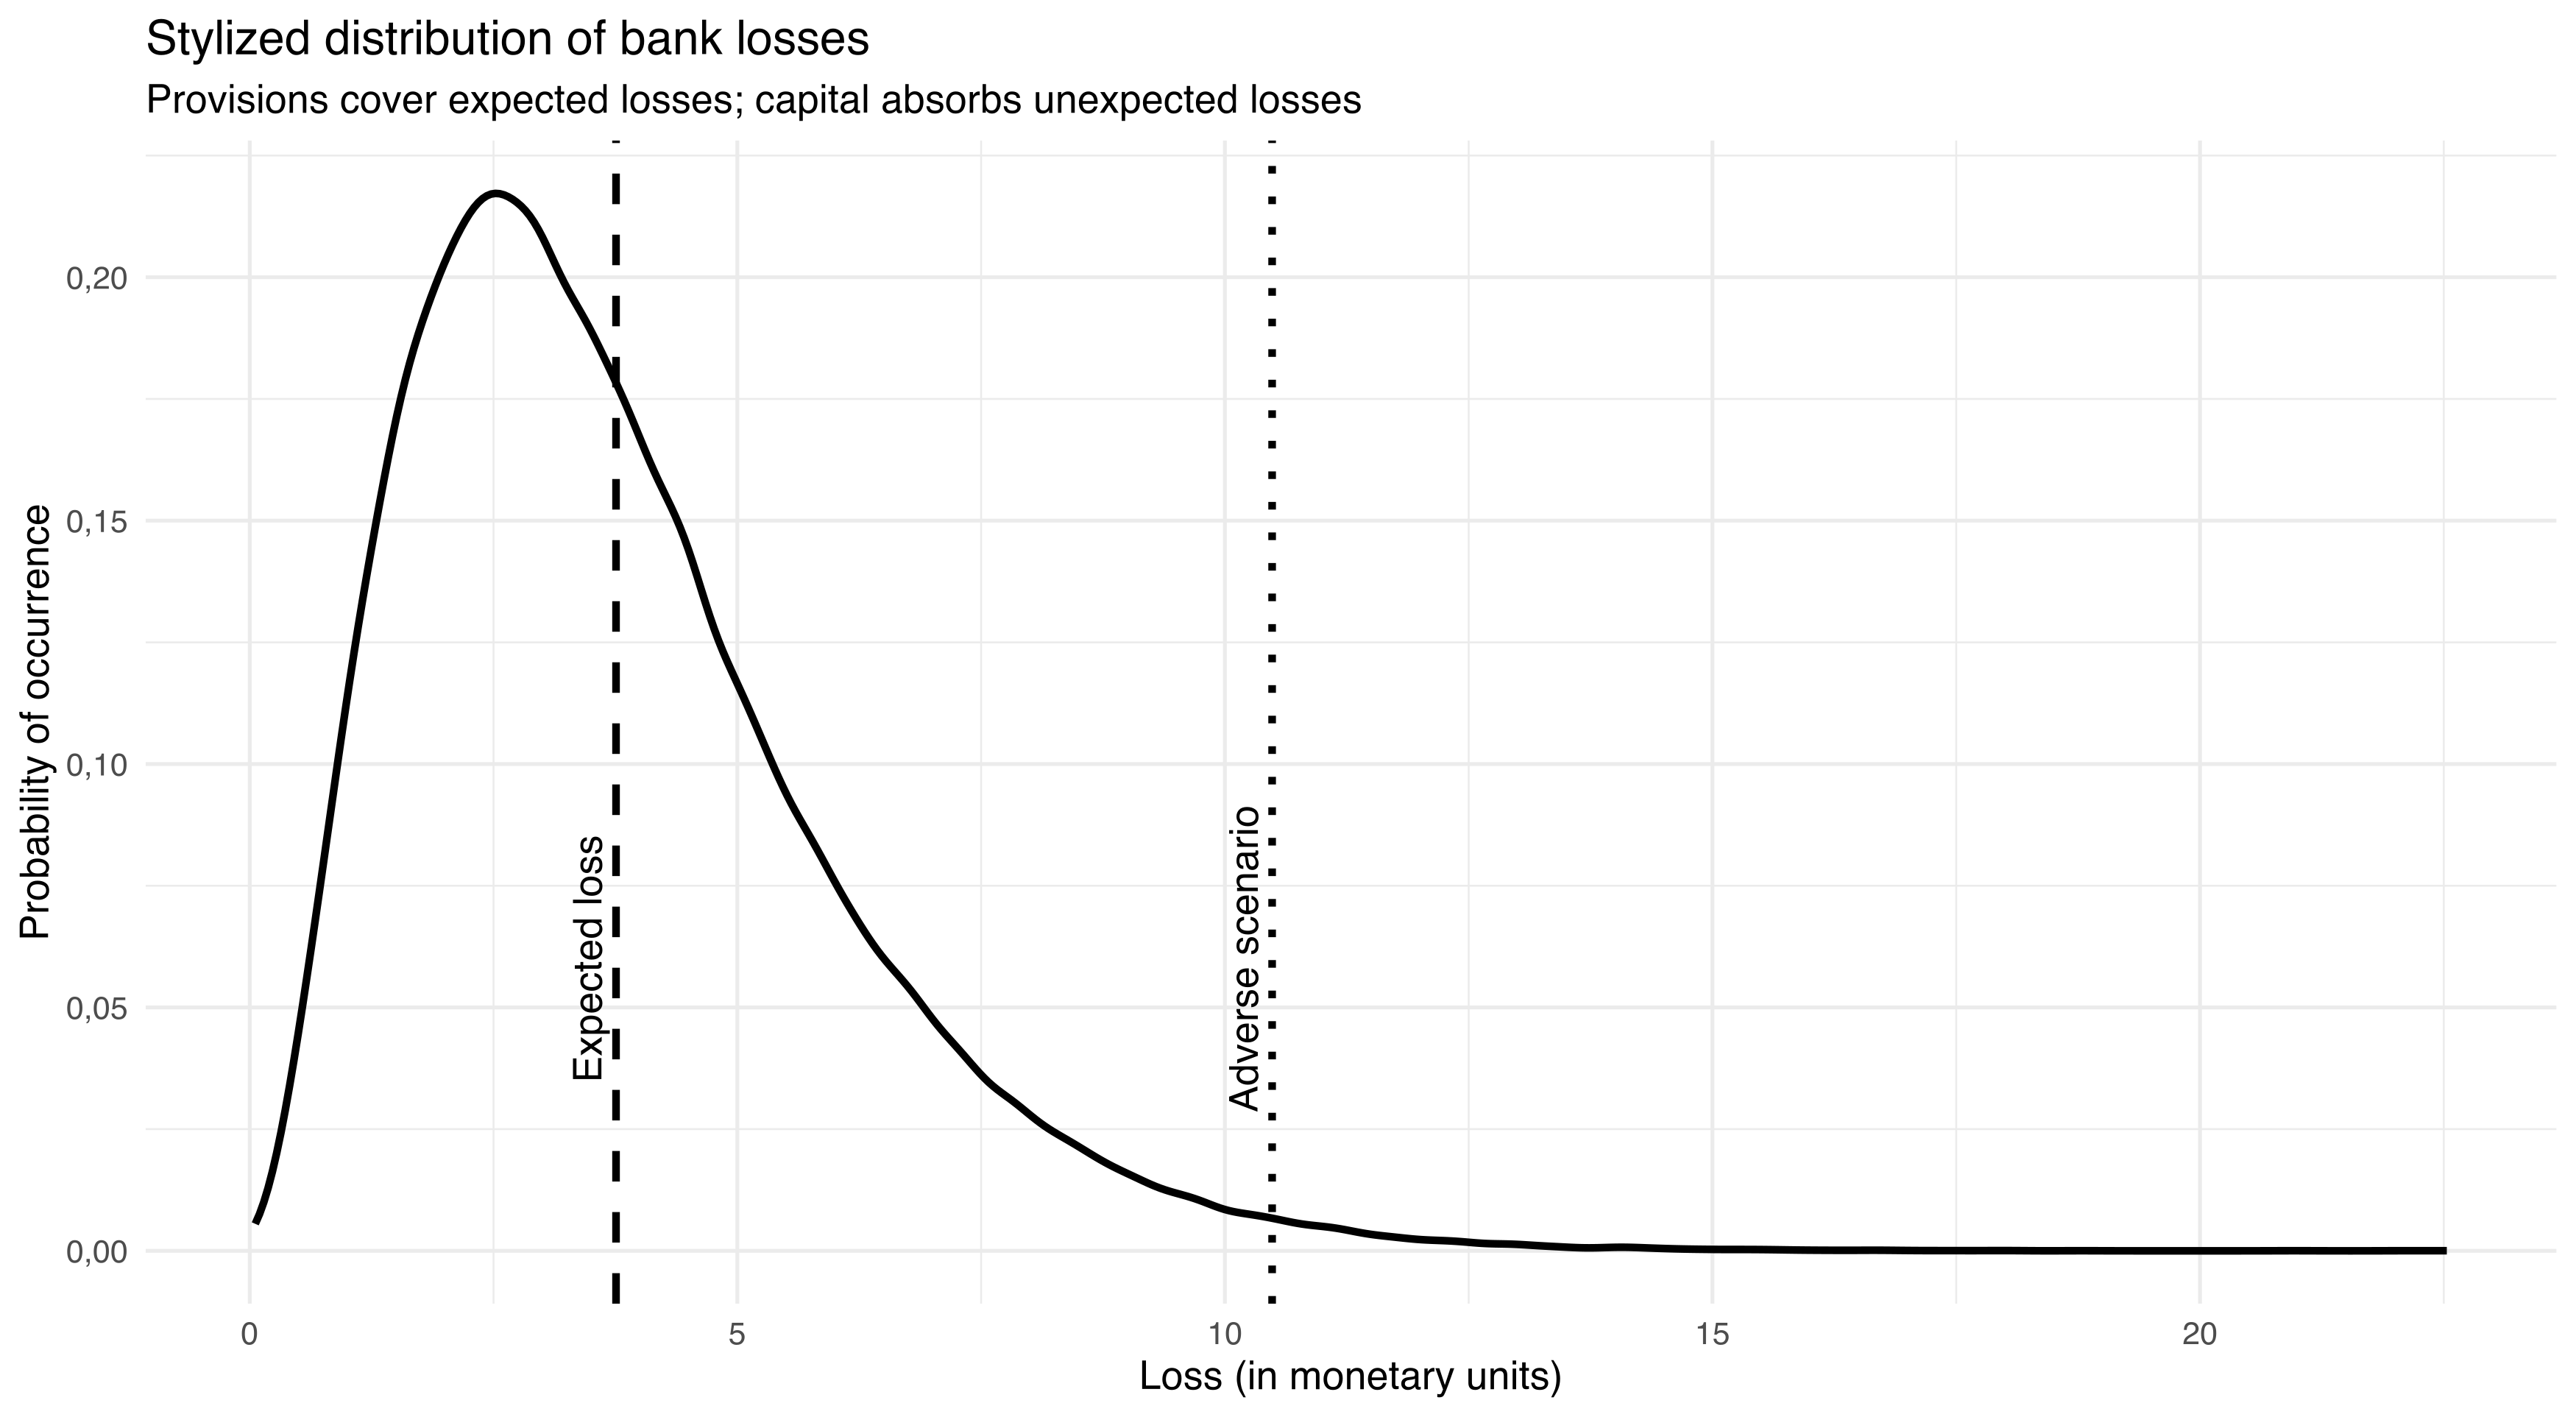
This representation is useful because it shows that solvency is not assessed at the center of the distribution, but in the tail. A bank may operate normally for several years and still not have enough capital to absorb a severe deterioration. Therefore, the prudential question is not only whether the bank makes money in normal times, but whether it can withstand conditions that are no longer normal.
The Capital Ratio: A Simple Measure for a Complex Question
Once the general logic of capital adequacy is understood, it is useful to focus on the indicator that usually summarizes this discussion: the capital ratio. In Bolivia, this idea is approximated by the Capital Adequacy Ratio (Coeficiente de Adecuación Patrimonial, CAP), which compares an institution’s regulatory capital with its computable or risk-weighted assets.
The general formula is:
$$ \text{Capital ratio} =\frac{\text{Regulatory own funds}}{\text{Risk-weighted assets}} $$
It should be noted that international regulation imposes a minimum of 8% for this ratio, in addition to conditioning its composition.
At first glance, this is a simple relationship. The numerator contains the capital available to absorb losses. The denominator contains the bank’s assets adjusted for their level of risk. Behind this formula, however, lies an important idea: it is not enough to know how much capital a bank has in absolute terms; what matters is how much capital it has relative to the risk it is taking.
The Numerator: Regulatory Own Funds
The numerator of the ratio is composed of regulatory own funds. In Basel terminology, these funds are usually divided into three broad categories: Common Equity Tier 1 (CET1), Additional Tier 1 (AT1), and Tier 2 capital (T2). In international terminology, this can be expressed as:
$$ \text{Own funds} = \underbrace{CET1 + AT1}_{T1} + T2 $$
$CET1$ is the highest-quality capital. It mainly includes common shares, reserves, and retained earnings. It is the capital that can absorb losses most directly and permanently. This is why, in modern prudential regulation, what matters is not only how much capital a bank has, but how much of that capital is of high quality.
$AT1$ includes instruments that can also absorb losses while the bank continues operating, although under more specific conditions. $T2$, for its part, corresponds to instruments of relatively lower quality, such as certain subordinated debt, which can absorb losses mainly in resolution or liquidation scenarios.
This distinction is important because not all funding can be considered capital. For an instrument to be recognized as regulatory capital, it must be available to absorb losses before those losses affect depositors and ordinary creditors. The quality of capital matters as much as its quantity.
In the Bolivian case, the regulatory classification does not exactly replicate the $CET1$, $AT1$, and $T2$ categories used in Europe or in other regulatory frameworks. However, the economic logic is comparable. Capital adequacy reports distinguish between primary capital, secondary capital, adjustments, deductions, computable subordinated obligations, and regulatory capital. This information allows us to analyze not only the level of capital in the system, but also its composition.
The Denominator: Risk-Weighted Assets
The denominator of the ratio is risk-weighted assets, or RWA. This is one of the most important differences between a simple accounting analysis and a prudential analysis. Regulation does not require capital against total gross assets, but against a risk-adjusted measure.
The logic can be represented as follows:
$$ RWA = \sum_i E_i \times RW_i $$
where $RWA$ are risk-weighted assets, $E_i$ is the exposure of each asset, and $RW_i$ is the risk weight assigned by regulation.
This means that two banks with the same balance sheet size may have different capital needs. If one has a high proportion of liquid assets or low-risk exposures, its risk-weighted assets will be lower. If another has a higher concentration in consumer loans, corporate loans, or assets with higher regulatory risk, its risk-weighted assets will be higher.
A simple example helps illustrate the logic. Suppose a bank has four types of assets, each worth 100:
| Asset type | Exposure | Risk weight | Risk-weighted asset |
|---|---|---|---|
| Cash and equivalents | 100 | 0% | 0 |
| Low-risk assets | 100 | 20% | 20 |
| Mortgage loans | 100 | 50% | 50 |
| Corporate or consumer loans | 100 | 100% | 100 |
| Total | 400 | 170 |
Although the bank has 400 in accounting assets, its risk-weighted assets are 170. If the minimum capital requirement were 10%, the minimum required capital would be:
$$ \text{Required capital} = 10% \times 170 = 17 $$
If the bank had 25 in regulatory capital, its capital ratio would be:
$$ \text{Capital ratio} =\frac{25}{170}=14.7% $$
And its capital surplus relative to the minimum would be:
$$ \text{Capital surplus} = 25 - 17 = 8 $$
The example shows why the capital ratio must be interpreted carefully. A high ratio may be due to the bank having a lot of capital, but also to having a reduced denominator because of the composition of its assets. Similarly, a decline in the ratio may reflect a reduction in capital, an increase in risk-weighted assets, or both at the same time.
Finally, it is important not to lose sight of the fact that capital is calculated at the transaction level. Again, if the minimum capital ratio were 10%, the capital consumption per transaction would be:
| Asset type | Exposure | Risk weight | Risk-weighted asset | Required capital per transaction |
|---|---|---|---|---|
| Cash and equivalents | 100 | 0% | 0 | 0 |
| Low-risk assets | 100 | 20% | 20 | 2 |
| Mortgage loans | 100 | 50% | 50 | 5 |
| Corporate or consumer loans | 100 | 100% | 100 | 10 |
In the case of a mortgage loan, for every Bs. 100 granted, shareholders would have to provide Bs. 5 of regulatory capital to comply with the minimum. Since providing this capital has an opportunity cost for shareholders, that cost will necessarily be transmitted to the price of credit, namely its interest rate. Thus, operations that regulation classifies as riskier also imply a higher cost in terms of capital.
From Theory to the Bolivian Case
The information published by ASFI allows us to observe the logic of capital adequacy in practice. For each institution, the data report assets by risk category, total assets and contingents, computable assets, regulatory capital, the minimum requirement, and the capital surplus or deficit. This allows us to move from the general CAP formula to a more precise reading of its components.
The first chart shows the evolution of the Capital Adequacy Ratio for the system and for each bank. The horizontal line represents the 10% regulatory minimum:
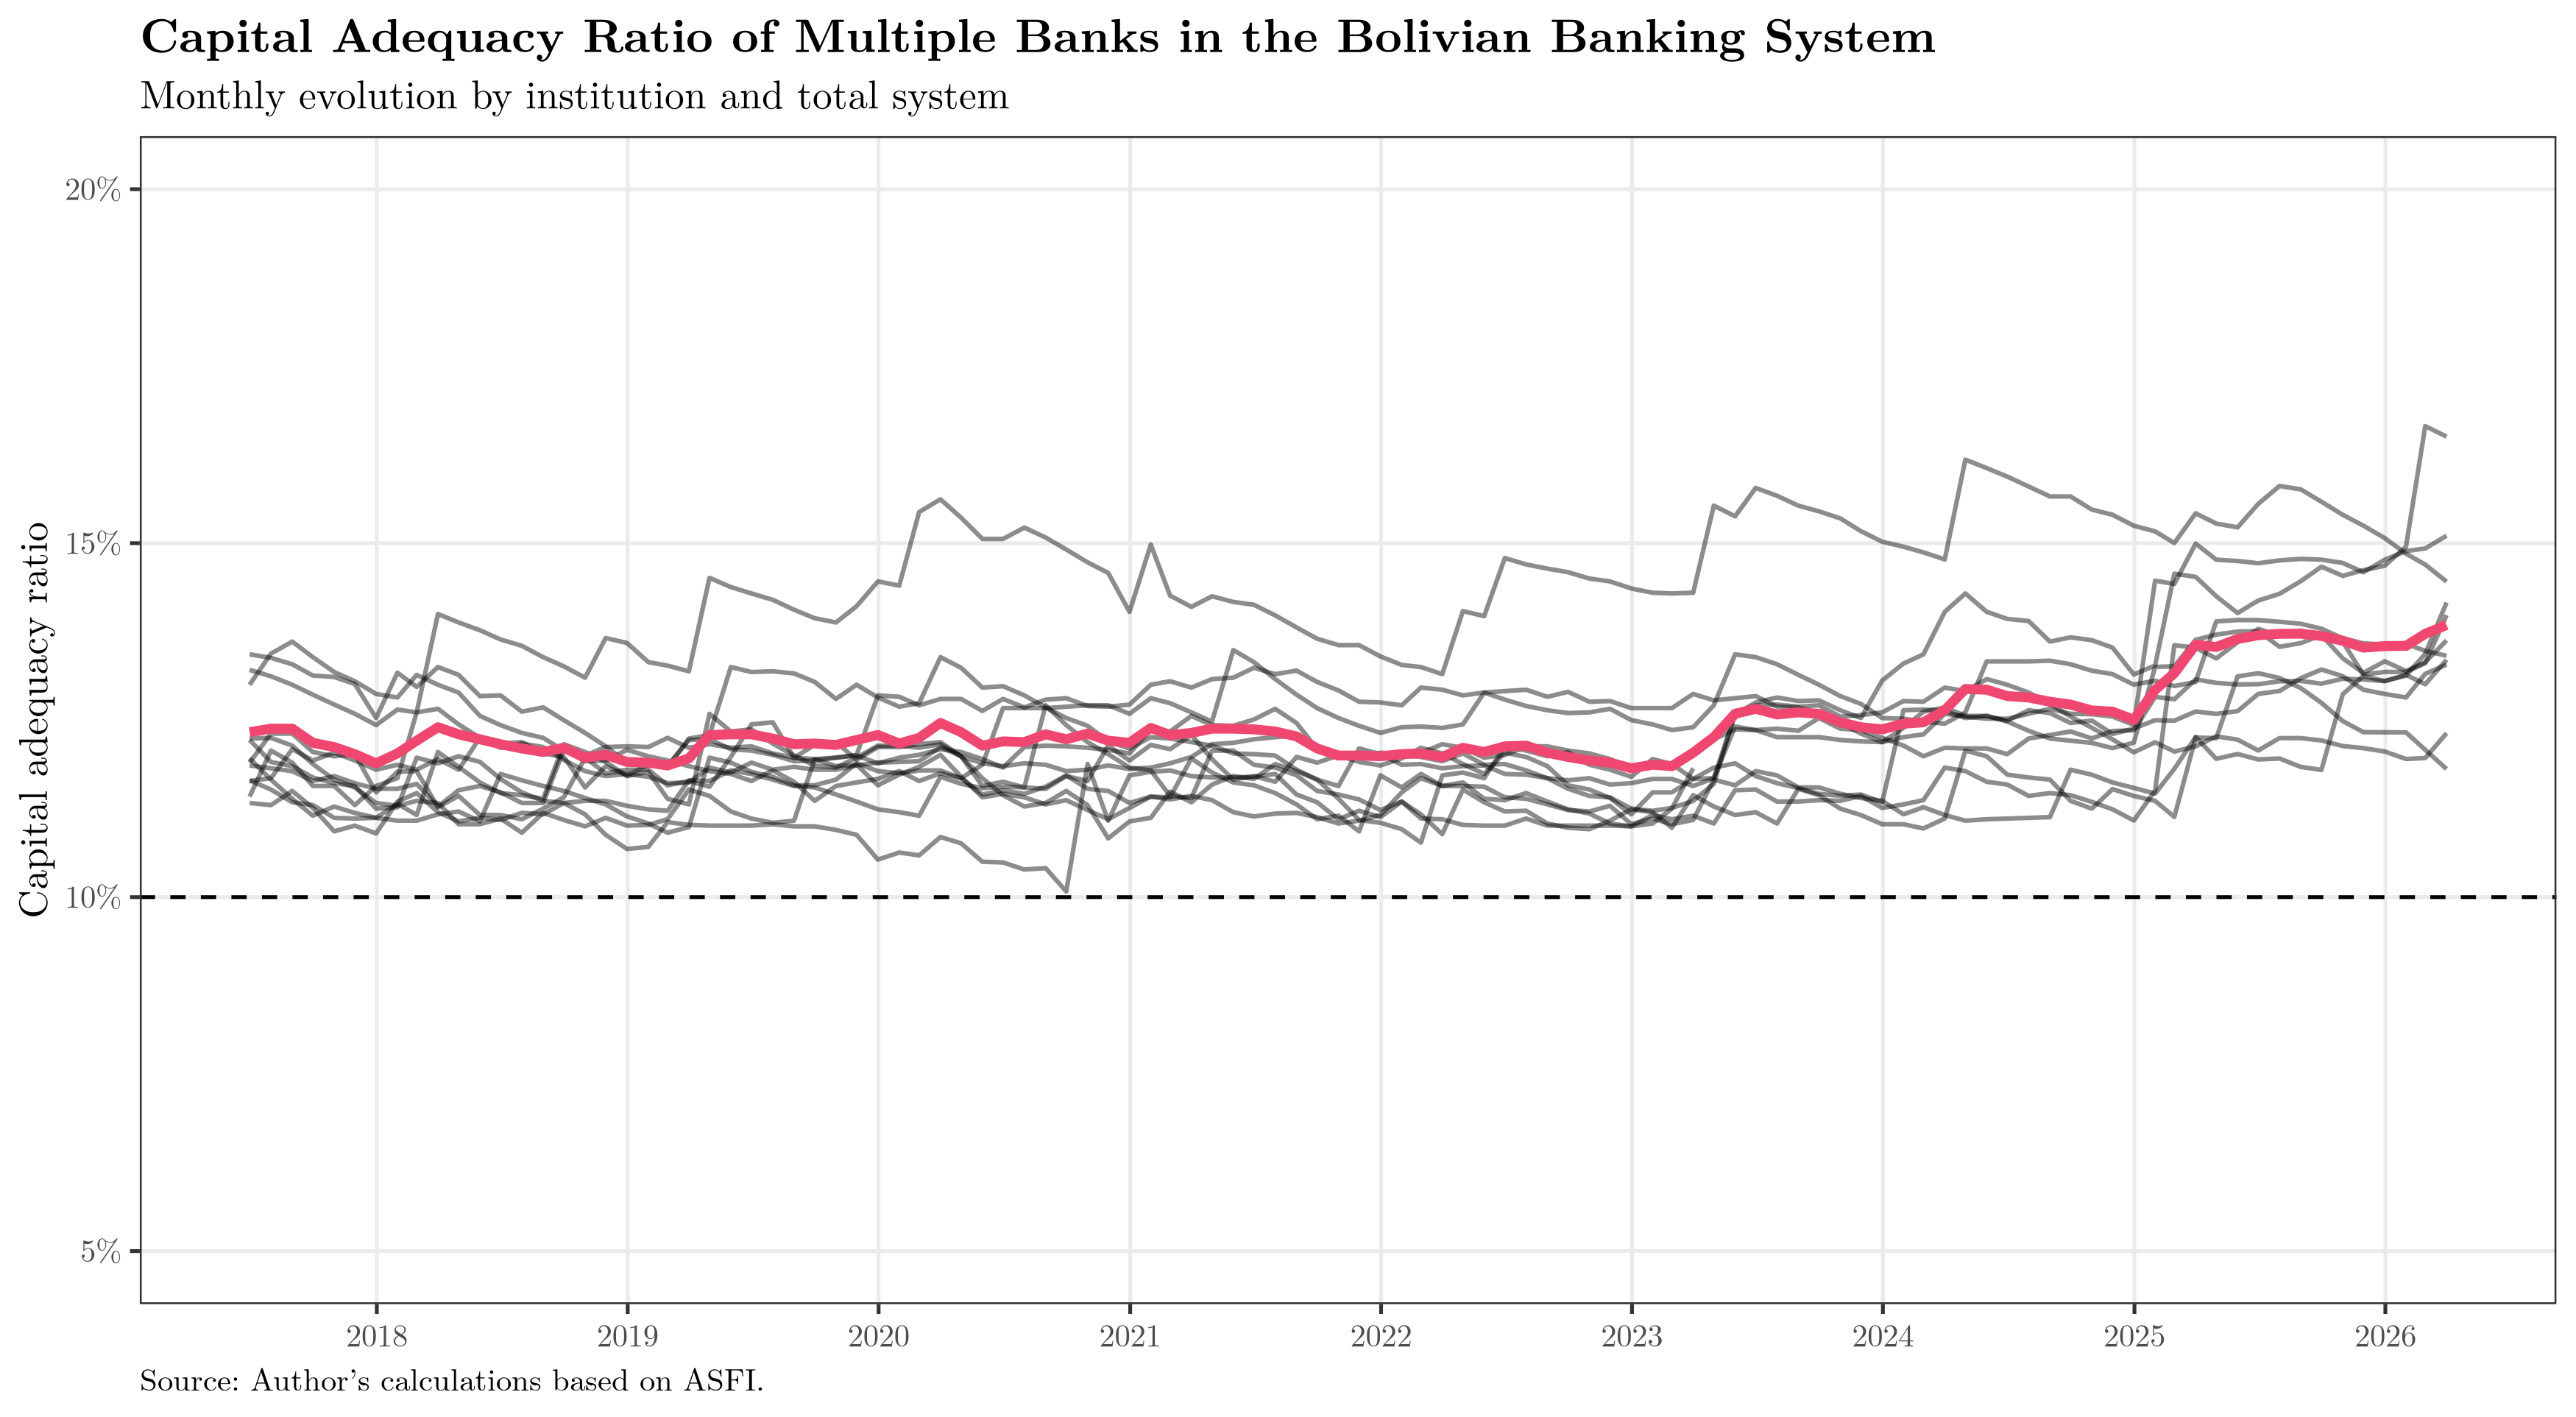
The chart allows for a first reading: multiple banks comply with the regulatory minimum. However, the distance from the threshold is not homogeneous. As of March 2026, the system is above 10%, but some institutions show a narrower buffer than others. The relevant question is what explains that ratio: how much comes from the capital recognized in the numerator and how much from the way computable assets are constructed in the denominator.
Composition of the Numerator
The next step is to look at the numerator. In this case, the chart presents the composition between primary capital and secondary capital after adjustments. From a prudential perspective, it is not equivalent to support the ratio with higher-quality capital than with secondary instruments.
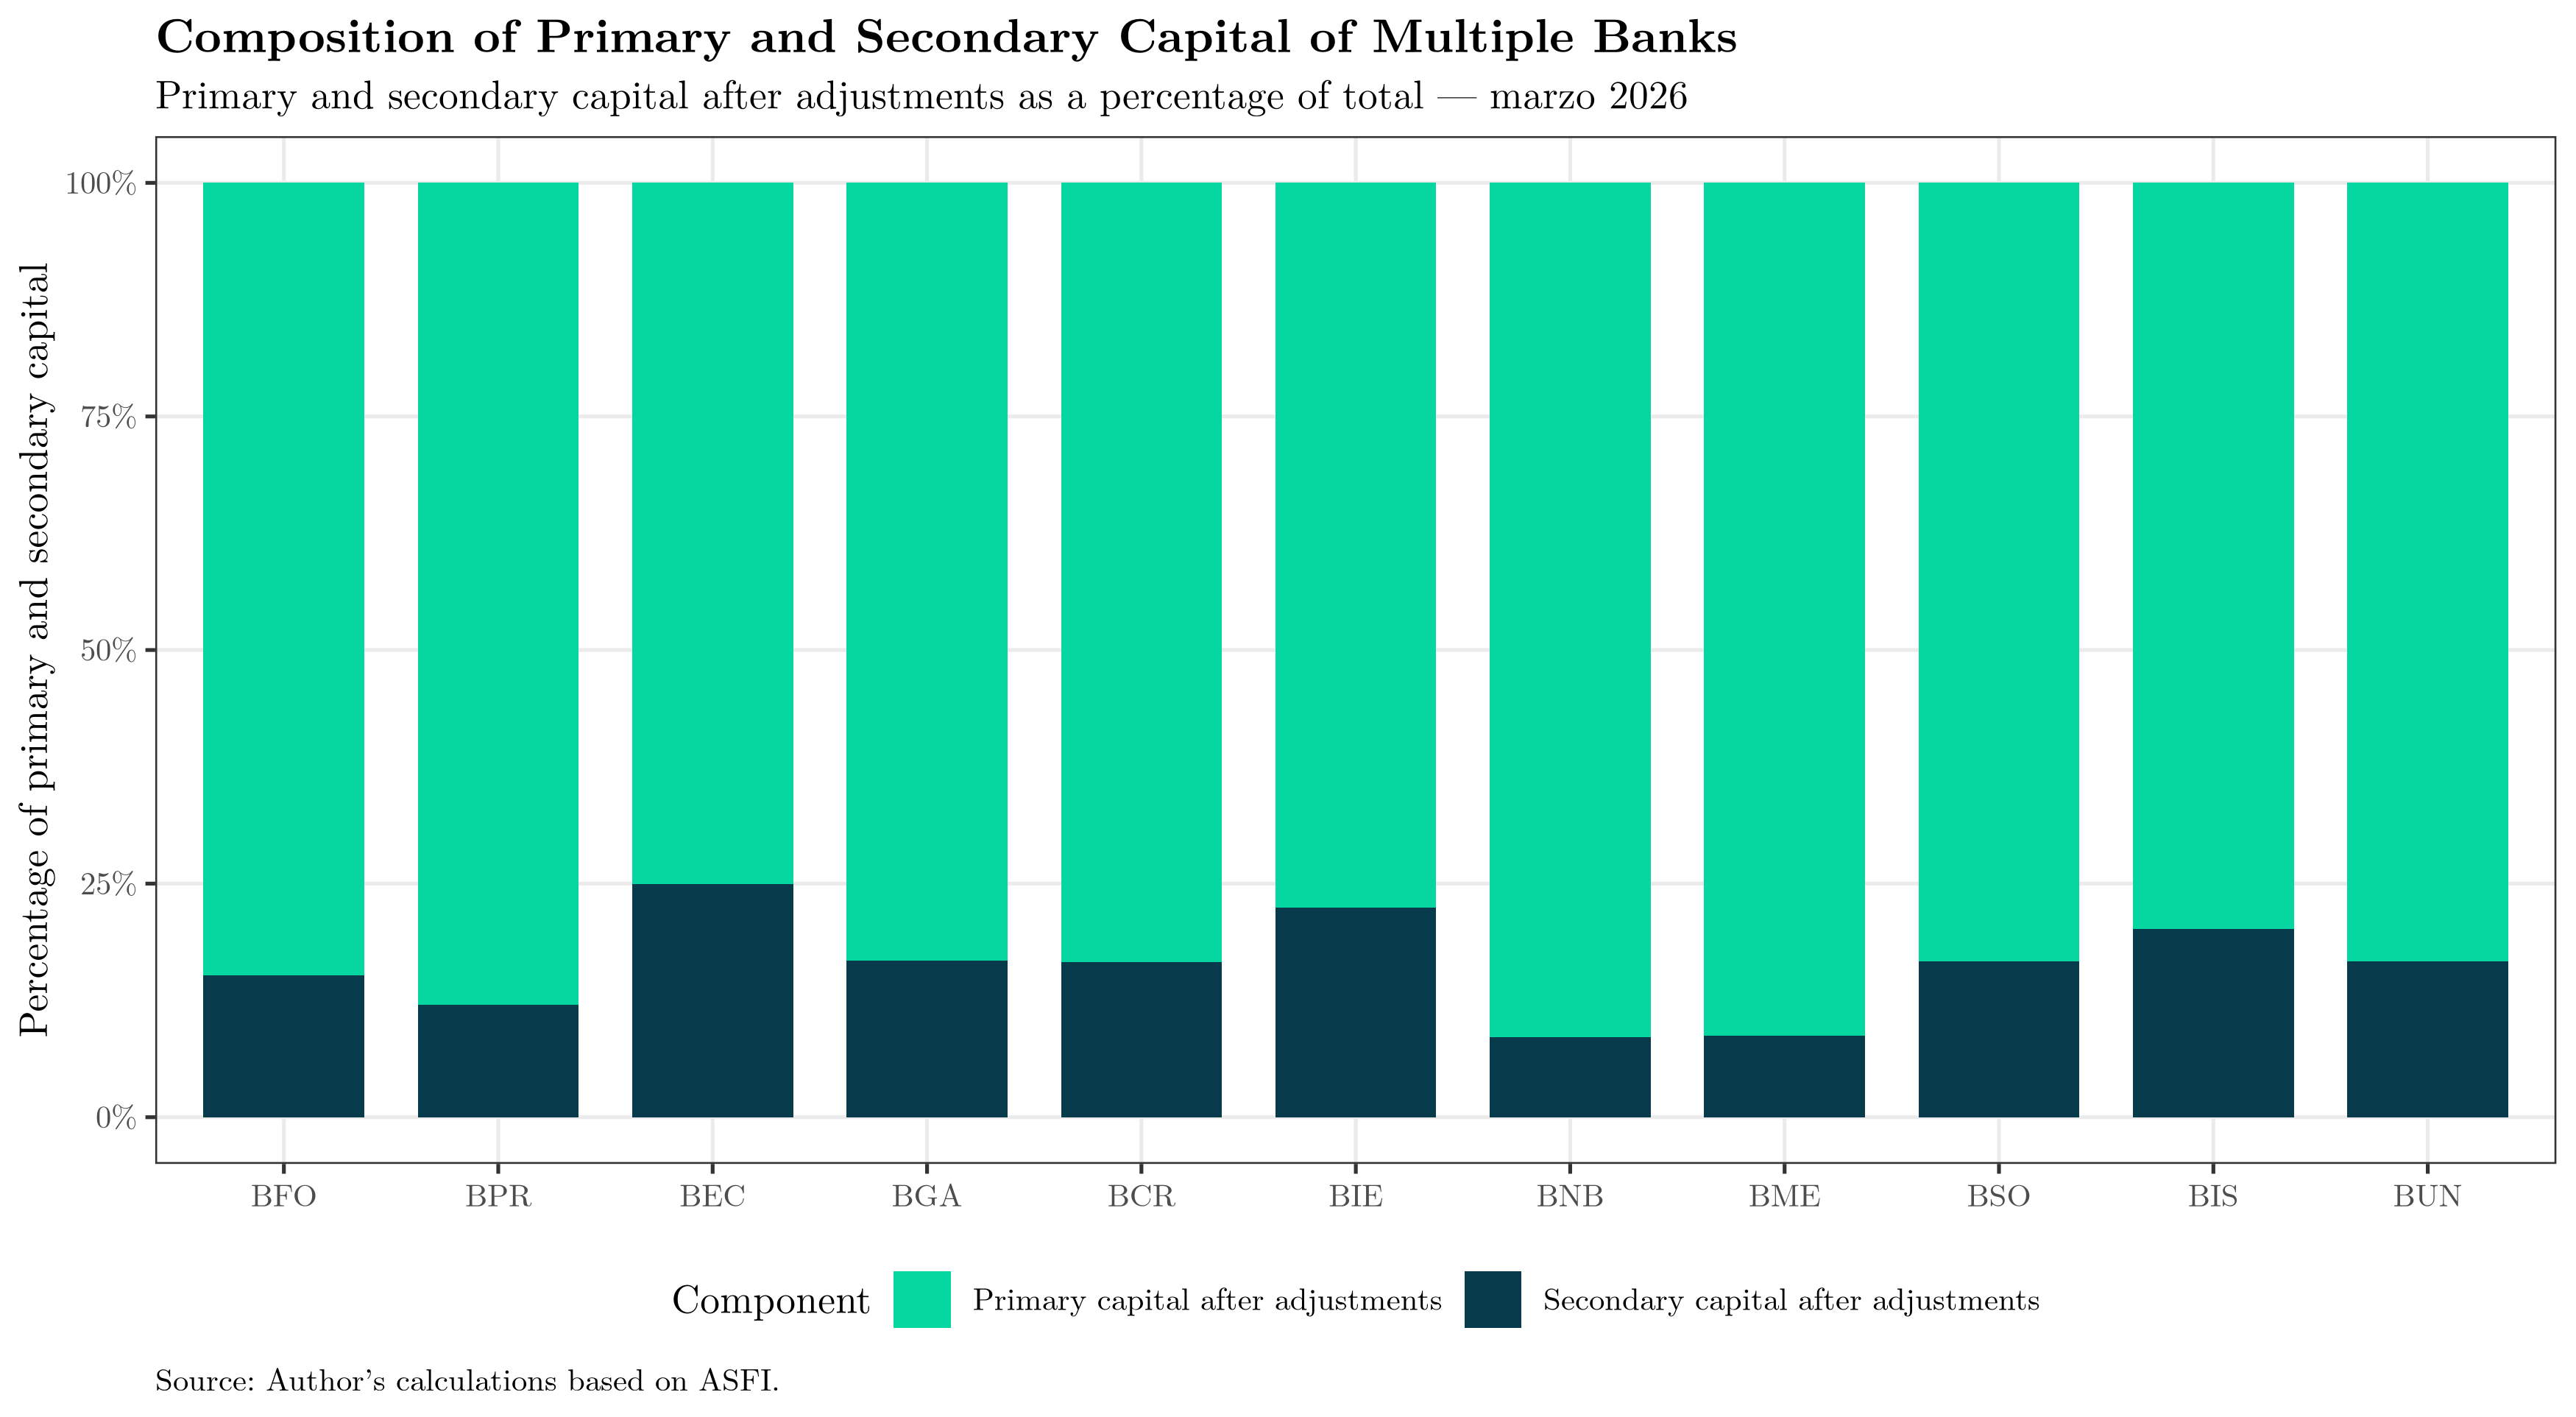
The composition of capital is relevant because it allows us to distinguish between quantity and quality. Primary capital should be the most robust basis of the numerator. Secondary capital may complement that base, but it does not fully replace the loss-absorption capacity of higher-quality capital.
In the observed data, most of the regulatory capital of these institutions comes from primary capital, although there are differences across banks. BEC, BIE, and BIS show a higher relative share of secondary capital within regulatory capital. This does not necessarily imply weakness, but it does call for a more careful reading: the greater the reliance on secondary instruments, the more important it is to verify that these instruments comply with appropriate prudential conditions of subordination, permanence, and loss absorption.
Composition of Assets and Contingents
The denominator also requires decomposition. First, it is useful to observe the composition of assets and contingents by risk-weight category. This chart does not directly show computable assets, but rather the distribution of the total volume of operations according to the assigned regulatory category.
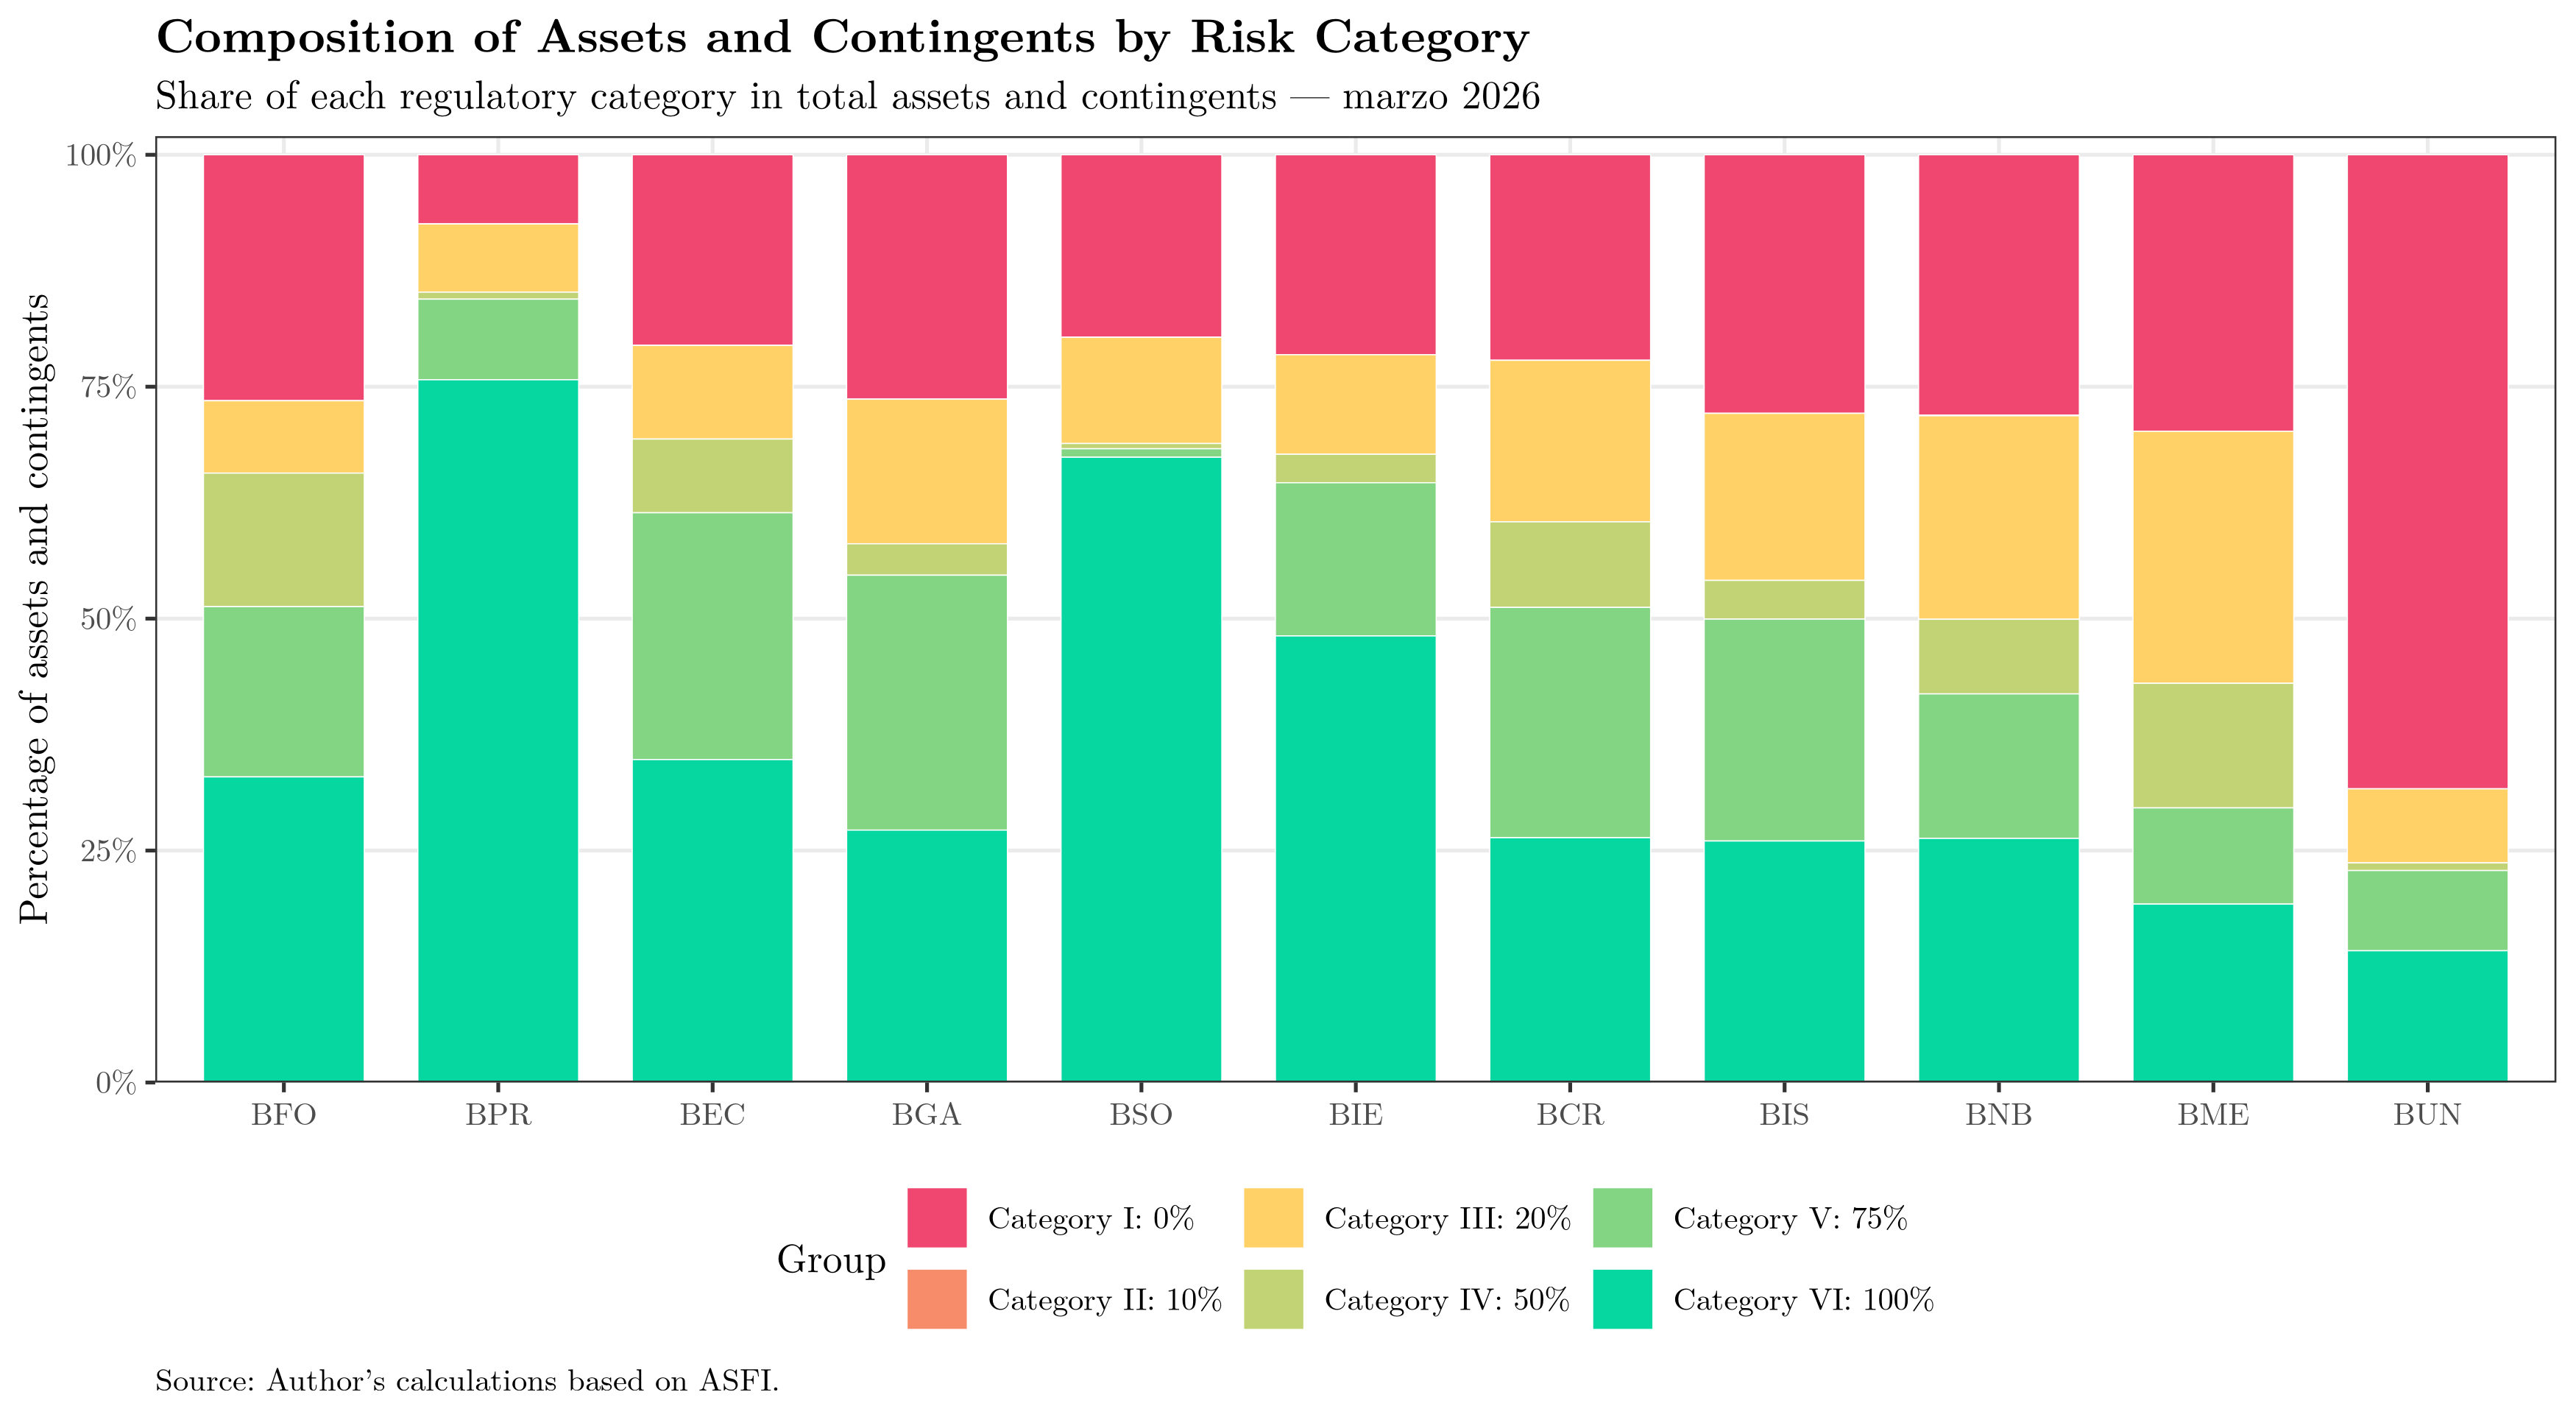
This chart shows the potential regulatory density of the balance sheet. An institution with a higher proportion of assets in Category I will, all else equal, face less pressure on computable assets. By contrast, an institution with a higher proportion in Category VI will transfer a larger share of its assets and contingents to the denominator of the capital ratio.
The results show important differences across banks. BUN stands out for having 68.3% of its assets and contingents in Category I, that is, in assets with a 0% risk weight. At the opposite end, BPR has only 7.5% in Category I and a very high concentration in Category VI. This difference is prudentially relevant: not all banks consume capital in the same way for each boliviano of assets and contingents.
It is also worth noting that Category II, with a 10% risk weight, is practically irrelevant in the structure of the system. The effective discussion is concentrated in the 0%, 20%, 50%, 75%, and 100% categories.
An important point should be emphasized: these categories should not be read as a perfect measurement of the economic risk of each asset. They are regulatory categories used to calculate capital adequacy. Bolivian regulation itself states that the risk weighting of assets and contingents does not replace judgments on market prices or the economic risk of assets, but rather serves to measure capital adequacy.
Composition of Computable Assets
The following chart shows the composition of the effective denominator of the ratio: computable assets. Unlike the previous chart, here each category enters multiplied by its risk weight.
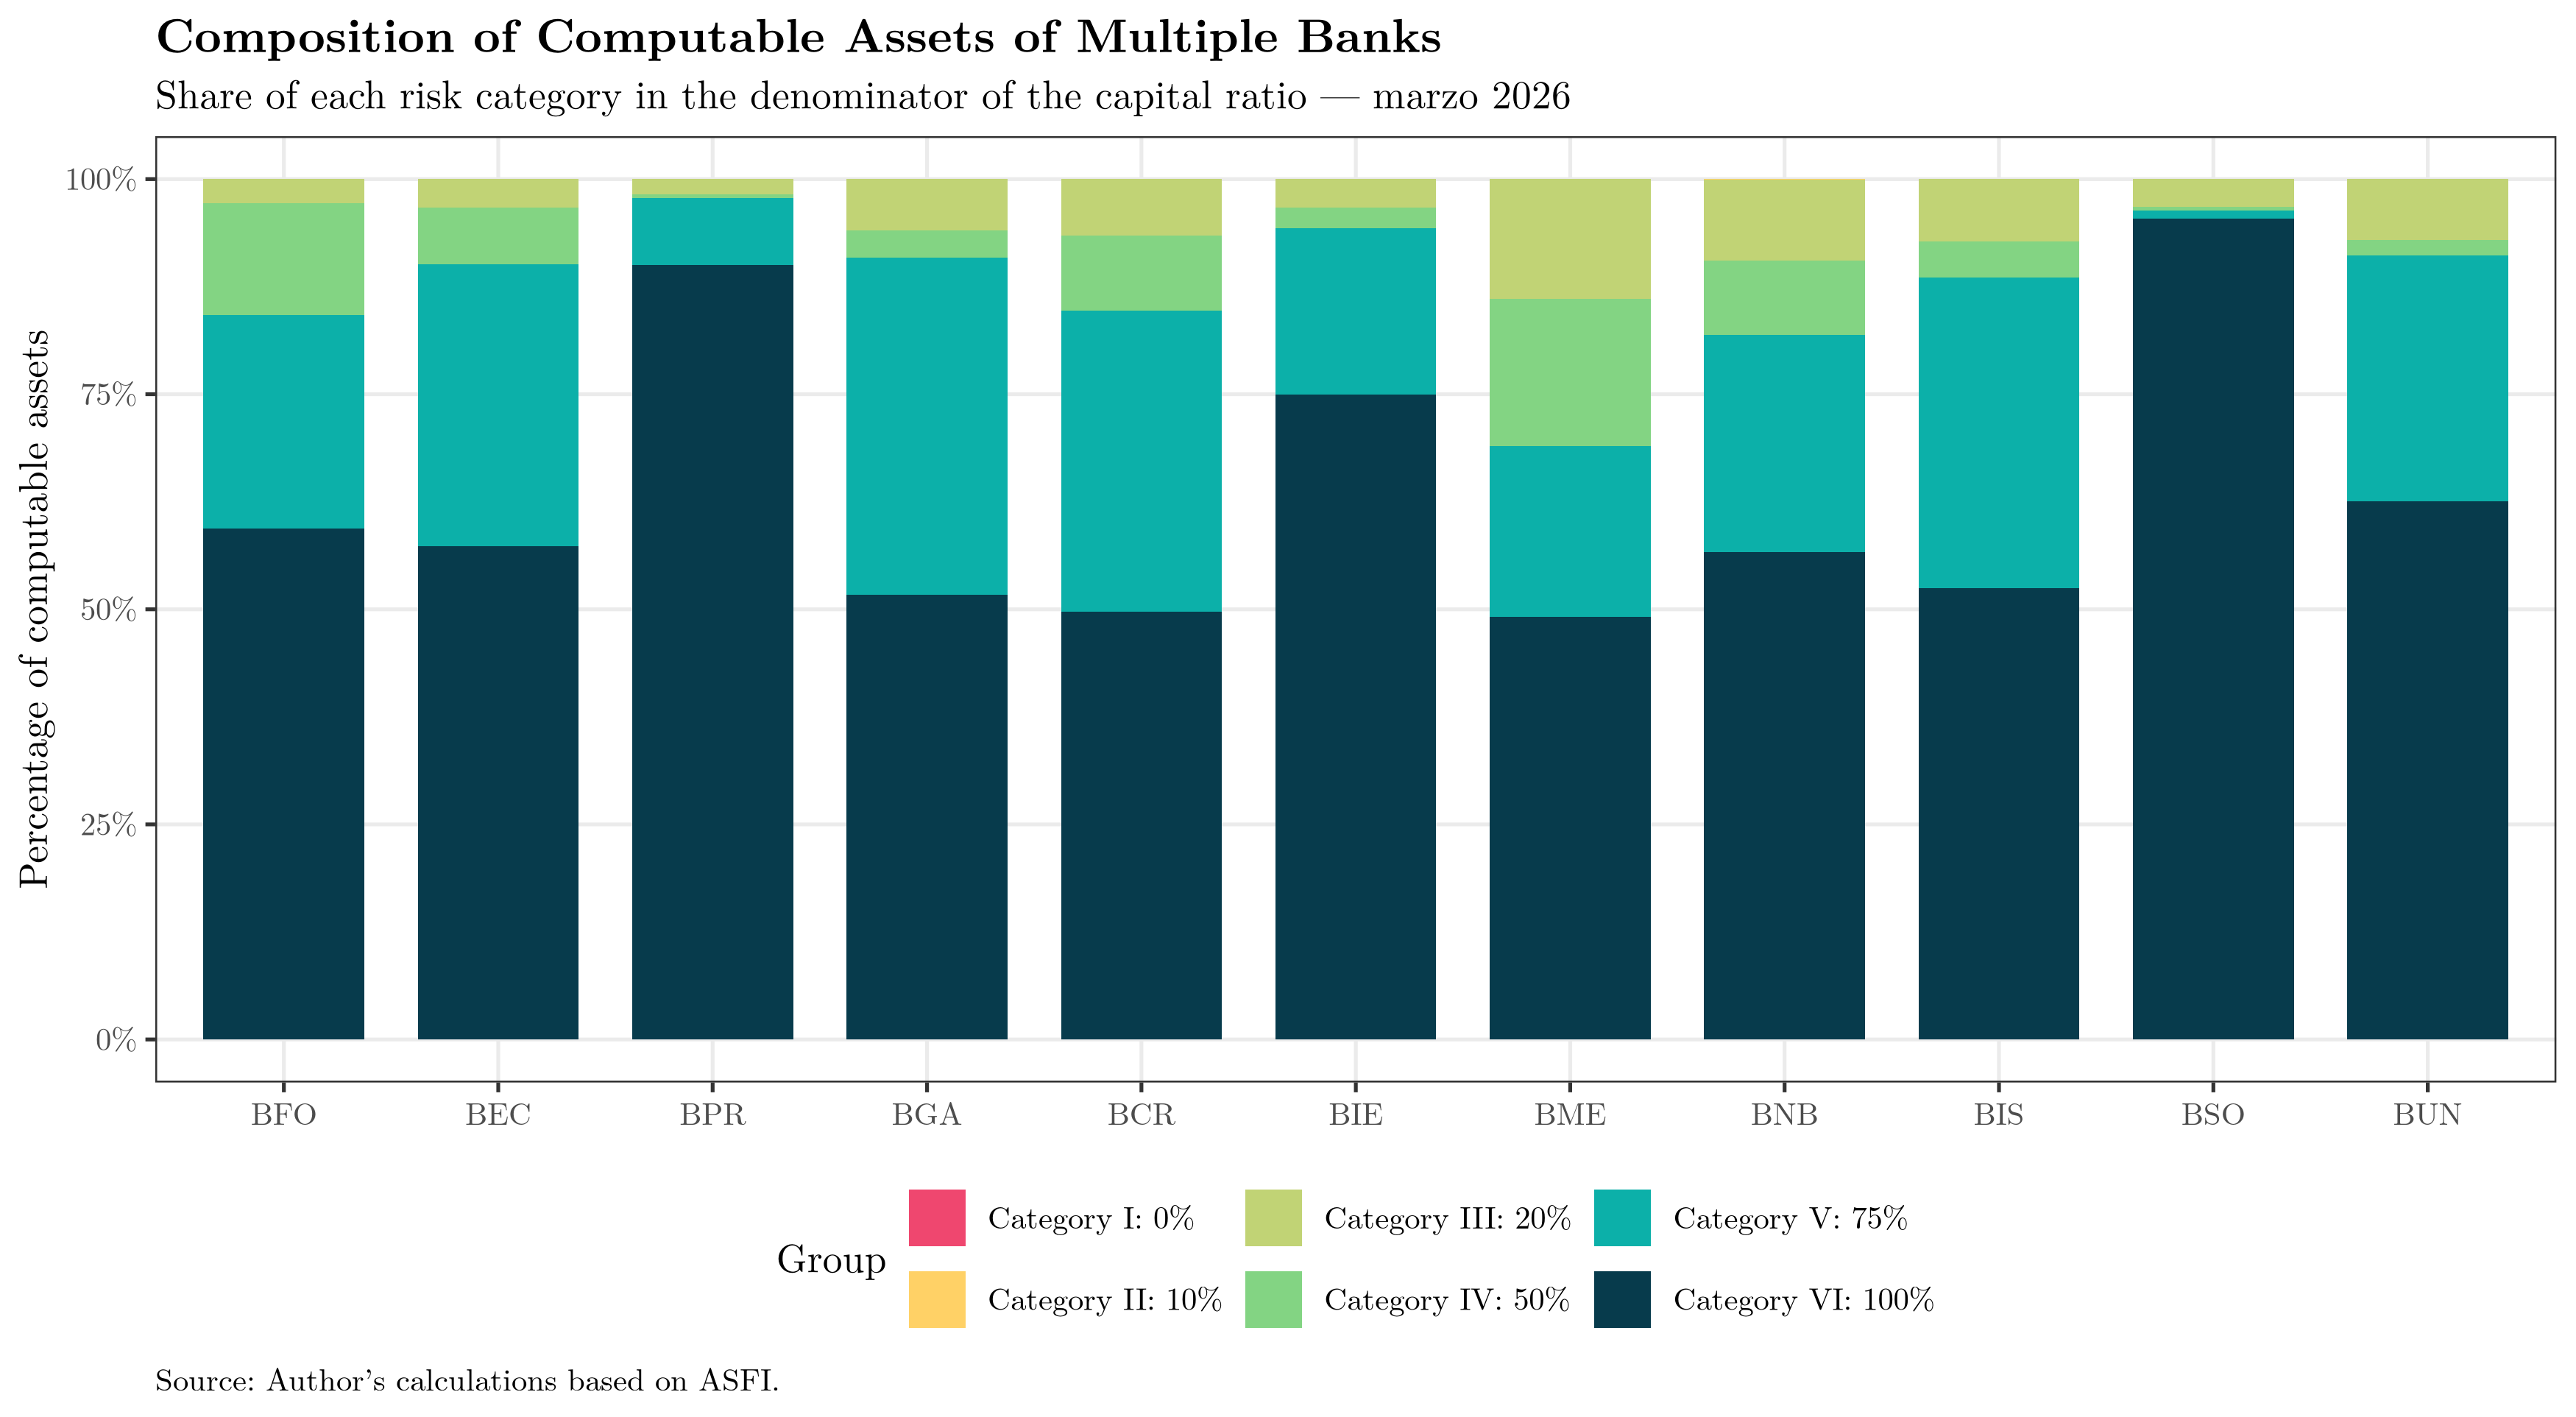
The difference between both charts is useful. The first shows where total assets and contingents are located. The second shows which categories end up explaining the effective denominator of the ratio. In practice, zero-risk-weighted assets may be important in balance sheet size, but they do not appear in computable assets. This is why an institution may have a high volume of operations and still have a relatively contained denominator.
This is clearly seen in BUN. As of March 2026, its assets and contingents exceed Bs 115 billion, but its computable assets are approximately Bs 26.2 billion. In other words, its regulatory density is only 22.7%. Put differently, for every 100 bolivianos of assets and contingents, only around 23 enter the denominator of the capital ratio. This is nevertheless striking, given that in March 2026 its loan portfolio represented 17% of the total system — making it the most important bank by this metric — and 60.7% of its assets, below the system average of 65.2%, but not by an order of magnitude.
At the other end is BPR, with a regulatory density of 84.1%. This means that almost all of its assets and contingents end up being transferred to computable assets. BSO and BIE also stand out, with regulatory densities of 70.7% and 64.2%, respectively. These banks have balance sheets that are more intensive in high-risk-weight categories and therefore consume more capital per unit of assets.
This difference helps interpret the CAP more accurately. BUN has the lowest CAP in the group, 11.8%, but not because its denominator is particularly demanding; the opposite is true. Its ratio is tight despite having the lowest regulatory density. This suggests that a significant part of its capital adequacy depends on maintaining an asset structure with low risk weights. If that composition shifted toward higher-risk categories, or if the weighting methodology were more demanding, its buffer could narrow.
By contrast, banks such as BPR or BSO have heavier denominators, but do not necessarily have the lowest CAP. This shows that regulatory solvency depends on two simultaneous forces: the strength of capital in the numerator and the strictness of computable assets in the denominator.
A Simplified CAP Table
The following table summarizes the regulatory bridge between assets and contingents, computable assets, regulatory capital, the minimum requirement, the capital surplus, and the CAP.
| linea | BCR | BEC | BFO | BGA | BIE | BIS | BME | BNB | BPR | BSO | BUN | TOTAL SYSTEM |
|---|---|---|---|---|---|---|---|---|---|---|---|---|
| Total assets and contingents (BOB bn) | 29.51 | 17.34 | 6.57 | 23.74 | 28.06 | 38.49 | 46.89 | 39.96 | 12.82 | 27.96 | 115.50 | 387.09 |
| Computable assets = Σ Asset_i × risk weight_i | 15.67 | 10.53 | 3.64 | 12.49 | 18.02 | 19.11 | 18.36 | 18.54 | 10.78 | 19.75 | 26.21 | 173.24 |
| Primary capital after adjustments | 1.78 | 1.13 | 0.41 | 1.47 | 1.72 | 2.57 | 2.57 | 2.35 | 1.27 | 2.38 | 3.27 | 21.03 |
| Secondary capital after adjustments | 0.35 | 0.38 | 0.07 | 0.30 | 0.50 | 0.65 | 0.25 | 0.22 | 0.17 | 0.48 | 0.66 | 4.02 |
| Regulatory capital = Primary capital + Secondary capital - Deductions | 2.09 | 1.49 | 0.48 | 1.75 | 2.22 | 3.15 | 2.77 | 2.53 | 1.45 | 2.86 | 3.10 | 23.98 |
| Minimum requirement = 10% × computable assets | 1.57 | 1.05 | 0.36 | 1.25 | 1.80 | 1.91 | 1.84 | 1.85 | 1.08 | 1.98 | 2.62 | 17.32 |
| Capital surplus = Regulatory capital - Minimum requirement | 0.53 | 0.44 | 0.12 | 0.50 | 0.42 | 1.24 | 0.94 | 0.67 | 0.37 | 0.88 | 0.47 | 6.66 |
| CAP = Regulatory capital / Computable assets | 13.35% | 14.16% | 13.29% | 13.98% | 12.32% | 16.50% | 15.11% | 13.63% | 13.41% | 14.46% | 11.81% | 13.84% |
This table shows the mechanics of capital adequacy in a compact way. To arrive at the CAP, computable assets are calculated first, then the minimum requirement, then the capital surplus, and finally the capital ratio.
The most important reading is that regulatory compliance exists, but it is not homogeneous. BUN has the smallest buffer above the minimum: its CAP is 11.8%, equivalent to 1.8 percentage points above the regulatory threshold. At the same time, it is the bank with the lowest regulatory density and the highest share of assets in Category I. This is the most relevant combination in the analysis, because it shows a relatively tight ratio supported by a particularly light denominator.
BIE also deserves attention, although for a different reason. It has the second-lowest CAP, 12.3%, but with a regulatory density of 64.2% and a high share in Categories V and VI. In this case, the pressure comes more clearly from the denominator: the balance sheet consumes more capital per unit of assets and contingents.
By contrast, BIS and BME show greater relative buffers. BIS has the highest CAP among the banks considered, at 16.5%, while BME combines low regulatory density with a more comfortable ratio.
In short, banks comply with the local minimum, but they do not all arrive at compliance in the same way. Some do so with a lighter denominator; others, with higher regulatory density and a more demanding capital need. This difference is central to moving from a formal reading of the CAP to a prudential reading.
The Devil Is in the Details
Notes on the Numerator: Own Funds
The fact that banks comply with the Capital Adequacy Ratio is important, but it does not close the discussion. A prudential reading requires looking at how the ratio is built: not only how much regulatory capital an institution reports, but how verifiable the economic quality of that capital is and how demanding the denominator against which it is compared is.
On the numerator side, the evidence shows that Bolivian banks hold most of their regulatory capital in primary capital. This is positive, because primary capital is, in principle, the most robust layer of the numerator. In addition, Law 393 distinguishes between primary capital and secondary capital, defines regulatory capital as the sum of both net of adjustments and deductions, limits the recognition of secondary capital, and requires primary capital, after adjustments, to be no less than 7% of risk-weighted assets and contingents.
The caution, then, should not be framed as if the numerator were necessarily composed of low-quality instruments. The point is more precise: although the institutions comply in reporting terms and primary capital has a predominant weight, prudential analysis depends on the supervisor and external auditors being able to verify that the instruments recognized as capital effectively meet the relevant economic conditions.
In the Basel logic, capital instruments are not eligible merely because of their legal or accounting denomination. They must have real loss-absorption capacity, sufficient subordination, permanence, absence of guarantees or mechanisms that improve their seniority, absence of incentives to redeem, and effective availability to absorb losses when the institution is operating or when it enters non-viability, resolution, or liquidation scenarios. In other words, the question is not only whether an item appears reported as primary or secondary capital, but whether it substantively performs the prudential function expected of it.
Therefore, in the Bolivian case, the emphasis should be on verification. Banks may comply with the minimum CAP while the supervisor must also ensure that the reported capital is truly loss-absorbing capital. This requires reviewing adjustments, deductions, the contractual terms of subordinated obligations, the treatment of reserves and provisions, and any element that could affect the effective availability of capital under stress. In that sense, formal CAP compliance is the starting point; the verifiable quality of capital is what allows solvency to be interpreted with greater confidence.
Notes on the Denominator: Risk-Weighted Assets
The most delicate issue, however, lies in the denominator. Bolivian regulation classifies assets and contingents into risk-weight categories of 0%, 10%, 20%, 50%, 75%, and 100%, reproduced at the end for convenience. Basel, by contrast, starts from more specific exposure classes — sovereigns, banks, corporates, retail, real estate, equity, among others — and, where relevant, assigns risk weights according to external ratings, collateral, counterparty type, and the characteristics of the exposure. For example, sovereign exposures do not automatically receive a 0% risk weight; the weight depends on the rating, except for certain limited national discretions.
This difference creates room for more favorable treatments in Bolivian regulation. Exposures to the BCB and TGN, as well as certain operations guaranteed by these instruments, may receive a 0% risk weight. This can significantly reduce computable assets, especially if an institution concentrates a large part of its balance sheet in sovereign or quasi-sovereign assets.
Something similar occurs with guarantees. The regulation allows certain loans or contingent operations to receive lower weights if they are backed by deposits, BCB or TGN securities, guarantee funds, insurance, or other mitigants. This may be justified, but from the outside it is not always possible to verify the quality, coverage, or enforceability of those guarantees.
There are also preferential treatments for social housing, productive credit, SMEs, and microcredit. In these cases, the reduced risk weight may respond both to prudential criteria and to public policy objectives. The problem is that, when capital regulation is used to promote certain types of credit, the technical criterion may be partially replaced by a political criterion. This is not desirable, because it weakens the prudential reading of the CAP and introduces biases in the allocation and pricing of credit.
Finally, it is striking that certain investments in financial companies, insurance companies, funds, or other firms may receive a 0% risk weight if they were not consolidated or deducted from regulatory capital. Under Basel, equity exposures, subordinated debt, and other capital instruments usually receive more demanding treatments, because they are not considered low-risk assets.
In short, the Bolivian CAP is valid within the local framework, but it must be read with caution. Compliance with the regulatory minimum does not necessarily imply that solvency would be equally comfortable under a more granular international standard.
Conclusion: Compliance Should Not Be the End Point
Bolivian banks comply with local capital adequacy regulation. That is relevant, but it should not close the analysis. The CAP shows that institutions are above the required minimum; however, its interpretation depends on two key elements: the quality of recognized capital and the way computable assets are constructed.
For that reason, Bolivia should gradually move toward a more standardized and internationally comparable prudential regulation. This does not mean mechanically copying European regulation or the Basel framework, nor ignoring the particularities of the Bolivian financial system. It means organizing the local framework around clearer prudential categories, more demanding capital criteria, better traceability of the denominator, and risk measurement more aligned with international standards.
A useful exercise would be to move, with support from international cooperation, toward a regulatory equivalence assessment similar to the one used by the EBA (European Banking Authority) for third countries. Its value would not lie only in obtaining external validation, but in the institutional effort it requires: reviewing Basel implementation, assessing the quality of own funds, analyzing the treatment of credit risk, verifying the use of mitigants, strengthening consolidated supervision, and checking the existence of tools such as SREP, ICAAP, additional capital requirements, corporate governance rules, and effective supervisory mechanisms.
That process would have one central advantage: institutionalizing a prudential regime and forcing it to be maintained over time. It would also help identify gaps, prioritize reforms, strengthen supervision, improve international comparability, and reduce areas of discretion. Instead of discussing only whether banks comply with the Bolivian CAP, it would be possible to assess how robust that compliance is against international standards.
The agenda, however, does not end with capital adequacy. It will also be necessary to advance in the full implementation of international accounting standards such as IFRS 9, especially regarding credit impairment and expected losses; gradually incorporate more sophisticated methodologies to measure credit risk; develop explicit capital requirements for market risk; and strengthen the measurement of operational risk.
There is also an institutional dimension: Bolivia needs a clearer bank resolution framework, with well-defined powers, tools, and strategies. In a modern system, prudential supervision and resolution should be institutionally delimited to prevent the same authority from acting simultaneously as supervisor, intervenor, evaluator, and executor of critical decisions. This point is especially relevant in Bolivia, where ASFI concentrates a broad set of functions and may end up acting, in practice, as both judge and interested party.
These issues go beyond the scope of this post and deserve their own analysis. But they all point to the same conclusion: complying with the local rule is important, but not sufficient. Convergence toward international standards is not only a technical requirement; it is a way to build credibility, institutional discipline, and confidence in the financial system.
Annex. Risk-Weight Categories for Assets and Contingents under Bolivian Regulation
Bolivian regulation classifies assets and contingents into six risk-weight categories for purposes of calculating capital adequacy. These risk weights do not replace an economic or market valuation of asset risk; they are regulatory coefficients used to calculate the computable assets of supervised institutions.
| Category | Risk weight | Main assets or operations included |
|---|---|---|
| Category I | 0% | Cash in vault; deposits at the BCB; investments in securities issued by the BCB or the TGN; repos with BCB or TGN securities; certain external sovereign securities with ratings; contingent operations guaranteed by central banks; loans or operations guaranteed with pledged deposits, BCB or TGN securities, or self-liquidating guarantees from rated financial institutions; certain trusts, public programs, and administered portfolios; investments in certain financial companies, insurance companies, funds, securitization companies, pension-sector firms, or development banks when they have not been consolidated or deducted from regulatory capital. |
| Category II | 10% | Assets in trusts constituted as collateral for mobile payment services; current financial leasing operations involving real estate; accrued receivables and specific provisions on assets weighted at 10%. |
| Category III | 20% | Assets held in or guaranteed by rated domestic or foreign financial intermediation institutions; assets received in administration or trust; loans guaranteed by time deposits issued by rated entities; operations guaranteed by closed-end investment funds or guarantee funds; guarantee bonds counter-guaranteed by rated foreign banks; loans covered by insurance/reinsurance with investment grade; leasing of movable property; social housing loans with mortgage collateral. |
| Category IV | 50% | Current mortgage loans for housing acquisition, construction, remodeling, or improvement; housing microcredits or productive housing structures; SME loans with specialized methodologies and high repayment capacity; microcredits with high repayment capacity and real collateral; accrued receivables and specific provisions on assets weighted at 50%. |
| Category V | 75% | Current loans to borrowers with solid repayment capacity; investments in securities issued by investment-grade non-financial companies; productive loans with real collateral up to the value of the collateral; SME loans with solid repayment capacity; microcredits with acceptable real or non-conventional collateral; accrued receivables and specific provisions on assets weighted at 75%. |
| Category VI | 100% | Assets, operations, and services not included in the previous categories that imply risk or any kind of financial commitment for the supervised institution. |