Economic uncertainty in Bolivia: recent evidence from the EPU index
Introduction
A few days ago, a LinkedIn post by Javier Perez from the Bank of Spain caught my attention. It announced the publication of Economic Policy Uncertainty (EPU) indices for several Latin American countries, including Bolivia. The index is developed in Andres-Escayola et al. (2025).
In addition to publishing the research, the authors created a website (Economic Policy Uncertainty Index) that is periodically updated with new estimates. The Bank of Spain also disseminates these indicators (see Economic Policy Uncertainty (EPU) Indices for Latin America - Banco de España).
Given the scarcity of leading indicators in Bolivia, I found it interesting to explore these data and evaluate what they may reveal about regional macroeconomic dynamics. Before diving into the data, however, it is worth reviewing some key findings from the study.
Some findings
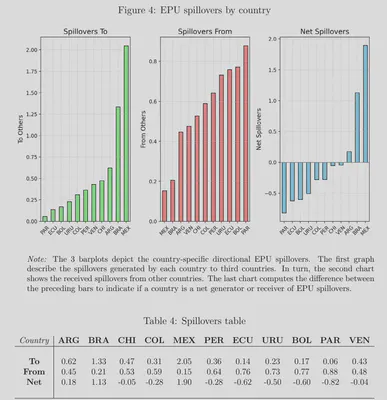
One particularly interesting aspect appears in Figure 4 of Andres-Escayola et al. (2025), where the transmission of economic policy uncertainty across Latin American countries is analyzed.
The results suggest that large economies such as Mexico and Brazil tend to act as main transmitters of uncertainty within the region, while smaller economies — such as Paraguay and Bolivia — appear, on average, as net receivers of these uncertainty episodes.
This is particularly interesting because it suggests that Bolivia is not completely isolated from regional economic dynamics. Uncertainty generated in neighboring countries could have relevant macroeconomic implications, for example in terms of financial volatility, economic expectations, or exchange rate behavior. Naturally, these potential connections require more specific analysis to identify the transmission channels, the affected variables, and the magnitude of their responses.
In any case, if these spillover channels were significant, it would make sense for policymakers to monitor not only domestic uncertainty but also economic and political developments in neighboring countries.
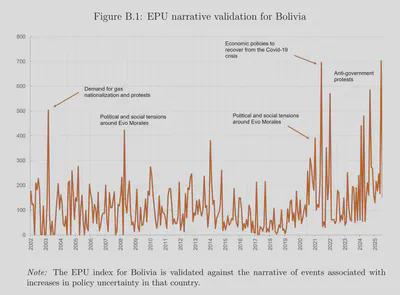
Finally, the authors also publish the index for Bolivia and attempt to validate it using a narrative approach. For example, they identify a spike around the “Black October” events of 2023, another in early 2008 associated with the constitutional process that led to the new Political Constitution of the State, and tensions surrounding Evo Morales’ resignation from power.
We now proceed to analyze the data. For readers interested in further details, a methodological note at the end of this post explains how the index was constructed.
The data
We will use several libraries during the analysis:
library(tidyverse)
library(openxlsx)
library(kableExtra)
First, we download the information directly from the source:
url <- "https://www.bde.es/f/webbe/SES/AnalisisEconomico/AnalisisEconomico/America_latina/Publicaciones/EPU_LATAM.xlsx"

# Read directly the "data_LATAM" sheet
epu_latam <- openxlsx::read.xlsx(url,
                                 sheet = "data_LATAM",
                                 detectDates = T
                                 )

knitr::kable(
  tail(epu_latam[,c(1:5)], 3)
)
| datem | EPU_ARG_local | EPU_BRA_local | EPU_CHI_local | EPU_COL_local | |
|---|---|---|---|---|---|
| 347 | 2025-11-01 | 116.35984 | 182.2025 | 137.5383 | 183.2943 |
| 348 | 2025-12-01 | 118.46660 | 171.0068 | 253.8108 | 242.5677 |
| 349 | 2026-01-01 | 76.83074 | 199.4219 | 179.7638 | 242.3102 |
Note that the series include the suffixes _local, _foreign, and _allpress. This is because the authors construct three variants of the index: one based on local press, another on international press, and a third combining all available sources.
Let us look, for example, at the indices corresponding to Bolivia:
epu_bol <-  epu_latam |>
  select(datem, contains('BOL'))

knitr::kable(
  tail(epu_bol,3)
  )
| datem | EPU_BOL_local | EPU_BOL_foreign | EPU_BOL_allpress | |
|---|---|---|---|---|
| 347 | 2025-11-01 | 293.5964 | 0.0000 | 125.5519 |
| 348 | 2025-12-01 | 262.4414 | 292.1583 | 290.2480 |
| 349 | 2026-01-01 | 295.6658 | 0.0000 | 253.5598 |
The latest observation corresponds to January 2026. We now plot these series:
epu_bol |>
  pivot_longer(-datem, names_to = "Indice", values_to = "Valor") |>
  mutate(Indice = case_when(
         Indice == "EPU_BOL_local"   ~ "Local EPU",
         Indice == "EPU_BOL_foreign" ~ "International EPU",
         Indice == "EPU_BOL_allpress"~ "Overall EPU",
         TRUE ~ Indice
       )) |>
  ggplot(aes(x = datem, y = Valor, color = Indice)) +
  geom_line(linewidth = 0.8, alpha=0.8) +
  scale_color_manual(values = c(
    "Local EPU"   = "#ef476f",
    "International EPU" = "#ffd166",
    "Overall EPU"= "#06d6a0"
  )) +
  labs(
    title = "Economic Policy Uncertainty Index – Bolivia",
    subtitle = "Indices based on local press, international press, and combined sources",
    x= NULL,
    y="EPU Index")+
  theme_bw(base_family = 'Latin Modern Roman') +
  theme(
    legend.position = "bottom"
  )
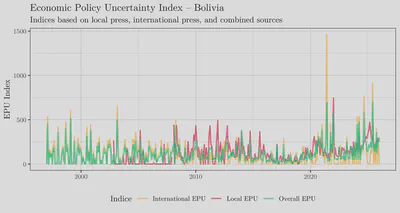
As can be seen, both the index based solely on local press and the one based on international press show zero values in some periods. For this reason, the subsequent analysis uses the aggregated index (allpress), which tends to be more stable and representative.
For example, the next graph shows the “allpress” EPU index for Bolivia along with its six-month moving average:
epu_bol |>
  select(datem,EPU_BOL_allpress) |>
  # 6-month moving average
    mutate(
    ma6 = as.numeric(
      stats::filter(EPU_BOL_allpress, rep(1/6, 6), sides = 1)
    )
  ) |>
  ggplot(aes(x = datem)) +
  geom_line(aes(y = EPU_BOL_allpress, colour = "Bolivia EPU"), linewidth = 0.7) +
  geom_line(aes(y = ma6, colour = "6M Moving Average"), linewidth = 1) +
    scale_colour_manual(values = c(
    "Bolivia EPU" = "#118ab2",
    "6M Moving Average" = "#ef476f"
  )) +
    scale_x_date(
    date_breaks = "2 years",
    date_labels = "%Y"
  ) +
  labs(
    title = "Economic Policy Uncertainty Index – Bolivia",
    x = NULL,
    y = "EPU Index",
    colour = NULL
  ) +
  theme_bw(base_family = 'Latin Modern Roman') +
  theme(
    legend.position = "bottom"
  )
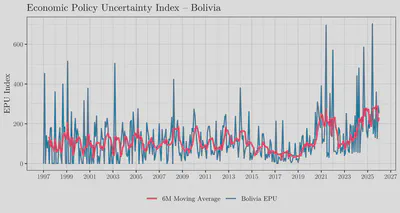
It can be observed that since late 2022, economic policy uncertainty in Bolivia has shown an upward trend, with a brief moderation in early 2025. This pattern becomes clearer when looking at the moving average.
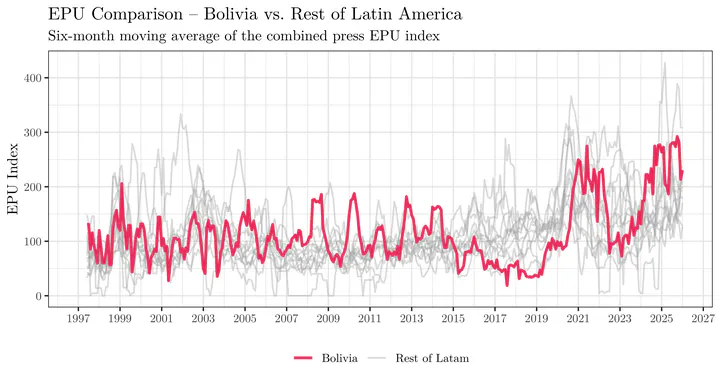
How does Bolivia compare with the rest of the region? The following graph presents the six-month moving average of the EPU index for Bolivia relative to the rest of Latin American countries.
data_ma6 <- epu_latam |>
  select(datem, contains("allpress")) |>
  pivot_longer(-datem, names_to = "pais", values_to = "epu") |>
  group_by(pais) |>
  arrange(datem, .by_group = TRUE) |>
  mutate(
    epu_ma6 = as.numeric(stats::filter(epu, rep(1/6, 6), sides = 1)),
    grupo = if_else(pais == "EPU_BOL_allpress", "Bolivia", "Rest of Latam")
  ) |>
  ungroup()

ggplot(data_ma6, aes(x = datem, y = epu_ma6, group = pais, color = grupo)) +

  geom_line(
    data = ~filter(.x, grupo == "Rest of Latam"),
    alpha = 0.4,
    linewidth = 0.6
  ) +

  geom_line(
    data = ~filter(.x, grupo == "Bolivia"),
    linewidth = 1
  ) +

  scale_color_manual(values = c(
    "Bolivia" = "#ef476f",
    "Rest of Latam" = "grey70"
  )) +
  scale_x_date(
    date_breaks = "2 years",
    date_labels = "%Y"
  ) +
  labs(
    title = "EPU Comparison – Bolivia vs. Rest of Latin America",
     subtitle = "Six-month moving average of the combined press EPU index",
    x = NULL,
    y = "EPU Index",
    color = NULL
  ) +

  theme_bw(base_family = 'Latin Modern Roman') +
  theme(
    legend.position = "bottom"
  )
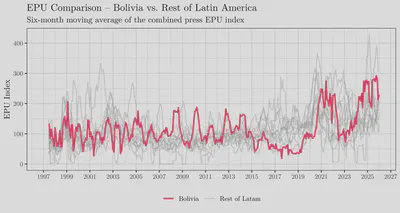
As shown, Bolivia remains among the countries with relatively high levels of economic policy uncertainty within the region, particularly in recent years.
To analyze recent developments in greater detail, it is useful to zoom in starting in 2025, considering that the government change took place on November 8, 2025:
data_bol_2025 <- epu_latam |>
  select(datem, EPU_BOL_allpress) |>
  arrange(datem) |>
  mutate(
    ma3 = as.numeric(stats::filter(EPU_BOL_allpress, rep(1/3, 3), sides = 1)),
    ma6 = as.numeric(stats::filter(EPU_BOL_allpress, rep(1/6, 6), sides = 1))
  ) |>
  filter(datem >= as.Date("2025-01-01"))

ggplot(data_bol_2025, aes(x = datem)) +

  geom_line(aes(y = EPU_BOL_allpress, colour = "EPU Index"), linewidth = 0.7) +
  geom_line(aes(y = ma3, colour = "3M Moving Average"), linewidth = 1) +
  geom_line(aes(y = ma6, colour = "6M Moving Average"), linewidth = 1) +

  geom_vline(
    xintercept = as.Date("2025-11-08"),
    linetype = "dashed",
    alpha = 0.7
  ) +

  scale_colour_manual(values = c(
    "EPU Index"     = "#118ab2",
    "3M Moving Average" = "#ffd166",
    "6M Moving Average" = "#ef476f"
  )) +

  scale_x_date(
    date_breaks = "1 month",
    date_labels = "%b-%Y"
  ) +

  scale_y_continuous(
    name = "EPU Index",
    breaks = seq(0, 700, by = 100),
    sec.axis = sec_axis(~ .,
                        breaks= seq(0, 700, by = 100),
                        name = NULL)
  ) +

  labs(
    title = "Economic Policy Uncertainty Index – Bolivia",
    subtitle = "Original index and moving averages (3 and 6 months)",
    x = NULL,
    colour = NULL
  ) +

  theme_bw(base_family = 'Latin Modern Roman') +
  theme(
    legend.position = "bottom",
    axis.text.x = element_text(angle = 90, vjust = 0.5)
  )
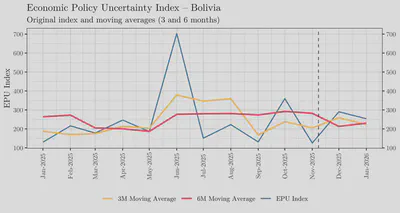
Although it is still premature to draw definitive conclusions, the graph suggests a slight moderation of the index in the months following the government transition. However, uncertainty remains at relatively high levels, so this development should be interpreted cautiously.
In any case, indicators like this should be closely monitored by policymakers. Reducing uncertainty — through clear rules, credible communication, and institutional stability — is essential for strengthening the confidence of households, firms, and investors, thereby fostering a more sustained economic recovery.
Conclusion
In summary, although the available evidence is still preliminary, the relatively high levels of economic uncertainty suggest that reducing it should be a public policy priority. International experience shows that uncertainty tends to decline when clear, stable, and credible rules guide government action. Moving toward more predictable institutional frameworks — where rules prevail over discretion in economic policymaking — can help strengthen the confidence of households, businesses, and investors, facilitating a more favorable environment for investment, growth, and macroeconomic stability.
Methodological note
The construction of the Economic Policy Uncertainty (EPU) index follows a relatively standardized methodology based on textual analysis of written press and relies mainly on Baker, Bloom & Davis (2016). In the case of Bolivia, the Bank of Spain applied the same methodological logic used internationally, as described in Andres-Escayola et al. (2025).
Selection of information sources
The first step is defining a set of newspapers that reasonably reflect national economic and political debate. For Bolivia, the main sources include:
Additionally, to improve coverage and temporal continuity, some international agencies and foreign press in Spanish and English (Corporación Financiera de Noticias and Reuters Latin America) are included when they specifically refer to Bolivia. This helps reduce biases arising from limitations in local archives or publication interruptions.
Definition of search terms
The index identifies articles containing terms simultaneously associated with three dimensions:
- Economy (E): words related to economic activity, the economy, or macroeconomic variables.
- Economic Policy (P): references to government, central bank, fiscal or monetary policy, regulation, taxes, reforms, budgets, public debt, etc.
- Uncertainty (U): terms such as uncertainty, risk, instability, or volatility.
Only articles including at least one term from each group are considered evidence of economic policy uncertainty.
Monthly article counts
For each newspaper and each month, two quantities are calculated:
- Number of articles meeting the EPU criterion.
- Total number of published articles.
The preliminary index for each outlet is constructed as:
$$EPU_{i,t} = \frac{\text{EPU Articles}_{i,t}}{\text{Total Articles}_{i,t}}$$This adjustment corrects for changes in total news volume, preventing artificial inflation of the indicator due to increased publication frequency.
Standardization across newspapers
Newspapers differ in editorial style, publication frequency, and thematic coverage. To avoid one source dominating the index:
- Each series is divided by its own historical standard deviation.
- This equalizes volatility across sources.
Thus, the index reflects relative changes in uncertainty rather than structural differences between newspapers.
National aggregation for Bolivia
Once individual series are standardized, they are averaged to obtain a single monthly index for Bolivia:
$$EPU^{Bolivia}_t = \frac{1}{N} \sum_{i=1}^{N} EPU_{i,t}^{std}$$The result is a synthetic indicator of how frequently the press discusses economic policy uncertainty in the country.
Index normalization
Finally, the series is rescaled so that its mean equals 100 in a base period. This facilitates interpretation:
- Values above 100 indicate higher-than-average historical uncertainty.
- Values below 100 indicate relatively lower uncertainty.