Banking in Bolivia as of September 2025: Between Real Contraction, Short-Term Positioning, and Exposure to the Public Sector
Introduction
As usual in these columns, we will analyze the performance of the banking system over the past three months, based on the information published by the Financial System Supervisory Authority (ASFI). As always, the analysis is conducted using the financial statements (EEFFs) of the institutions, and it represents a personal interpretation.
However, before beginning, it is useful to outline the macroeconomic context in which banking activity in Bolivia is taking place, as it has become the main concern of Bolivians today.
Macroeconomic context
This quarter has been marked by politics. The August elections and the subsequent October runoff between the “Libre Alliance” of “Tuto” Quiroga and the Christian Democratic Party (PDC) of Rodrigo Paz —the latter being the winner— have been the main focus of national and international attention.
Both alliances shared a similar diagnosis of the economy’s condition and proposed comparable measures to address the country’s economic challenges, many of which have already been widely discussed in previous columns (for example, see the government programs here).
They both proposed reducing the fiscal deficit, re-institutionalizing the Central Bank of Bolivia (BCB), and creating a network of targeted subsidies to cushion the short-term price increases likely to arise from the “normalization” of the economy.
It can be said that, after 20 years under the Movement for Socialism (MAS) and its systematic erosion of the country’s institutions, there is now a sense of renewal. This does not mean, however, that the new government will be free of mistakes or risks —for instance, during the campaign, Vice President-elect Edman Lara promised a series of populist measures, such as increasing solidarity pensions, establishing a universal salary for housewives, and offering subsidized loans for housing and entrepreneurship— all of which lack economic grounding and contradict the adjustment plan also being proposed. What will happen remains to be seen, although the first public statements by the newly elected president suggest a return to orthodox economic policy.
Nevertheless, the crisis inherited from the MAS government is severe, as reflected in two indicators: economic growth and inflation.
According to the IMF’s World Economic Outlook (WEO), Bolivia’s economic growth has been in free fall since 2021 and is projected to reach zero by the end of 2025 —the worst performance in the past 25 years.
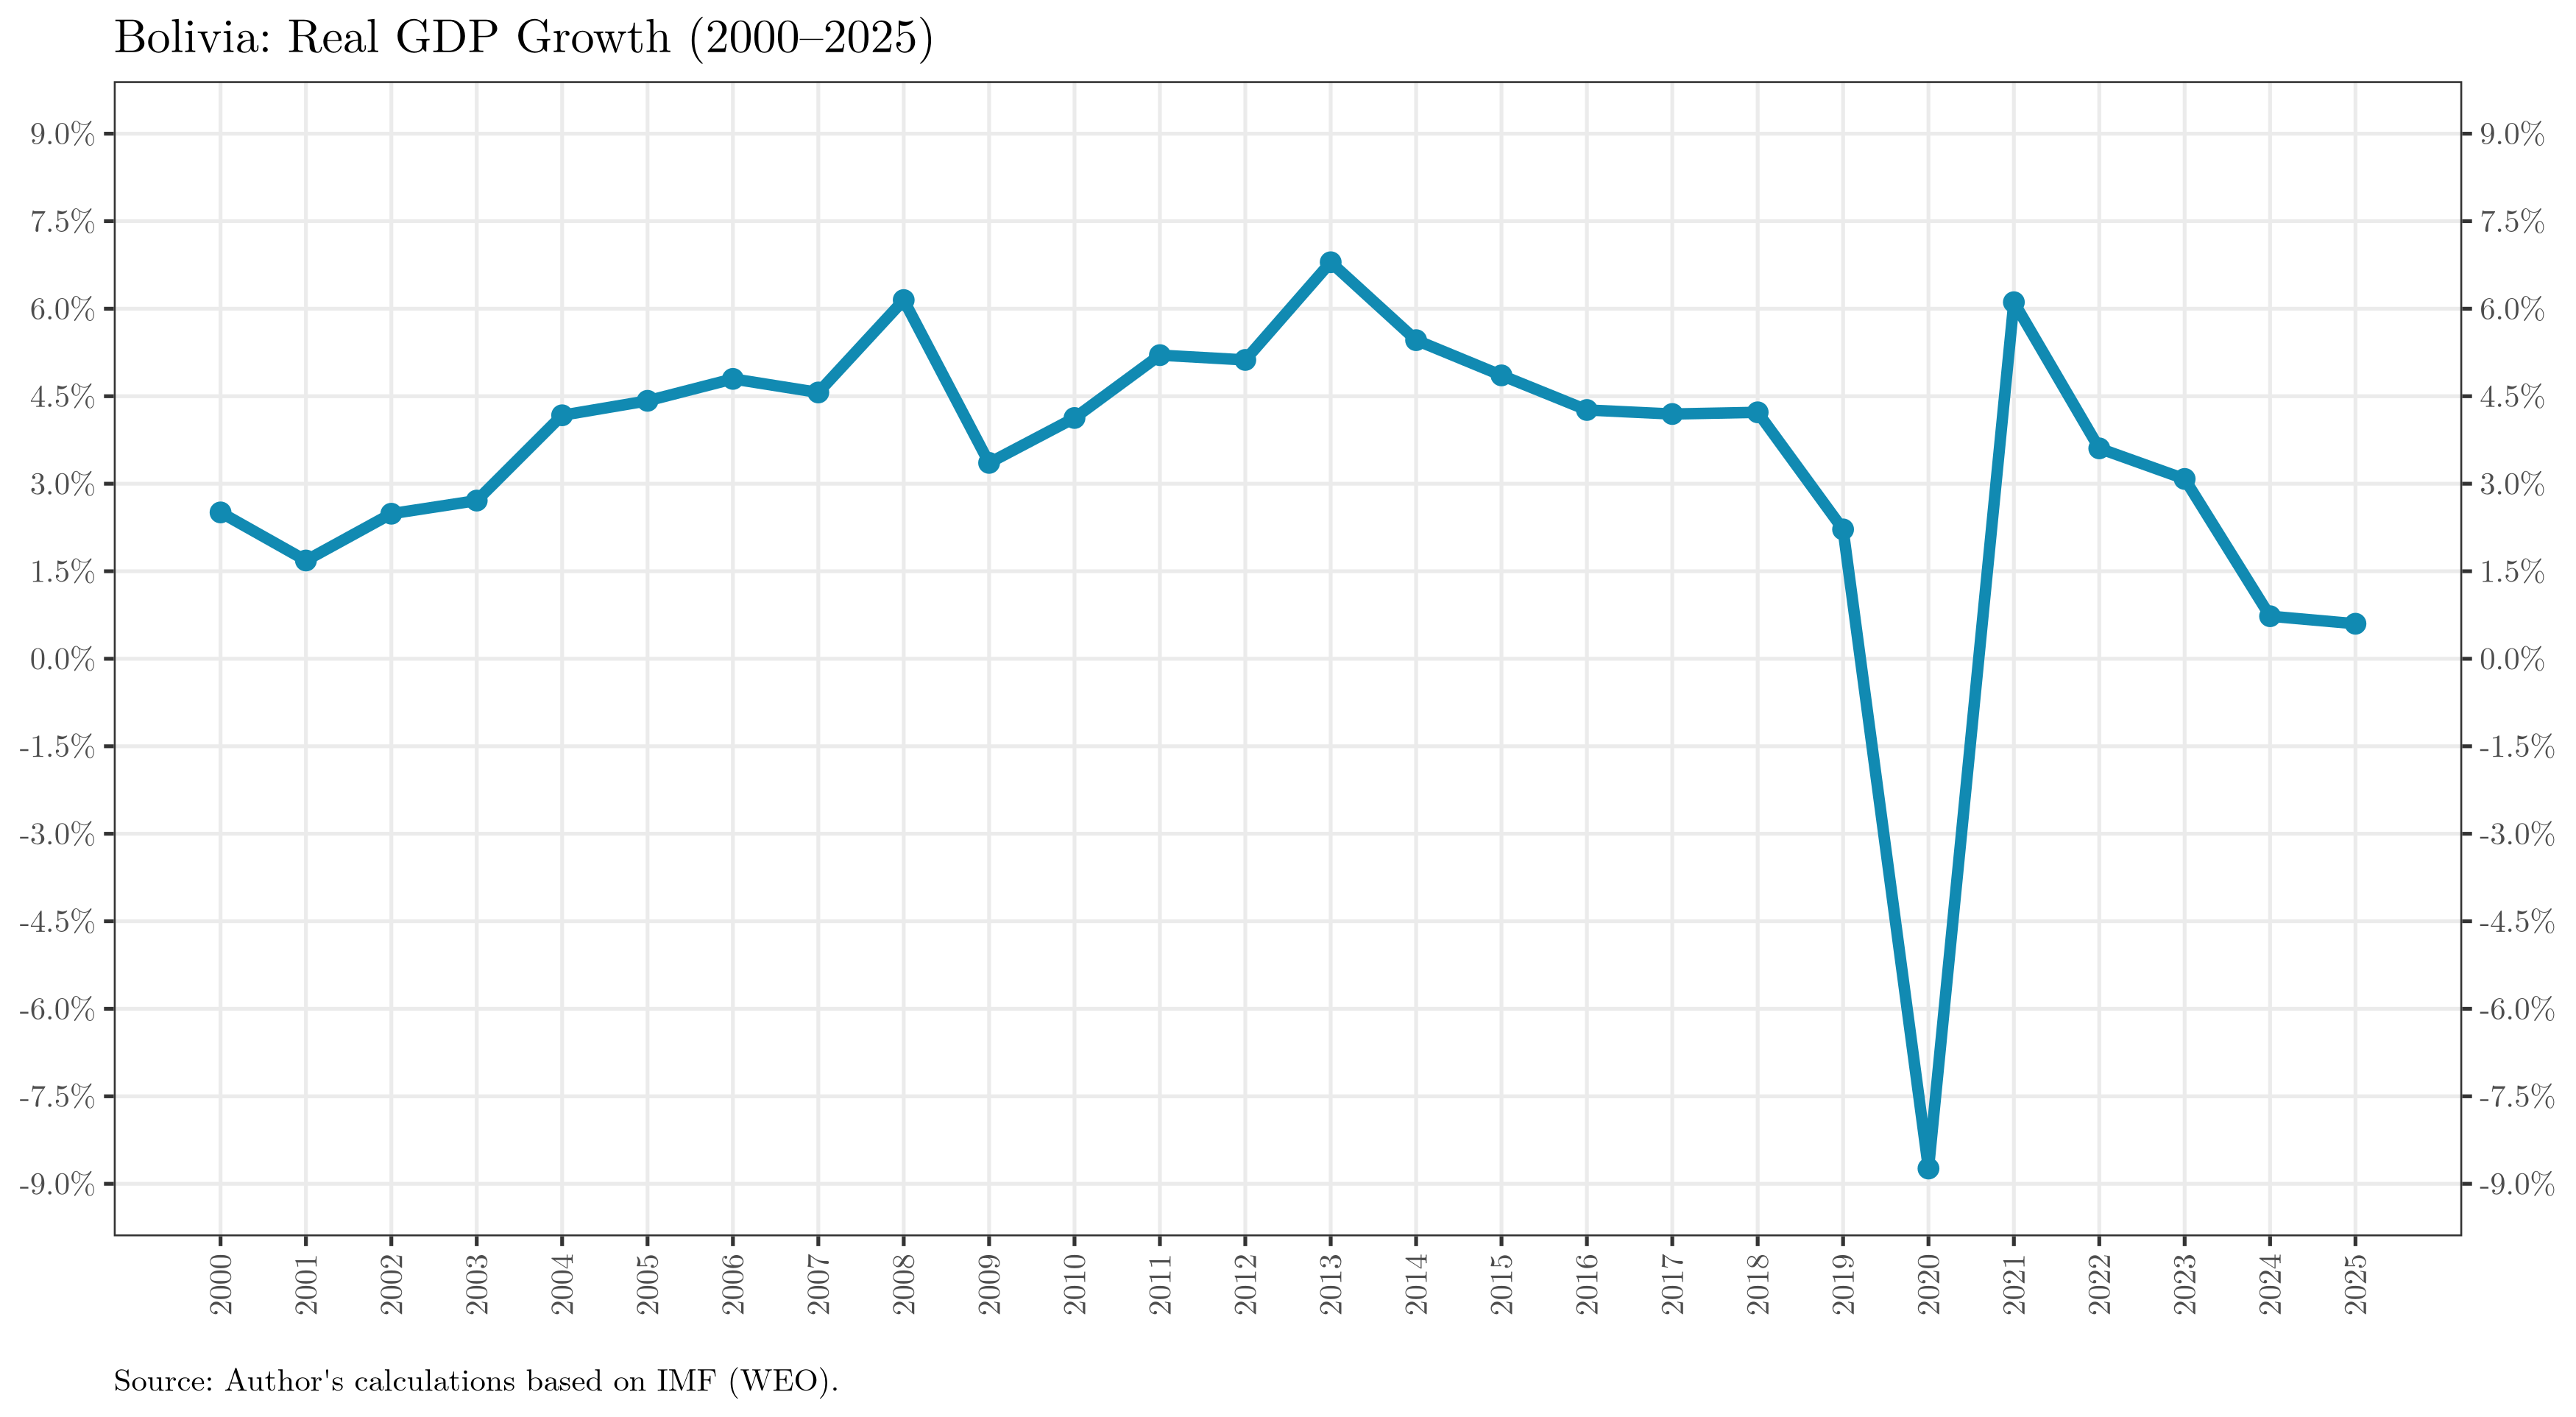
Even more dramatic is the increase in prices: for some subcategories, inflation has exceeded 30% compared with the same month a year earlier.

Moreover, as previously discussed, the once “shielded economy” —in the words of current president Arce Catacora when he was minister of economy— is suffering from a balance-of-payments crisis. This is evident in the shortage of foreign currency (mainly U.S. dollars) and the sharp decline in the BCB’s net international reserves (NIR). The shortage of dollars has also fractured the exchange-rate market: while the official rate remains at Bs. 6.96 per USD, the parallel rate hovers around Bs. 13 per dollar.
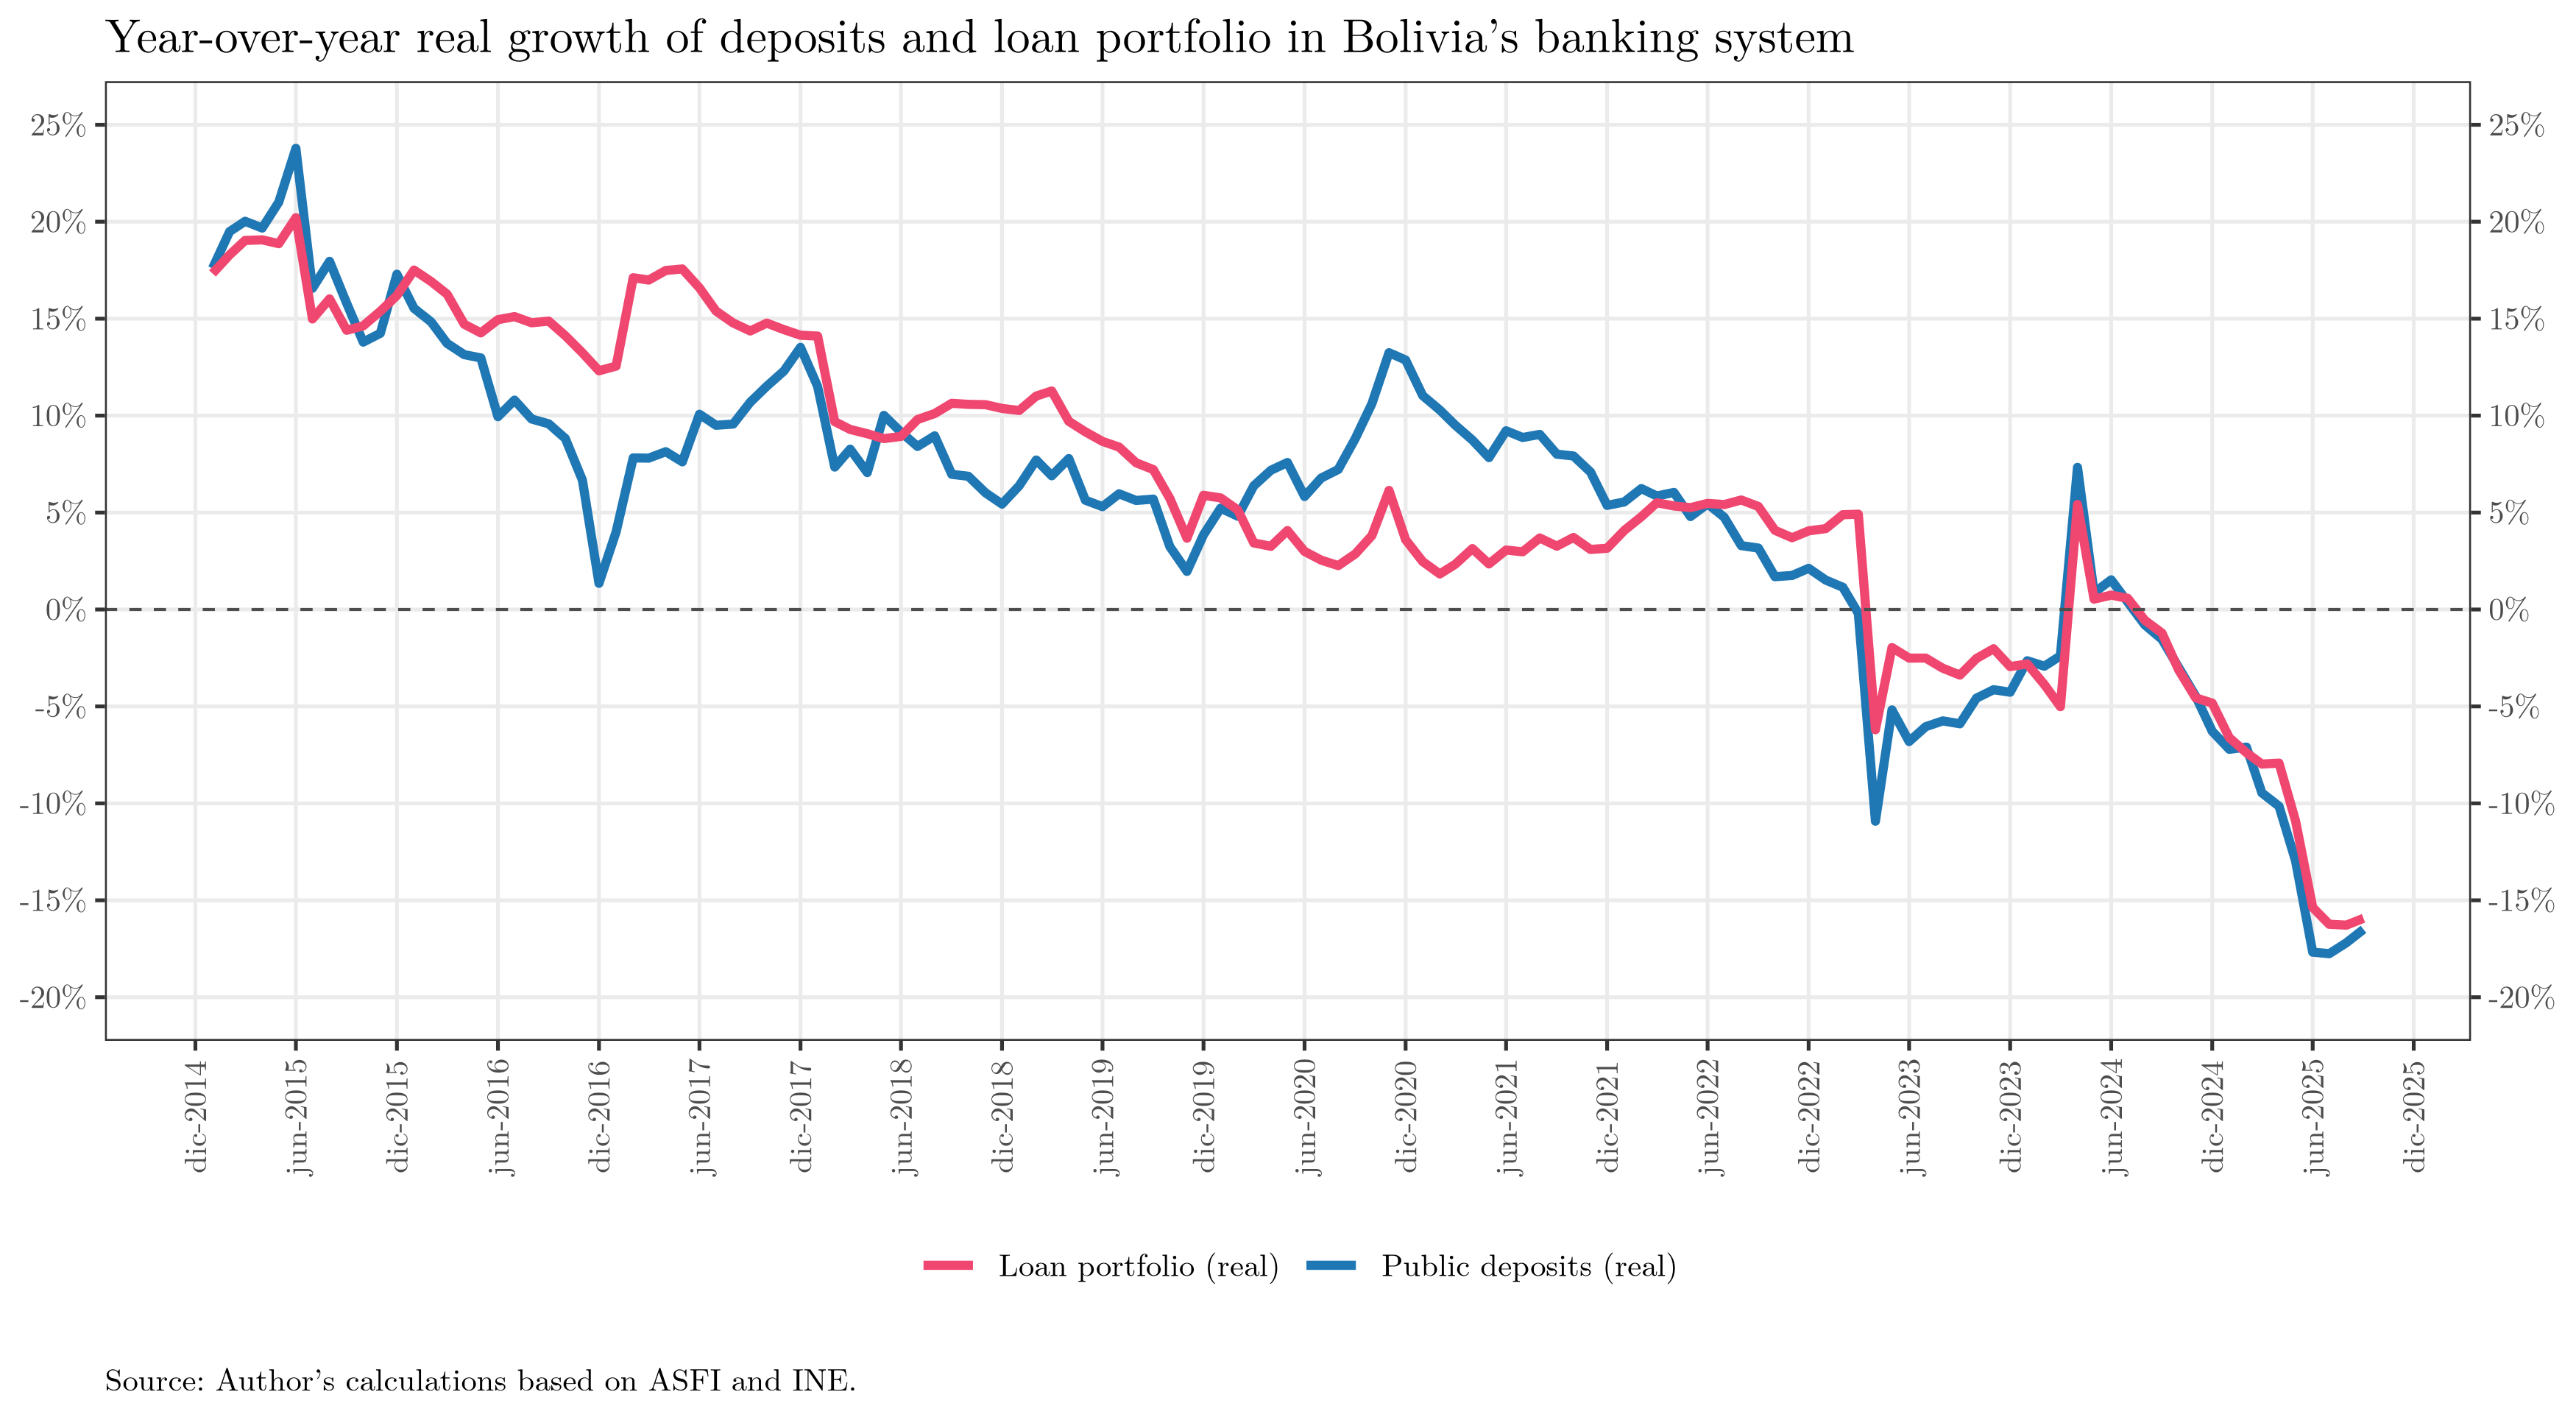
As a result, the banking sector faces a complex environment: inflation and weak economic growth hinder the financial intermediation process. Inflation erodes depositors’ incentives to save in local currency, while low growth reduces credit demand and loan repayment capacity. Adjusted for inflation, both credit portfolios and deposits have contracted sharply:
With this background in mind, let us now examine the financial statements of the Bolivian banking system. Although the figures are expressed in nominal terms and at the official exchange rate —which may give a misleading sense of stability— they must be interpreted in real terms after accounting for inflation.
General overview: The balance sheet
The balance sheet provides a snapshot of an institution’s financial position at a given point in time, showing the composition of its assets, liabilities, and equity.
In the case of the banking system, assets represent the resources in which banks have invested —loans granted, deposits in other financial institutions, and tangible assets such as buildings and equipment. Liabilities represent the obligations of banks, including customer deposits, interbank borrowings, and other funding sources. Finally, equity is the difference between assets and liabilities, representing the bank’s own resources.
Balance sheet structure
To give a clearer picture, the following chart summarizes the composition of the banking system’s balance sheet at three key points: the most recent month, the previous month, and the same month one year earlier. This allows an analysis of both annual and monthly structural changes.

As of September 2025, the balance sheet expanded by approximately USD 1.479 billion at the official rate —a 3.6% nominal increase. Compared to the previous quarter, the balance also grew, by USD 844 million.
The following table summarizes this growth:
| Classification | Account | % Change (12 months) | % Change (last month) |
|---|---|---|---|
| Assets | 110-Cash and equivalents | 7.4% | 4.8% |
| Assets | 120-Temporary investments | 3.5% | 3.7% |
| Assets | 130-Loan portfolio | 3.1% | 0.1% |
| Assets | 160-Permanent investments | −2.0% | 0.1% |
| Assets | 1XX-Other assets | 15.4% | 0.5% |
| Liabilities | 211-Current accounts | −3.7% | 6.9% |
| Liabilities | 212-Savings deposits | 9.8% | 2.4% |
| Liabilities | 213-Time deposits | 0.4% | −0.4% |
| Liabilities | 2XX-Other liabilities | 4.0% | −1.1% |
| Equity | 300-Capital | 11.6% | 1.6% |
Over the past year, the Bolivian banking system’s balance sheet shows a moderate expansion of assets, mainly driven by the increase in cash and equivalents (+7.4%) and in “other assets” (+15.4%). Temporary investments also rose (+3.5%), although slightly slower than the previous month, while loan portfolios maintained stable growth (+3.1%) and permanent investments continued to decline (−2.0%).
On the liabilities side, current accounts fell (−3.7%) while savings deposits grew (+9.8%), indicating a shift in the funding structure toward more stable instruments. Interestingly, given the inflationary environment, deposit behavior differs from what would typically be expected. Time deposits remained virtually unchanged (+0.4%), and bank equity grew significantly (+11.6%).
Currency composition
Another insightful perspective comes from distinguishing assets and liabilities denominated in local currency from those in foreign currency:
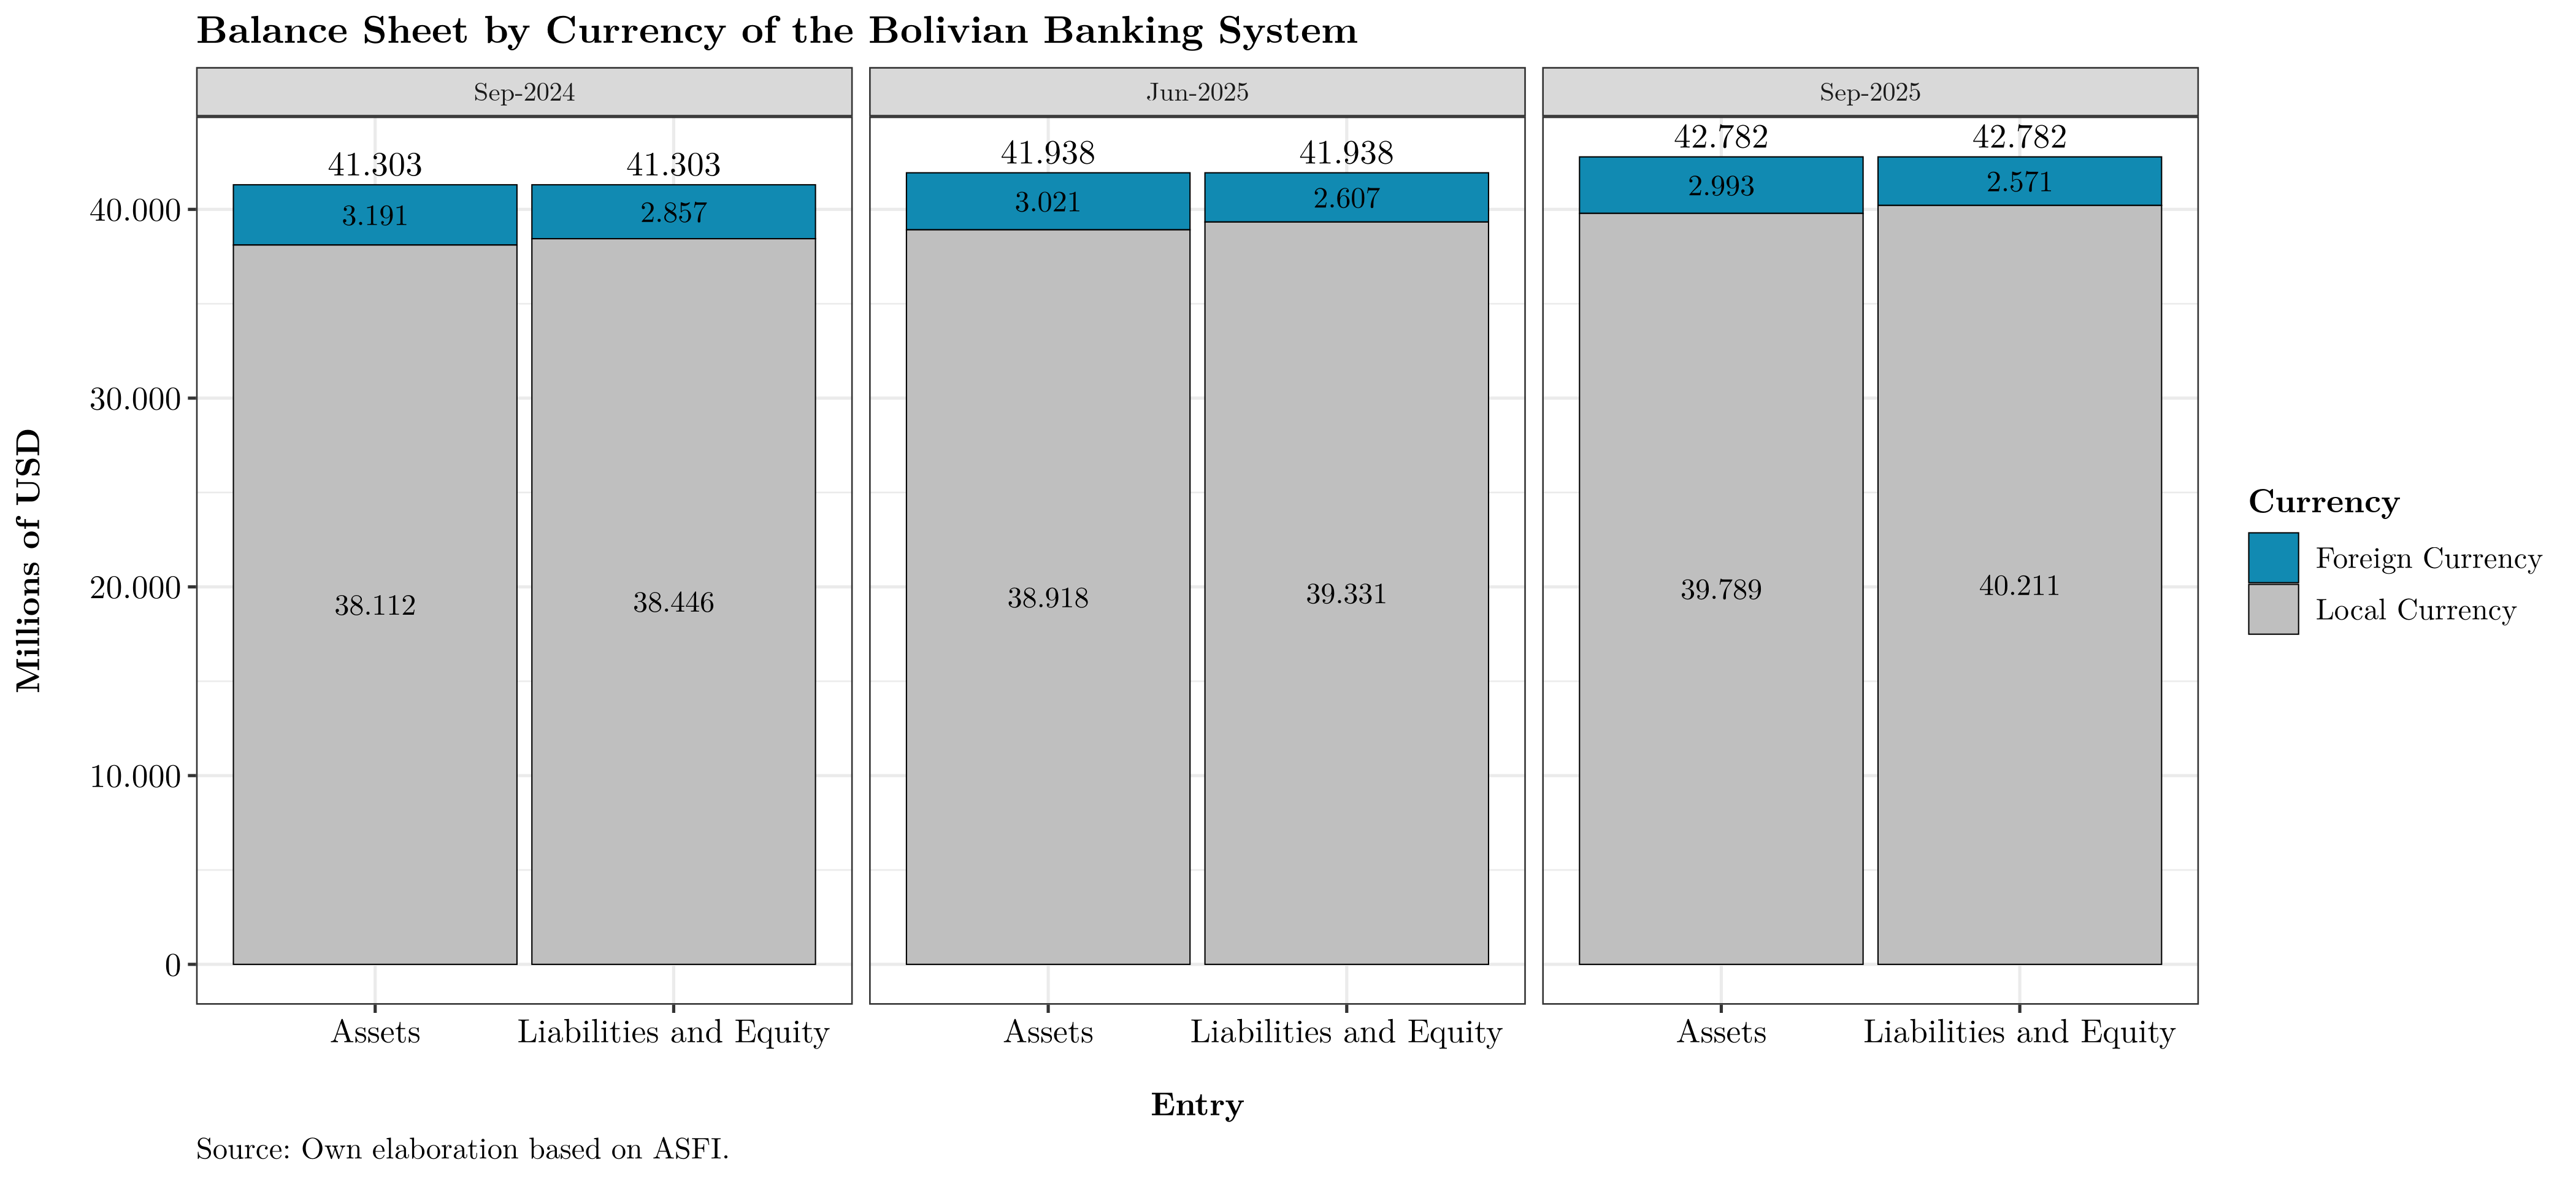
The chart shows the ongoing “de-dollarization” of the banking system. Over the past year, banks have repaid only about USD 286 million in foreign-currency liabilities. Although the sector remains “long” in foreign currency (more assets than liabilities), these assets are largely illiquid, as a substantial portion is held at the BCB —either as reserve requirements (classified as cash equivalents) or as contributions to various liquidity funds (CPVIS, FIUSEER, etc.), recorded as permanent investments.
This is illustrated in the next figure, which shows only the balances denominated in foreign currency:
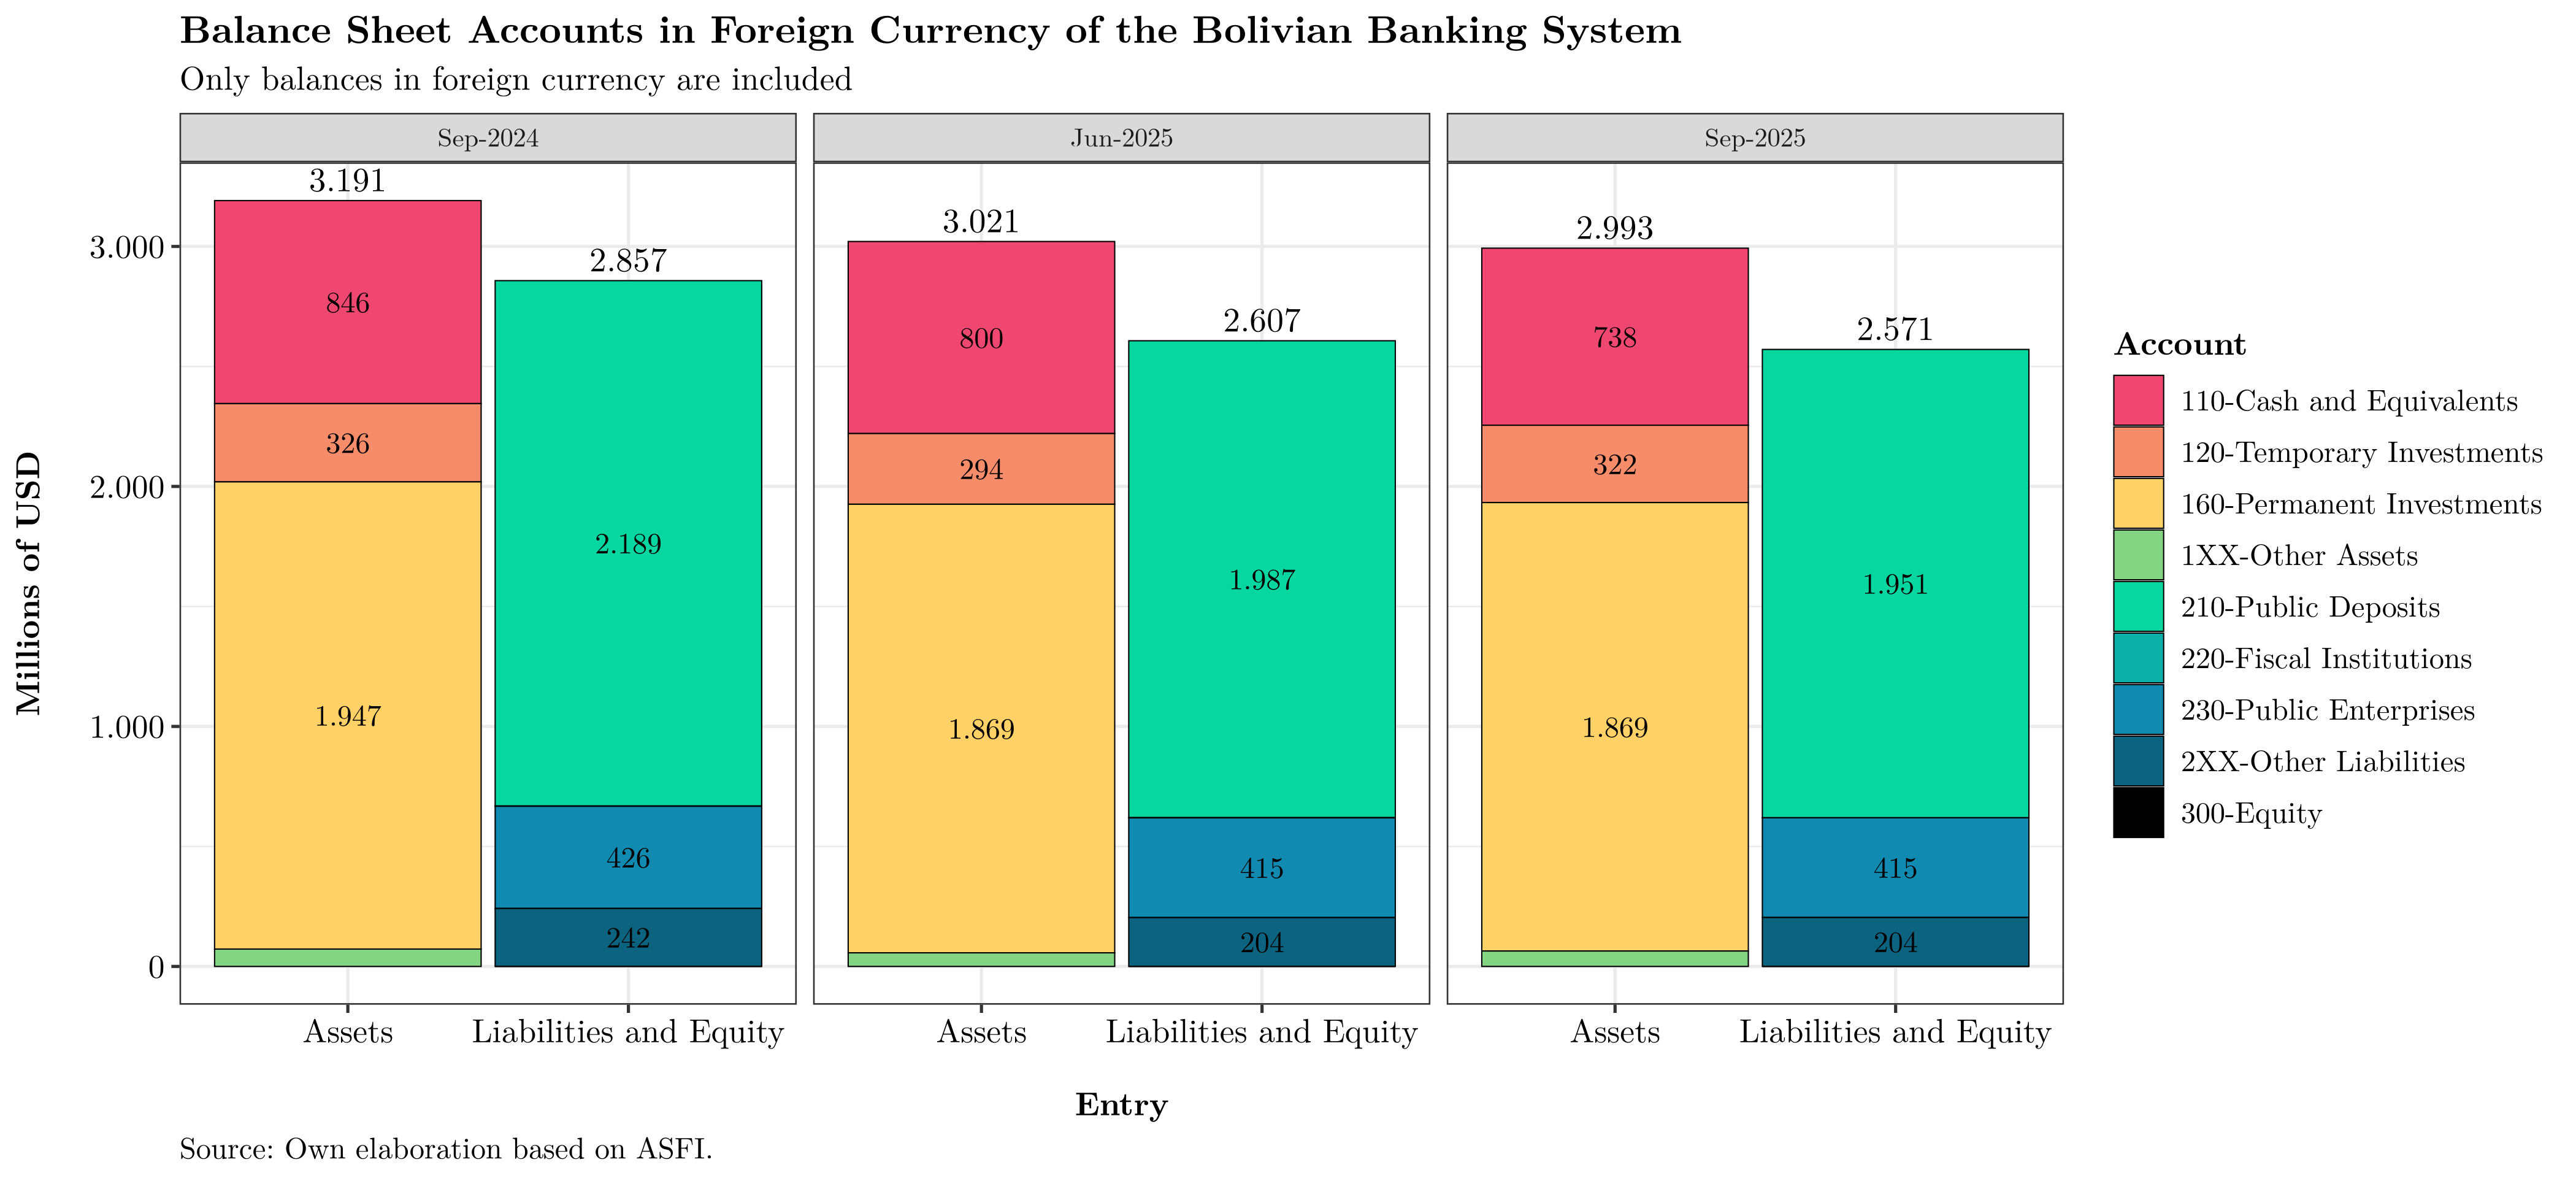
Most foreign-currency liabilities are public deposits (savings and current accounts), whereas assets are mainly permanent investments and cash equivalents. The permanent investments are largely USD deposits at the BCB, which —although declining— still represent a sizable share of foreign-currency assets. In practice, these funds are not freely available to banks because the BCB has not returned them.
Assets
Banks’ assets include cash in vaults and ATMs for daily operations, loans granted (portfolio), investments in financial instruments, and real estate used for operations. The loan portfolio remains the most important component, as it is the main source of income. Proper origination and management are crucial for the system’s stability.
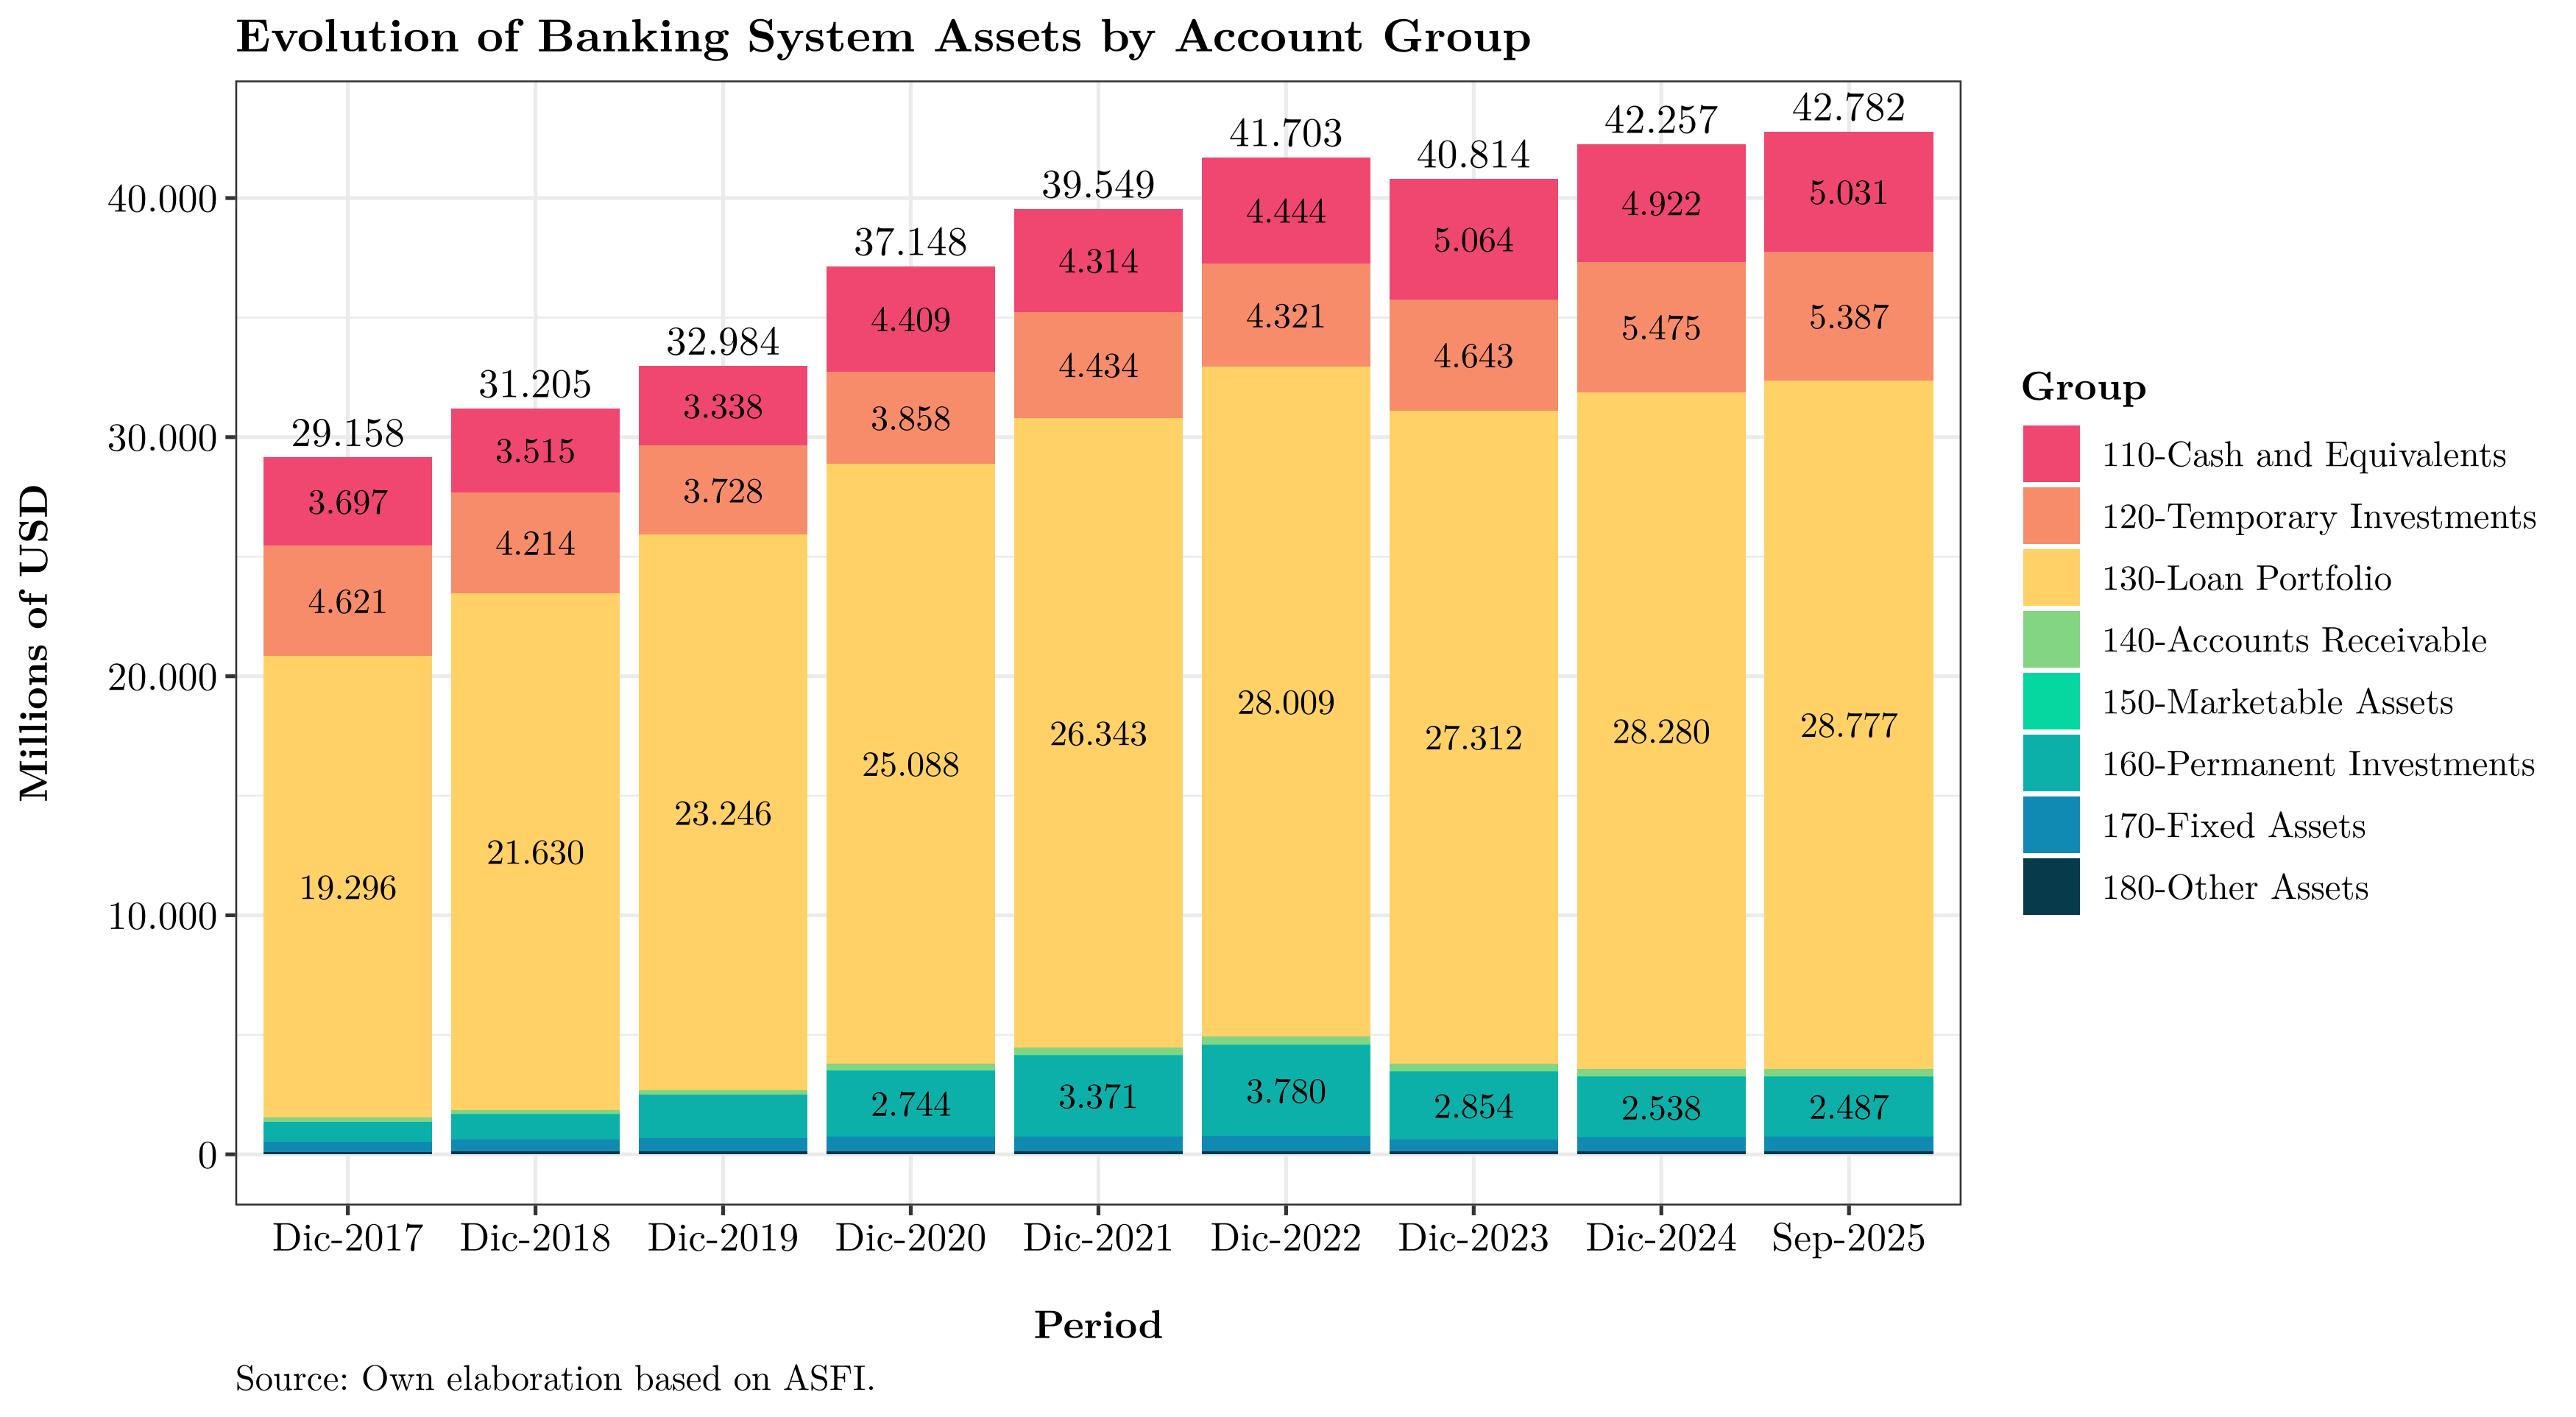
The next figure shows the evolution of banking system assets over time, highlighting significant growth but also some fluctuations. As noted earlier, there has been a growing preference for temporary investments over cash holdings:
By institution:
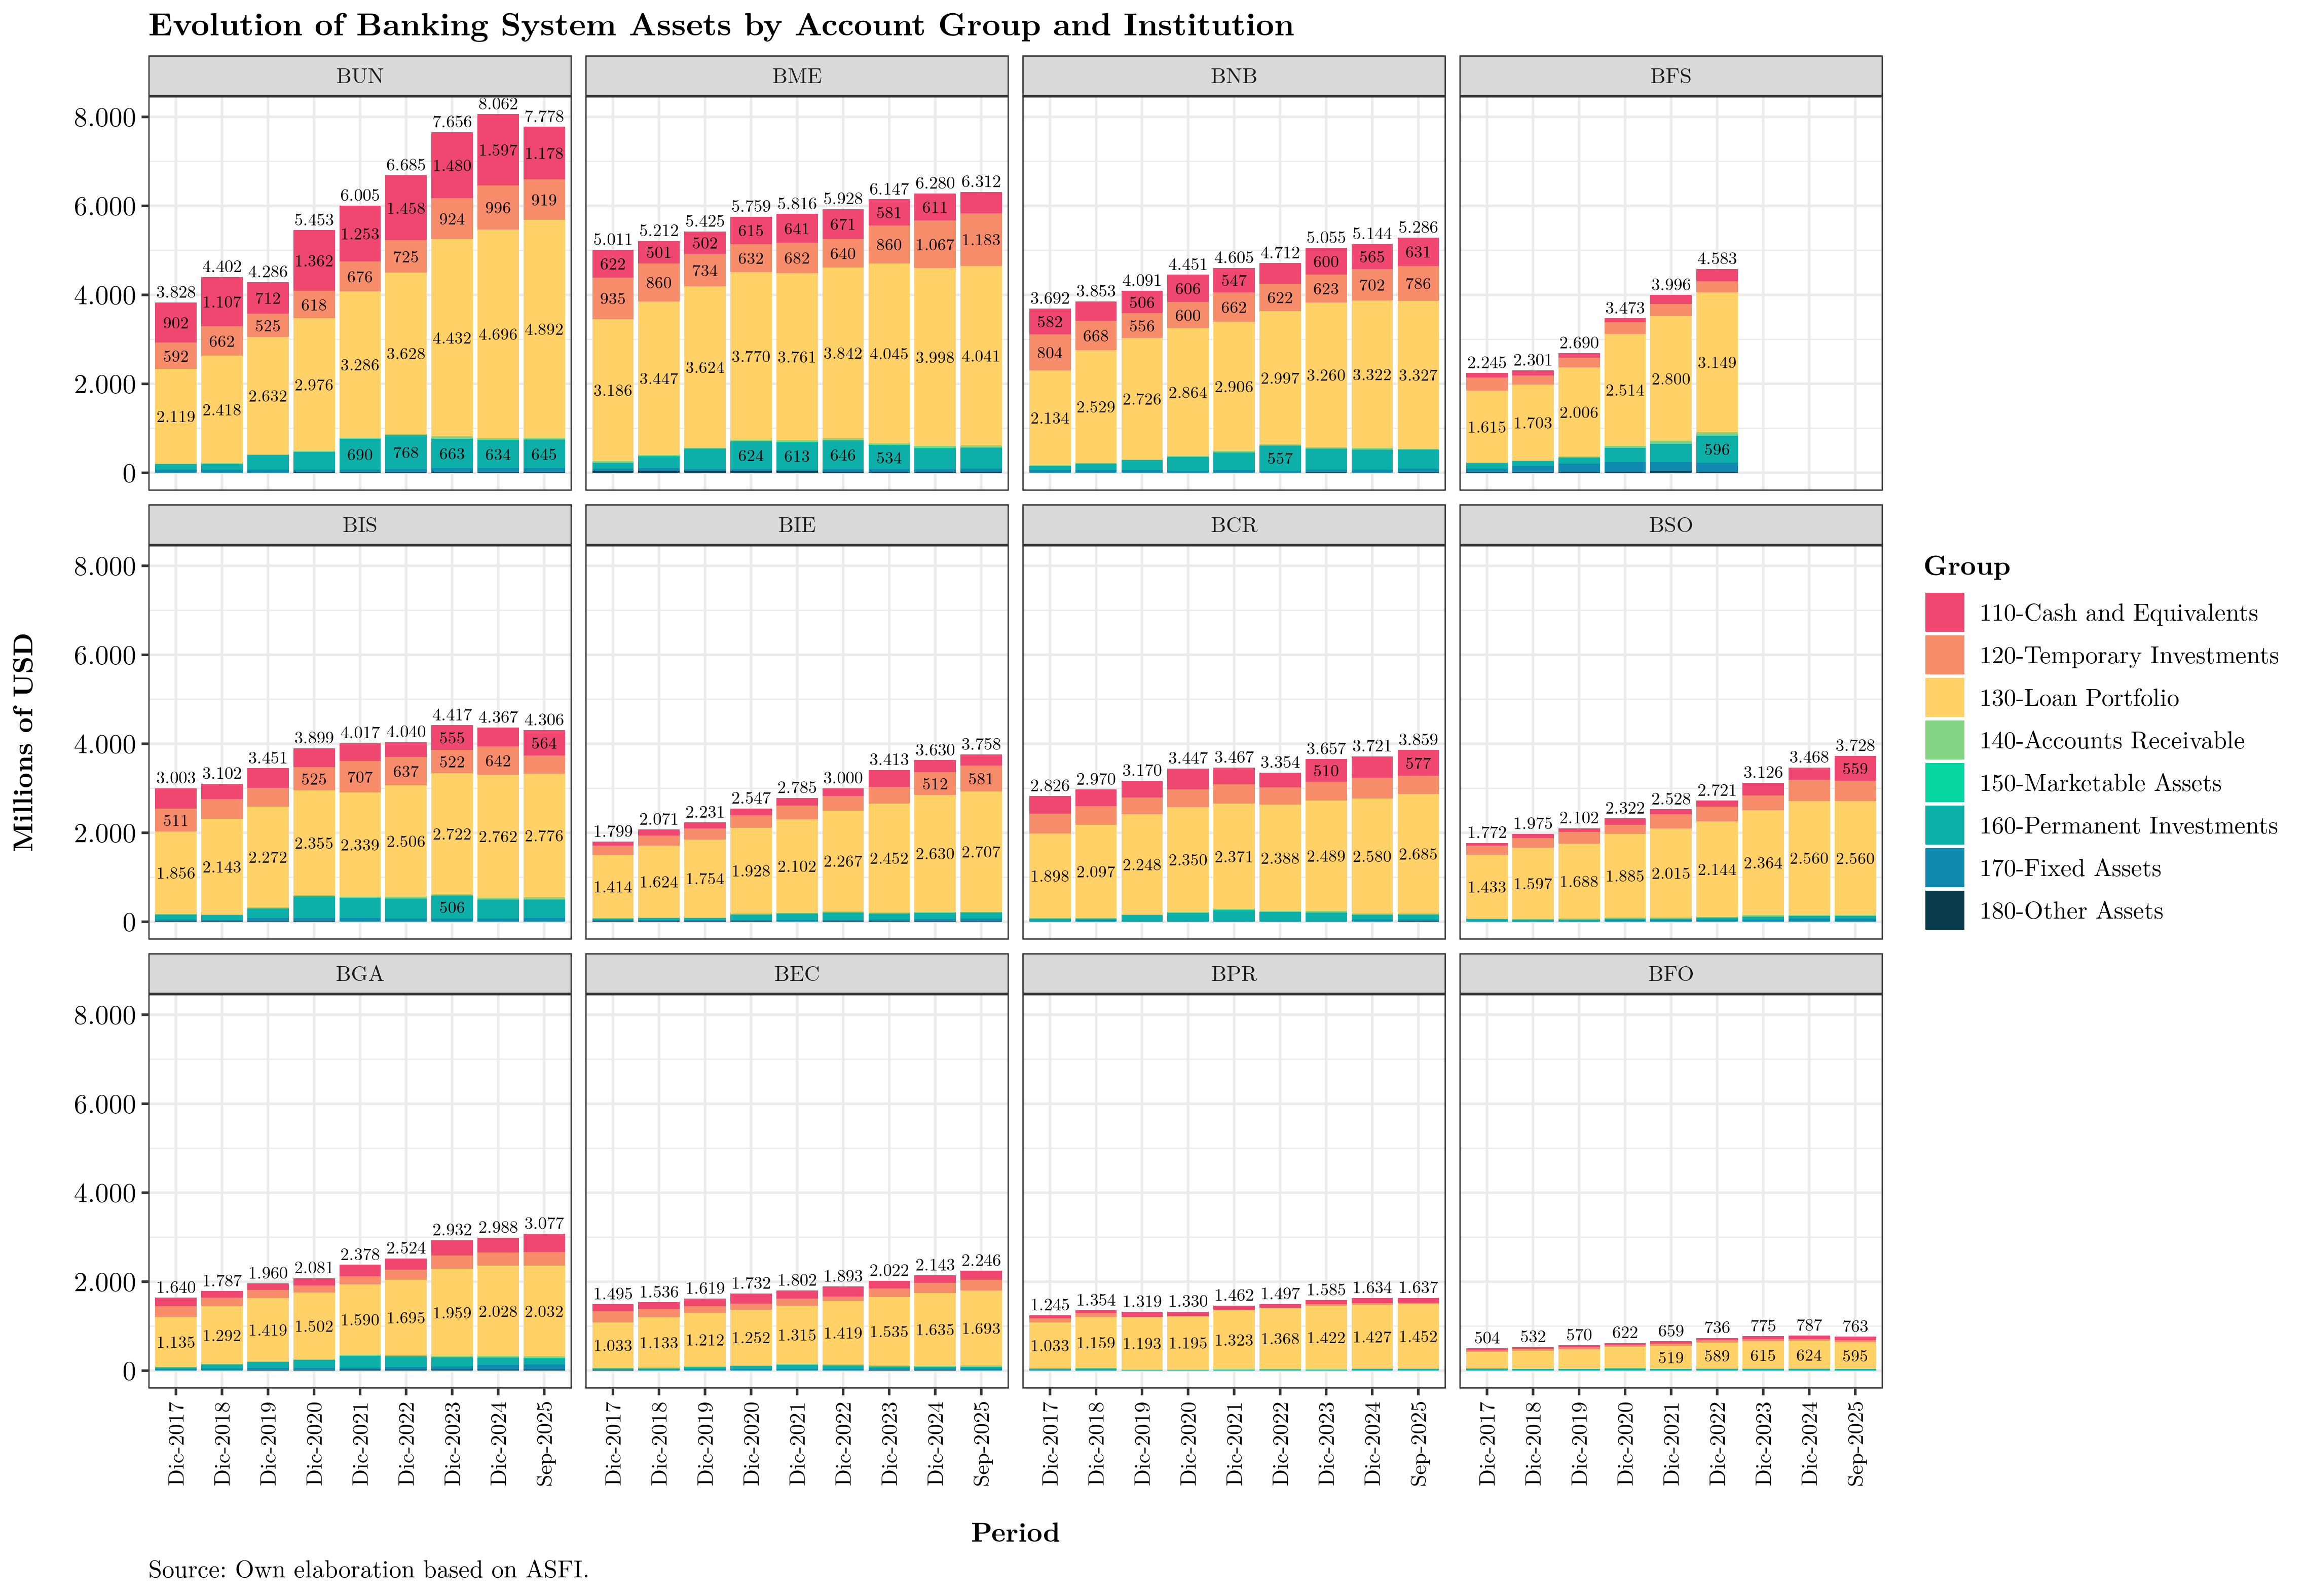
The data reveal a notable decline in Banco Unión’s assets since December 2024, particularly in cash and equivalents.
Contribution to growth
Another way to analyze assets is by looking at the contribution (incidence) of each balance-sheet group to year-over-year asset growth. This helps identify which groups are driving overall expansion and which are offsetting it. The figure below shows the evolution of each group’s contribution since January 2022:
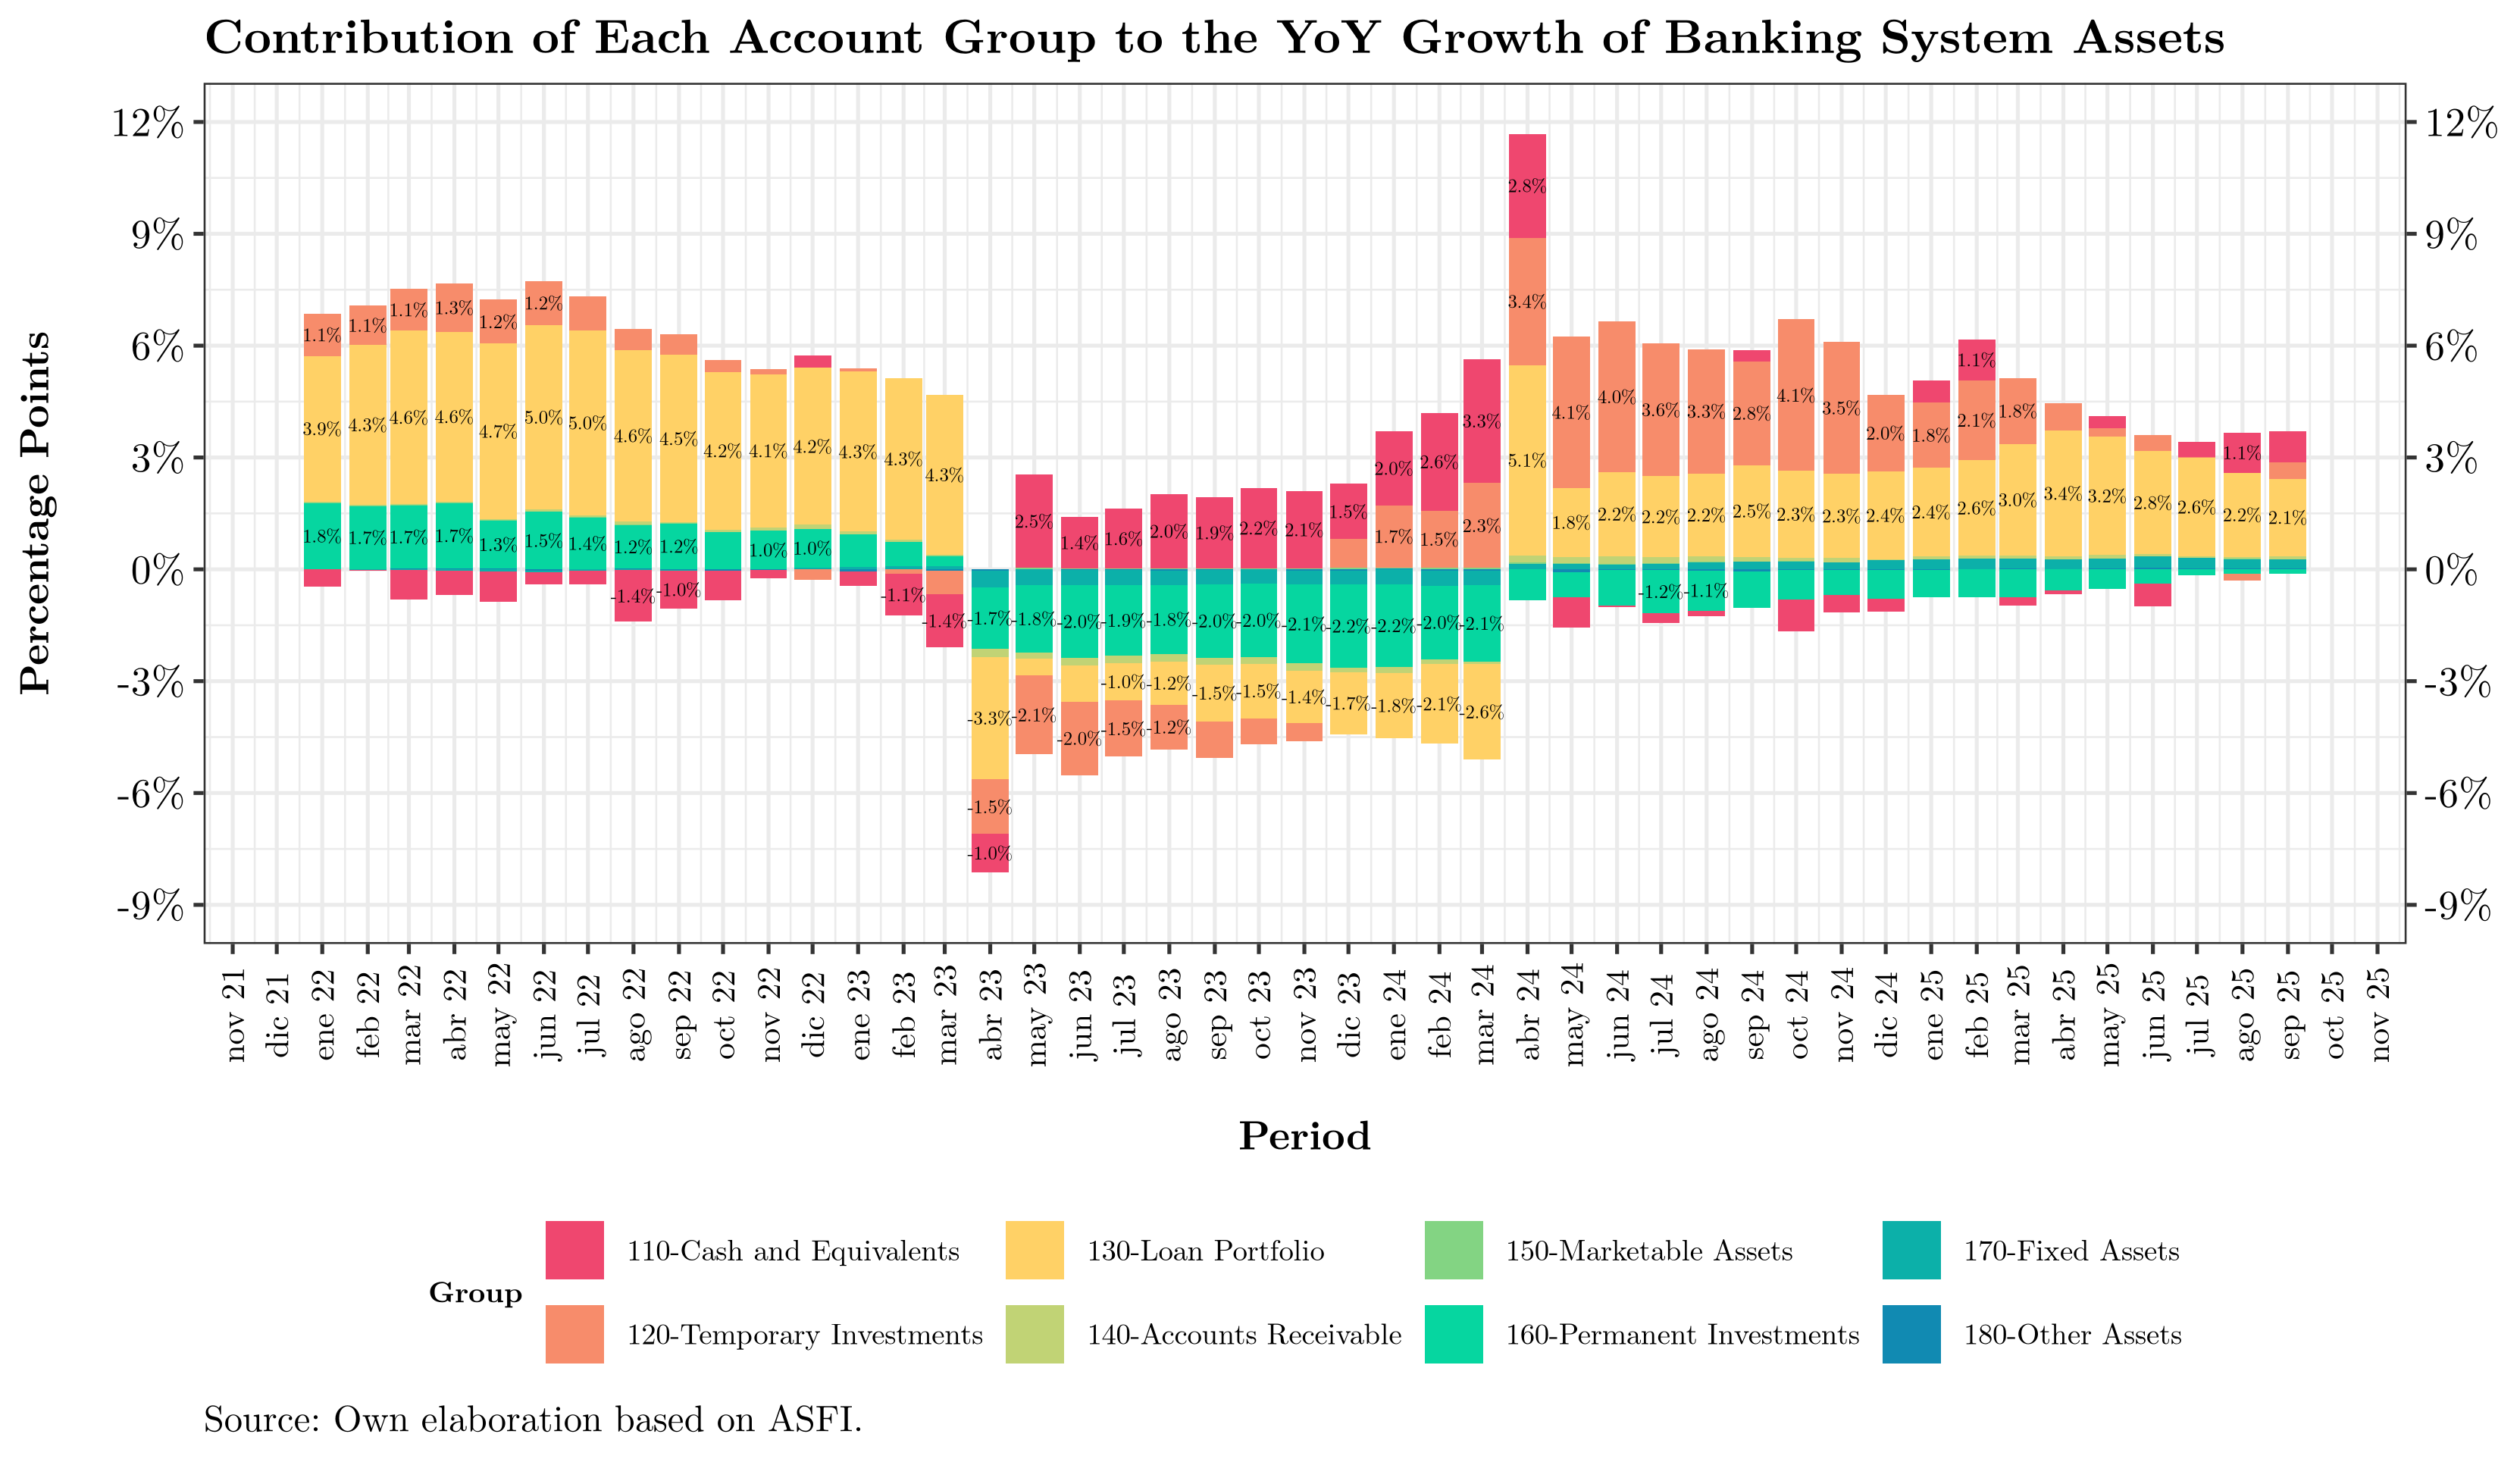
The chart can be read as follows. For example, between September 2024 and September 2025, total banking system assets expanded by 3.6%, which can be decomposed across balance-sheet groups as follows:
| Balance-sheet group | Contribution |
|---|---|
| 110-Cash and equivalents | 0.8% |
| 120-Temporary investments | 0.4% |
| 130-Loan portfolio | 2.1% |
| 140-Accounts receivable | 0.1% |
| 150-Marketable assets | 0.0% |
| 160-Permanent investments | -0.1% |
| 170-Fixed assets | 0.2% |
| 180-Other assets | 0.0% |
| Total | 3.6% |
What can we infer from this? First, prior to March 2023, loan portfolio growth was the main driver of asset expansion, with a clear preference for loans over cash holdings. Temporary investments were also increasing, albeit to a lesser extent. From March 2023 onward, the trend changed: the loan portfolio and permanent investments began to contract, while cash and then temporary investments took the lead. As mentioned earlier, this reflects the materialization of macroeconomic risks in Bolivia—chiefly the unsustainable exchange-rate regime amid sharply declining international reserves at the BCB, culminating in the failure of Banco Fassil.
Notably, as the symptoms of the crisis intensified, banks prioritized short-term returns via temporary investments. While the loan book still grows, it does so at a much slower pace. In other words, given the macro backdrop, banks are increasingly emphasizing short-term profitability—especially as the BCB has been draining liquidity (offsetting fiscal deficit financing) by issuing higher-yielding securities.
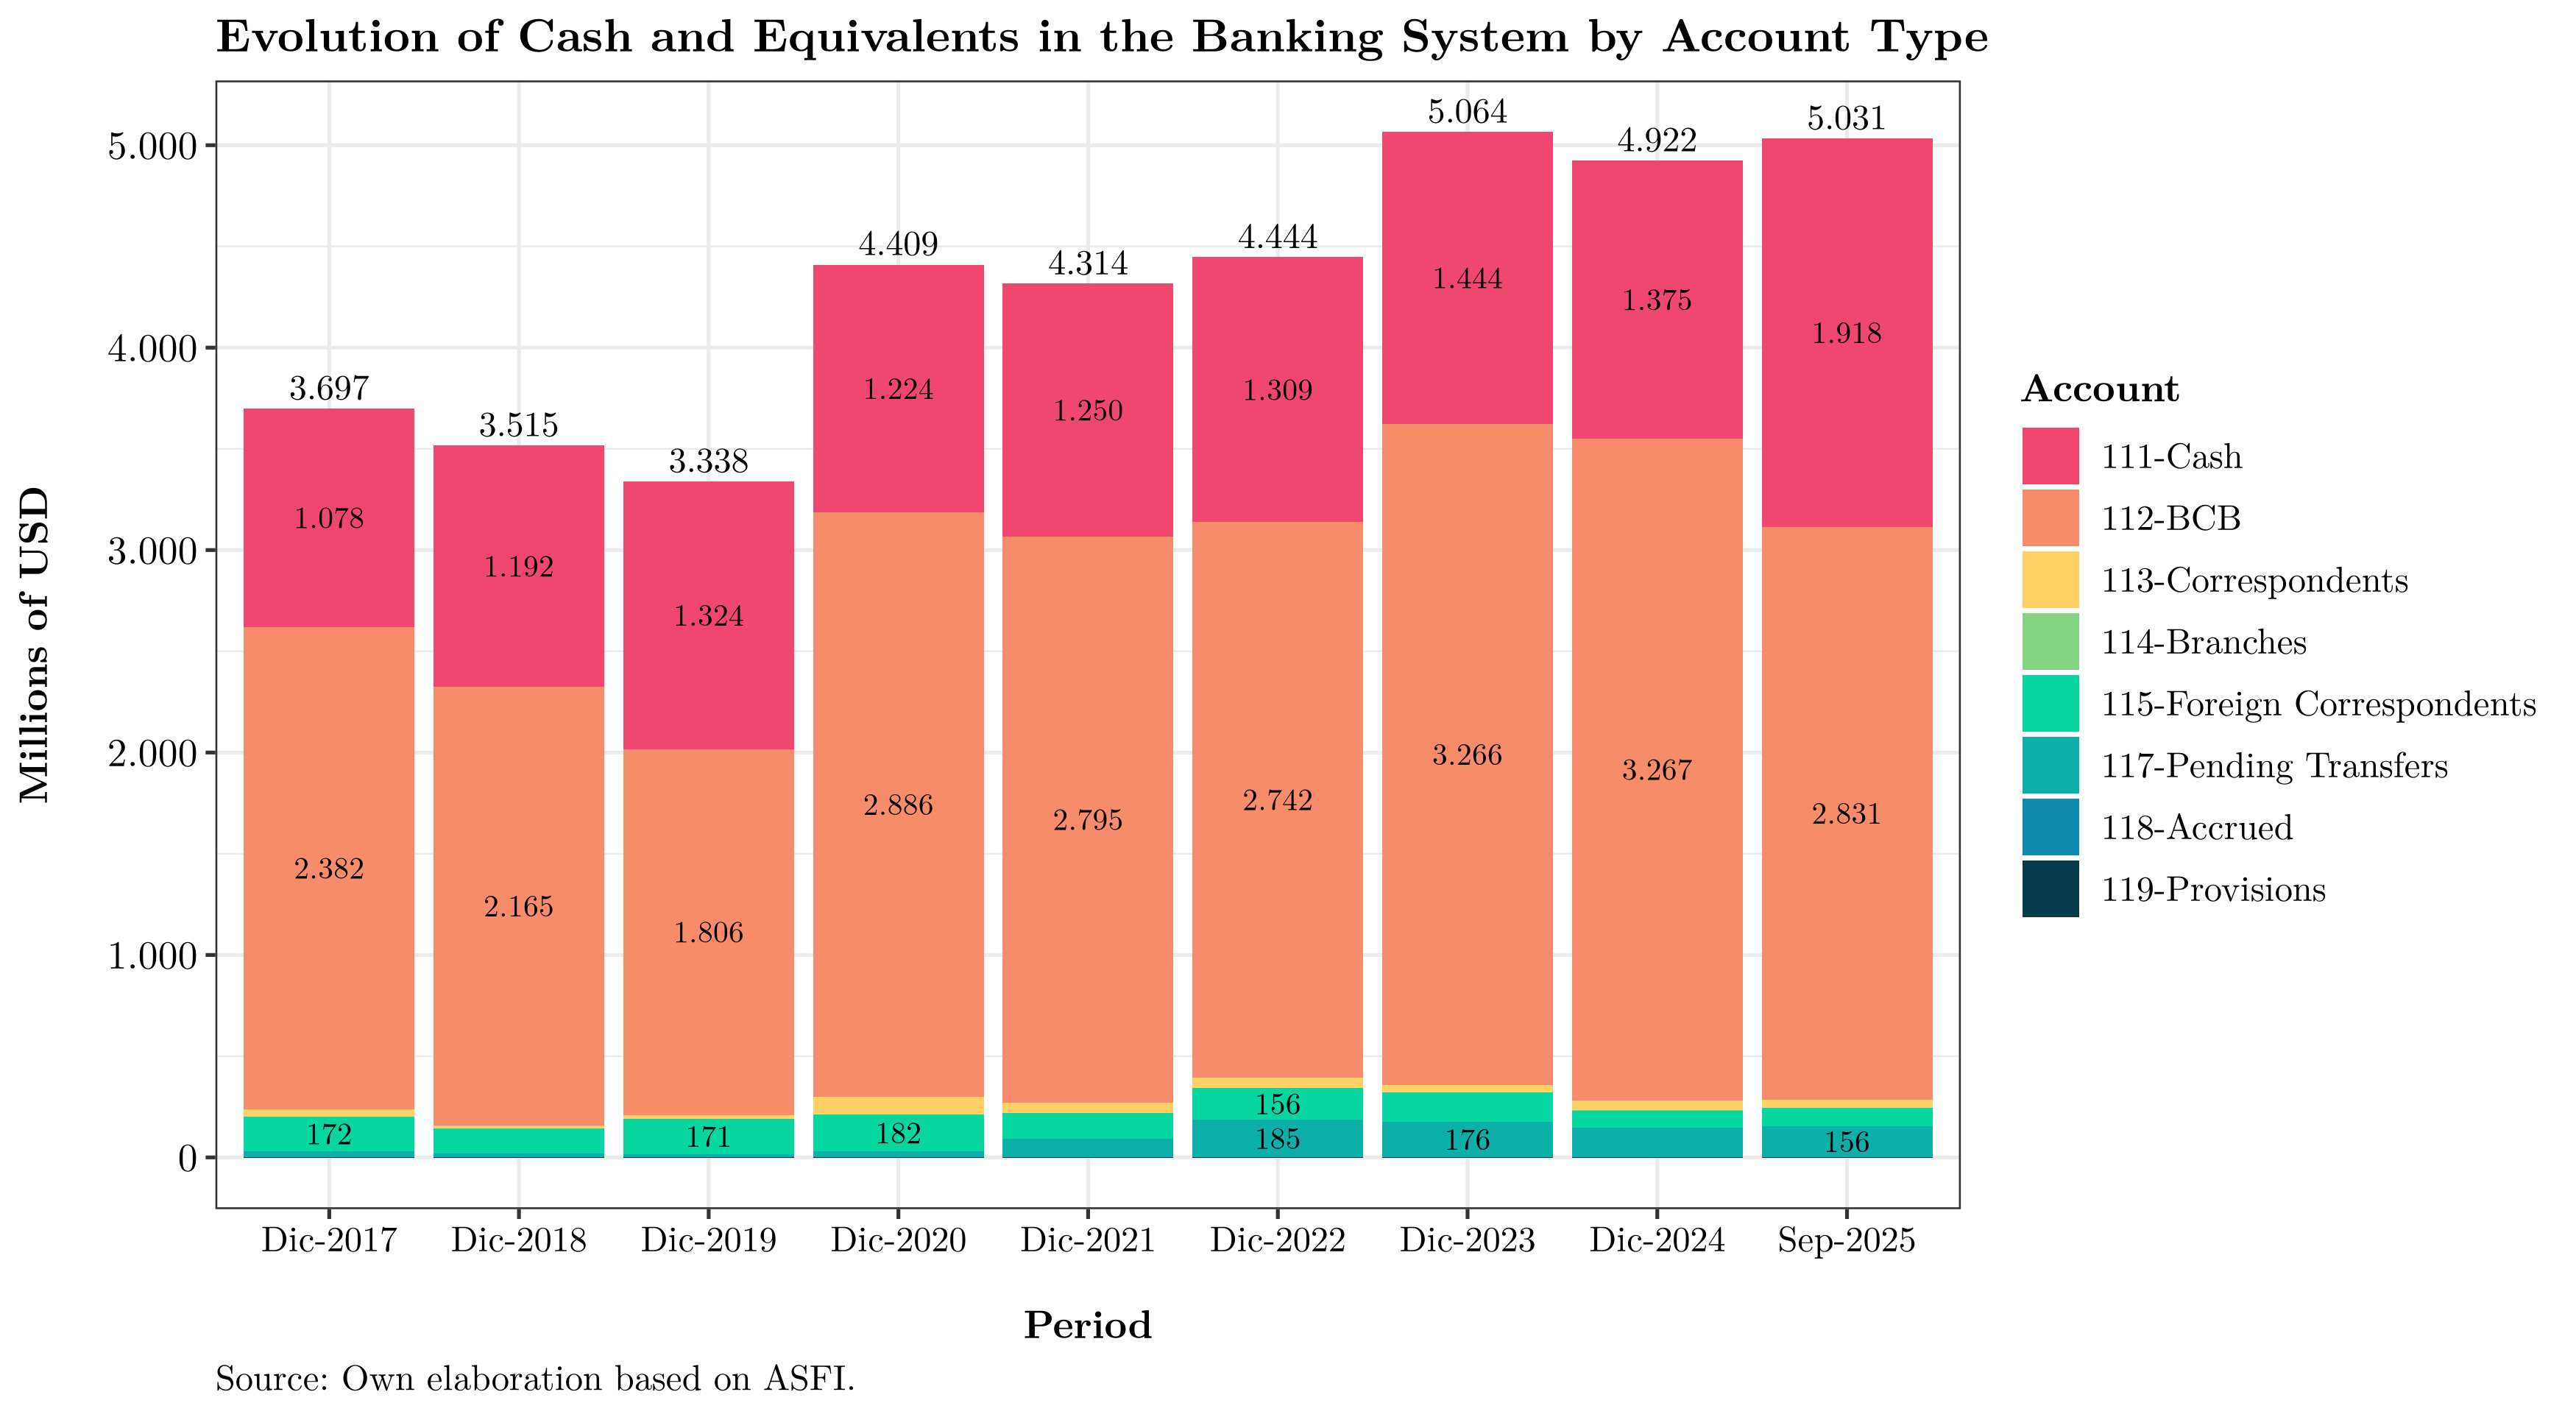
Cash and equivalents
As defined in the Chart of Accounts for Financial Institutions, cash and equivalents are:
“The cash held by the entity in vault, sight balances at the Central Bank of Bolivia, in the head office and foreign branches, and in domestic and foreign banks and correspondent banks; as well as holdings of precious metals. It also includes checks, other immediately collectible commercial documents, and electronic payment orders pending settlement.”
Note that, although a detailed treatment is beyond the scope of this piece, the BCB’s reserve requirement regulation applies to banks’ liquid assets. Institutions must “encash” a percentage of received deposits at the BCB. Thus, regulation compels banks to hold a minimum level of liquid assets in proportion to their deposit base.
Composition
As shown below, system-wide cash and equivalents have remained relatively stable around USD 4.0 billion, of which roughly 30% is held in physical cash to support daily operations (withdrawals, ATMs, etc.). Compared with December 2022, these balances have risen slightly, approaching USD 5.0 billion.
By institution:
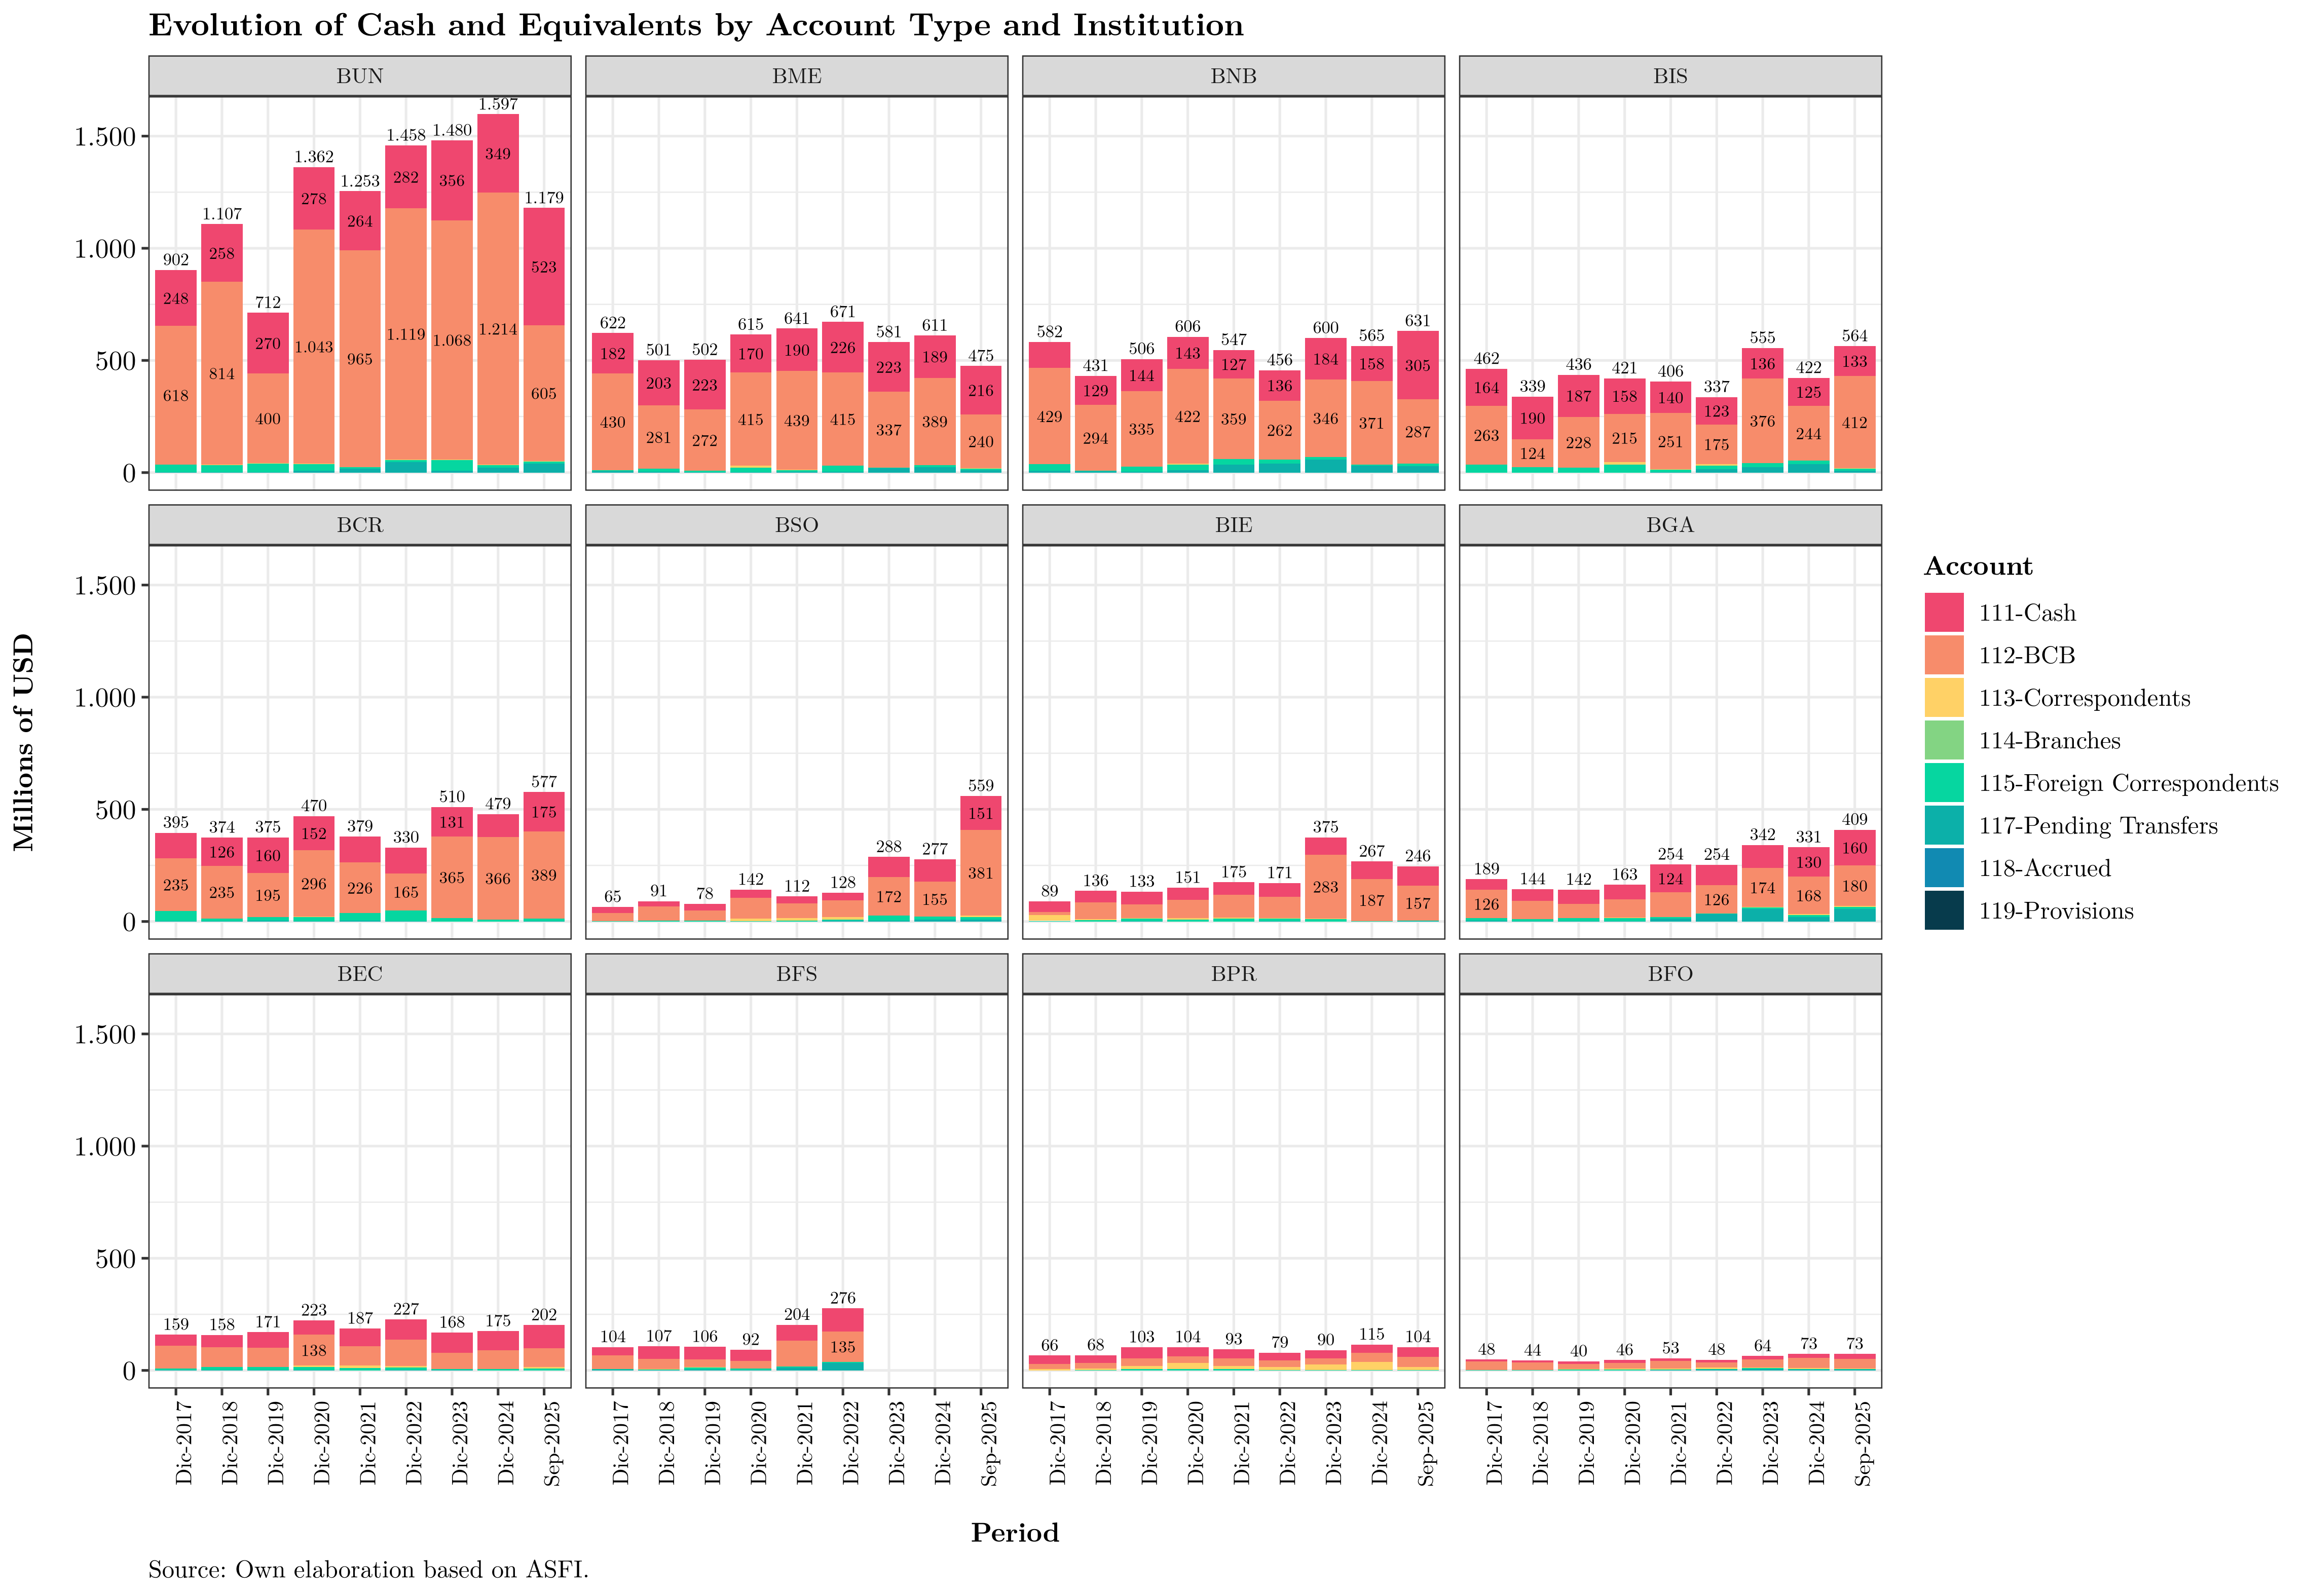
Banco Unión appears to have experienced the largest reduction in cash and equivalents (−54% year-to-date), though Banco Mercantil and Banco Bisa have also seen declines since December 2024.
By currency
Given the aforementioned fall in international reserves and the resulting scarcity of foreign currency in the economy, foreign-currency cash balances would be expected to decline—precisely what the next chart shows:

Temporary investments
According to ASFI’s Chart of Accounts, temporary investments are:
“Investments in deposits at other ‘financial intermediation entities,’ deposits at the Central Bank of Bolivia, and debt securities acquired by the entity; investments made, per the investment policy, with the intention of obtaining an adequate return on temporary liquidity surpluses and that can be converted into cash within no more than thirty (30) days.”
Details follow.
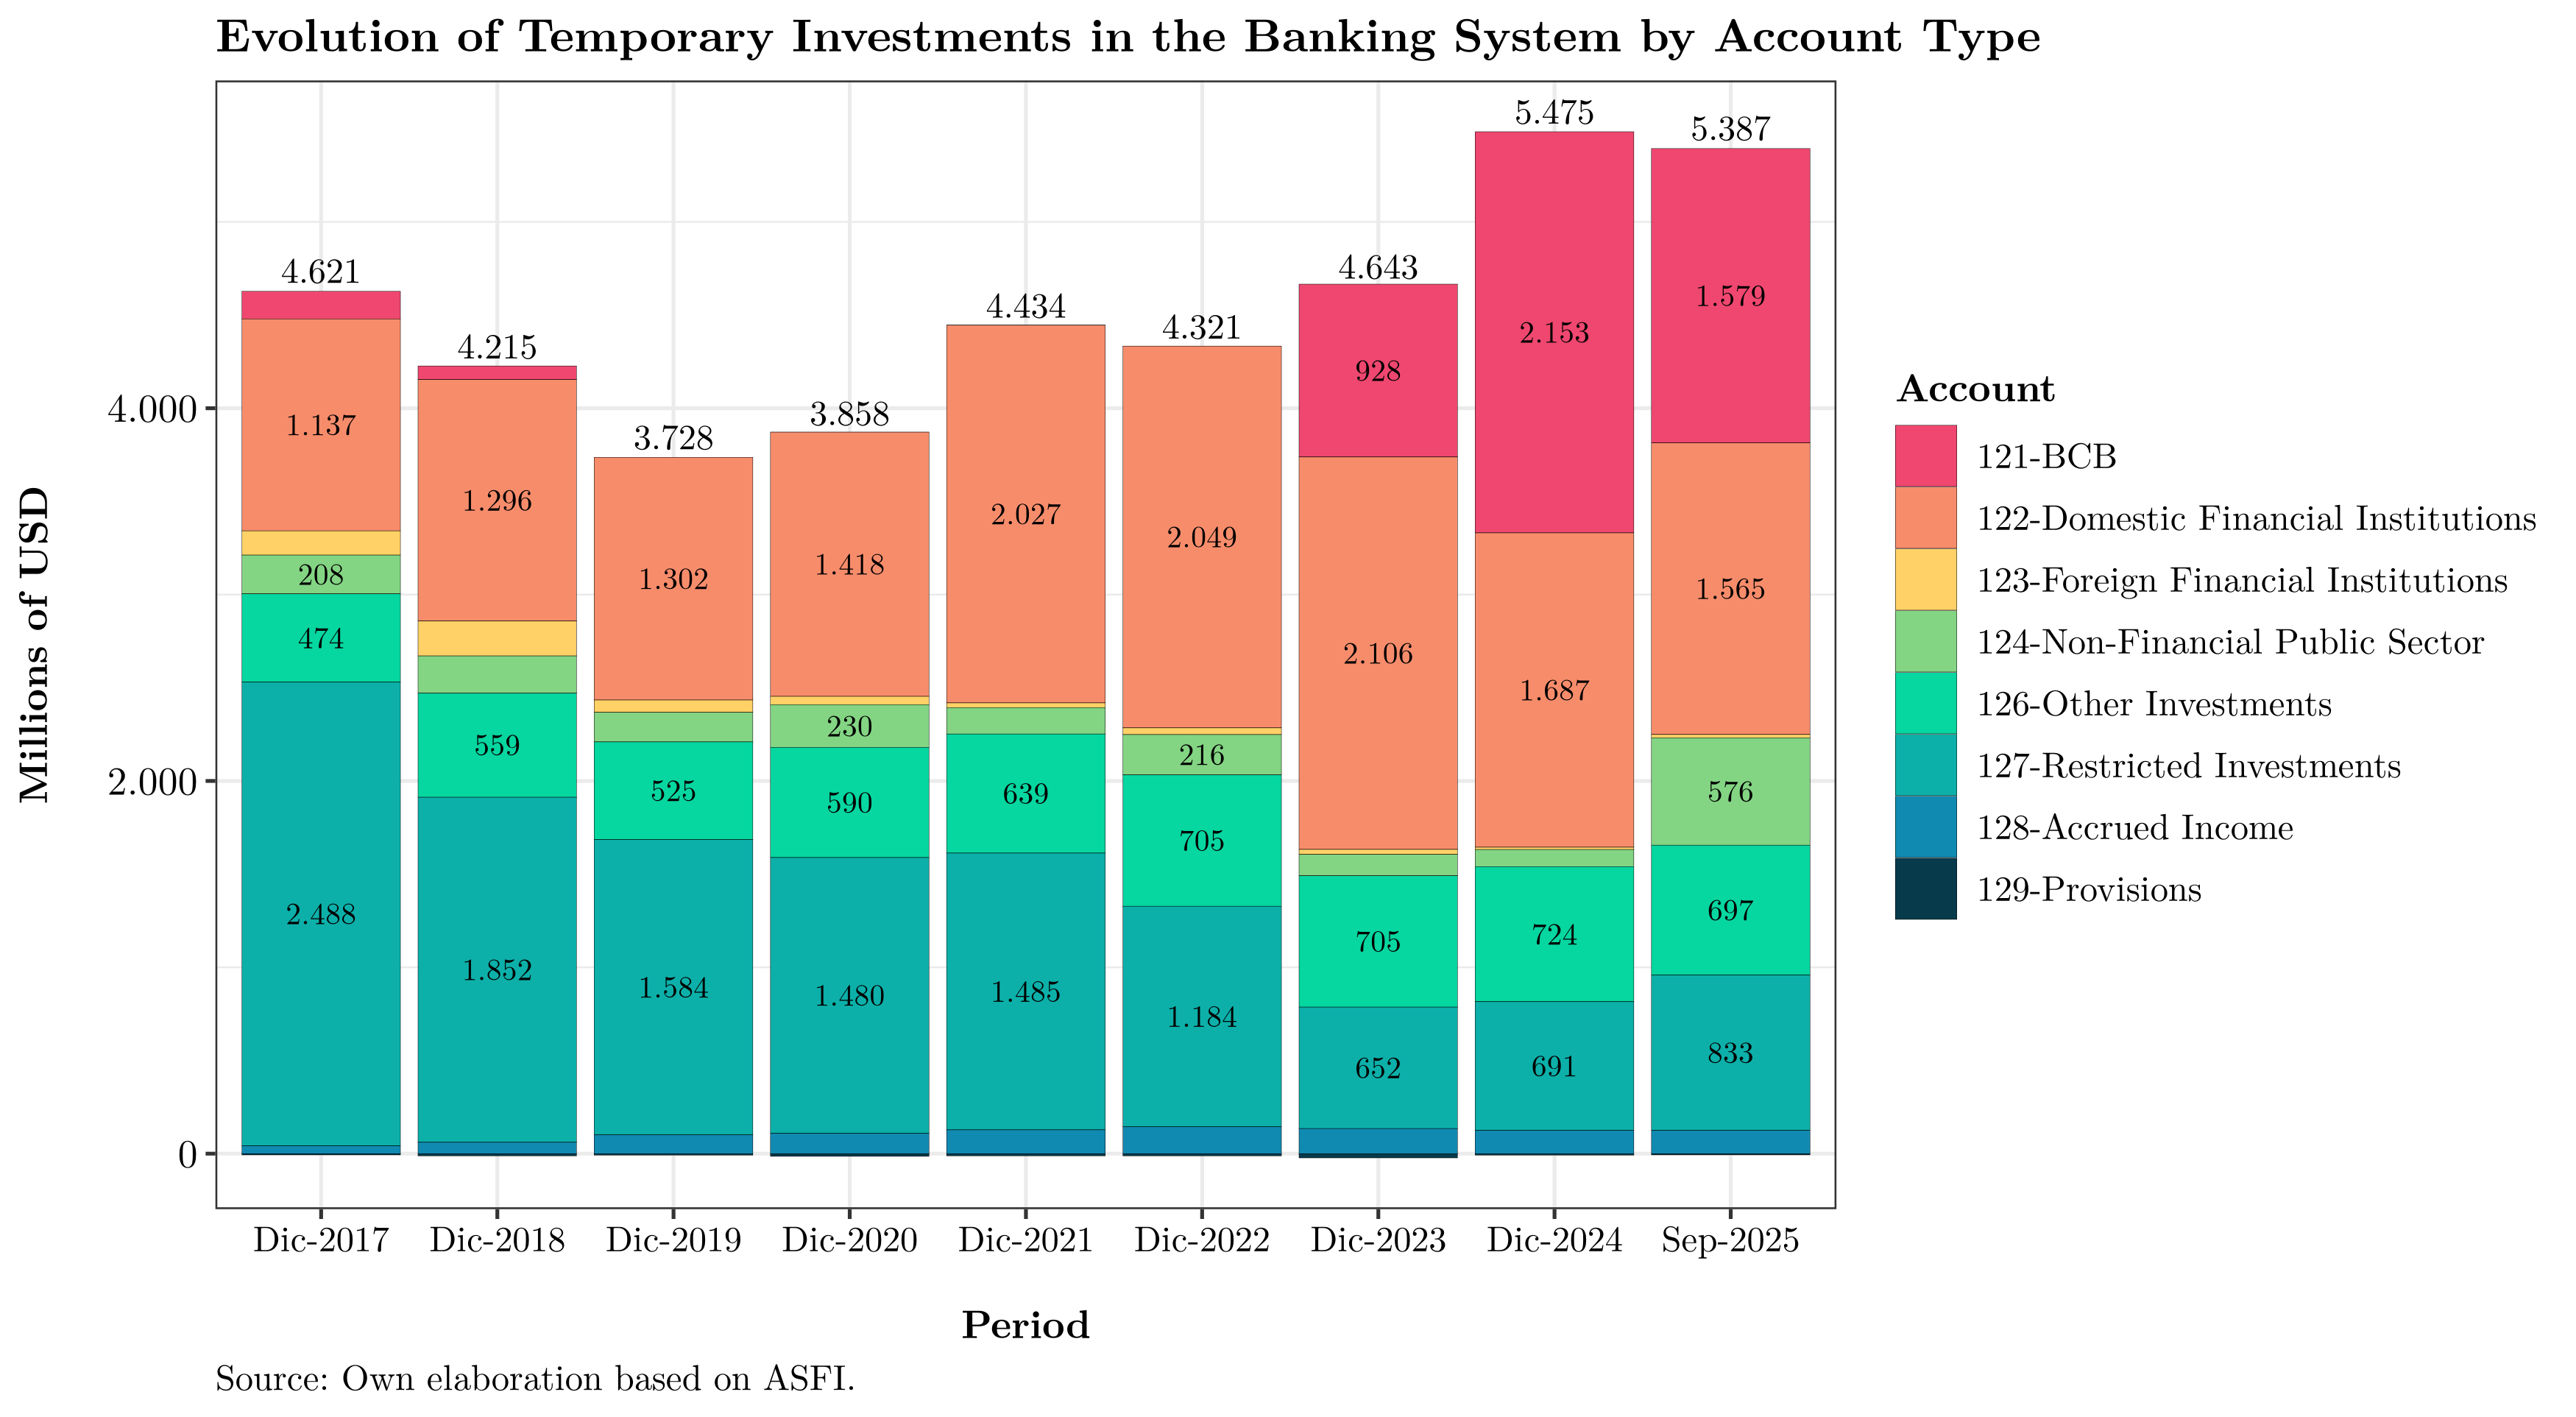
Composition
The next figure shows the composition of temporary investments at year-end and at the latest available month. As noted, exposure to BCB instruments increased markedly from December 2023 but had decreased to USD 1.579 billion by September 2025. This decline is offset by growth in account 124 (investments in debt securities issued by domestic non-financial public entities—TGN bills/bonds, etc.) and account 127 (restricted-availability investments, chiefly repos to be repurchased at a set date). These securities typically originate from the BCB or the TGN, among others.
Given the sharp, historically high increase, the next figure breaks down account 124 (investments in the non-financial public sector, NFPS) into its sub-accounts:
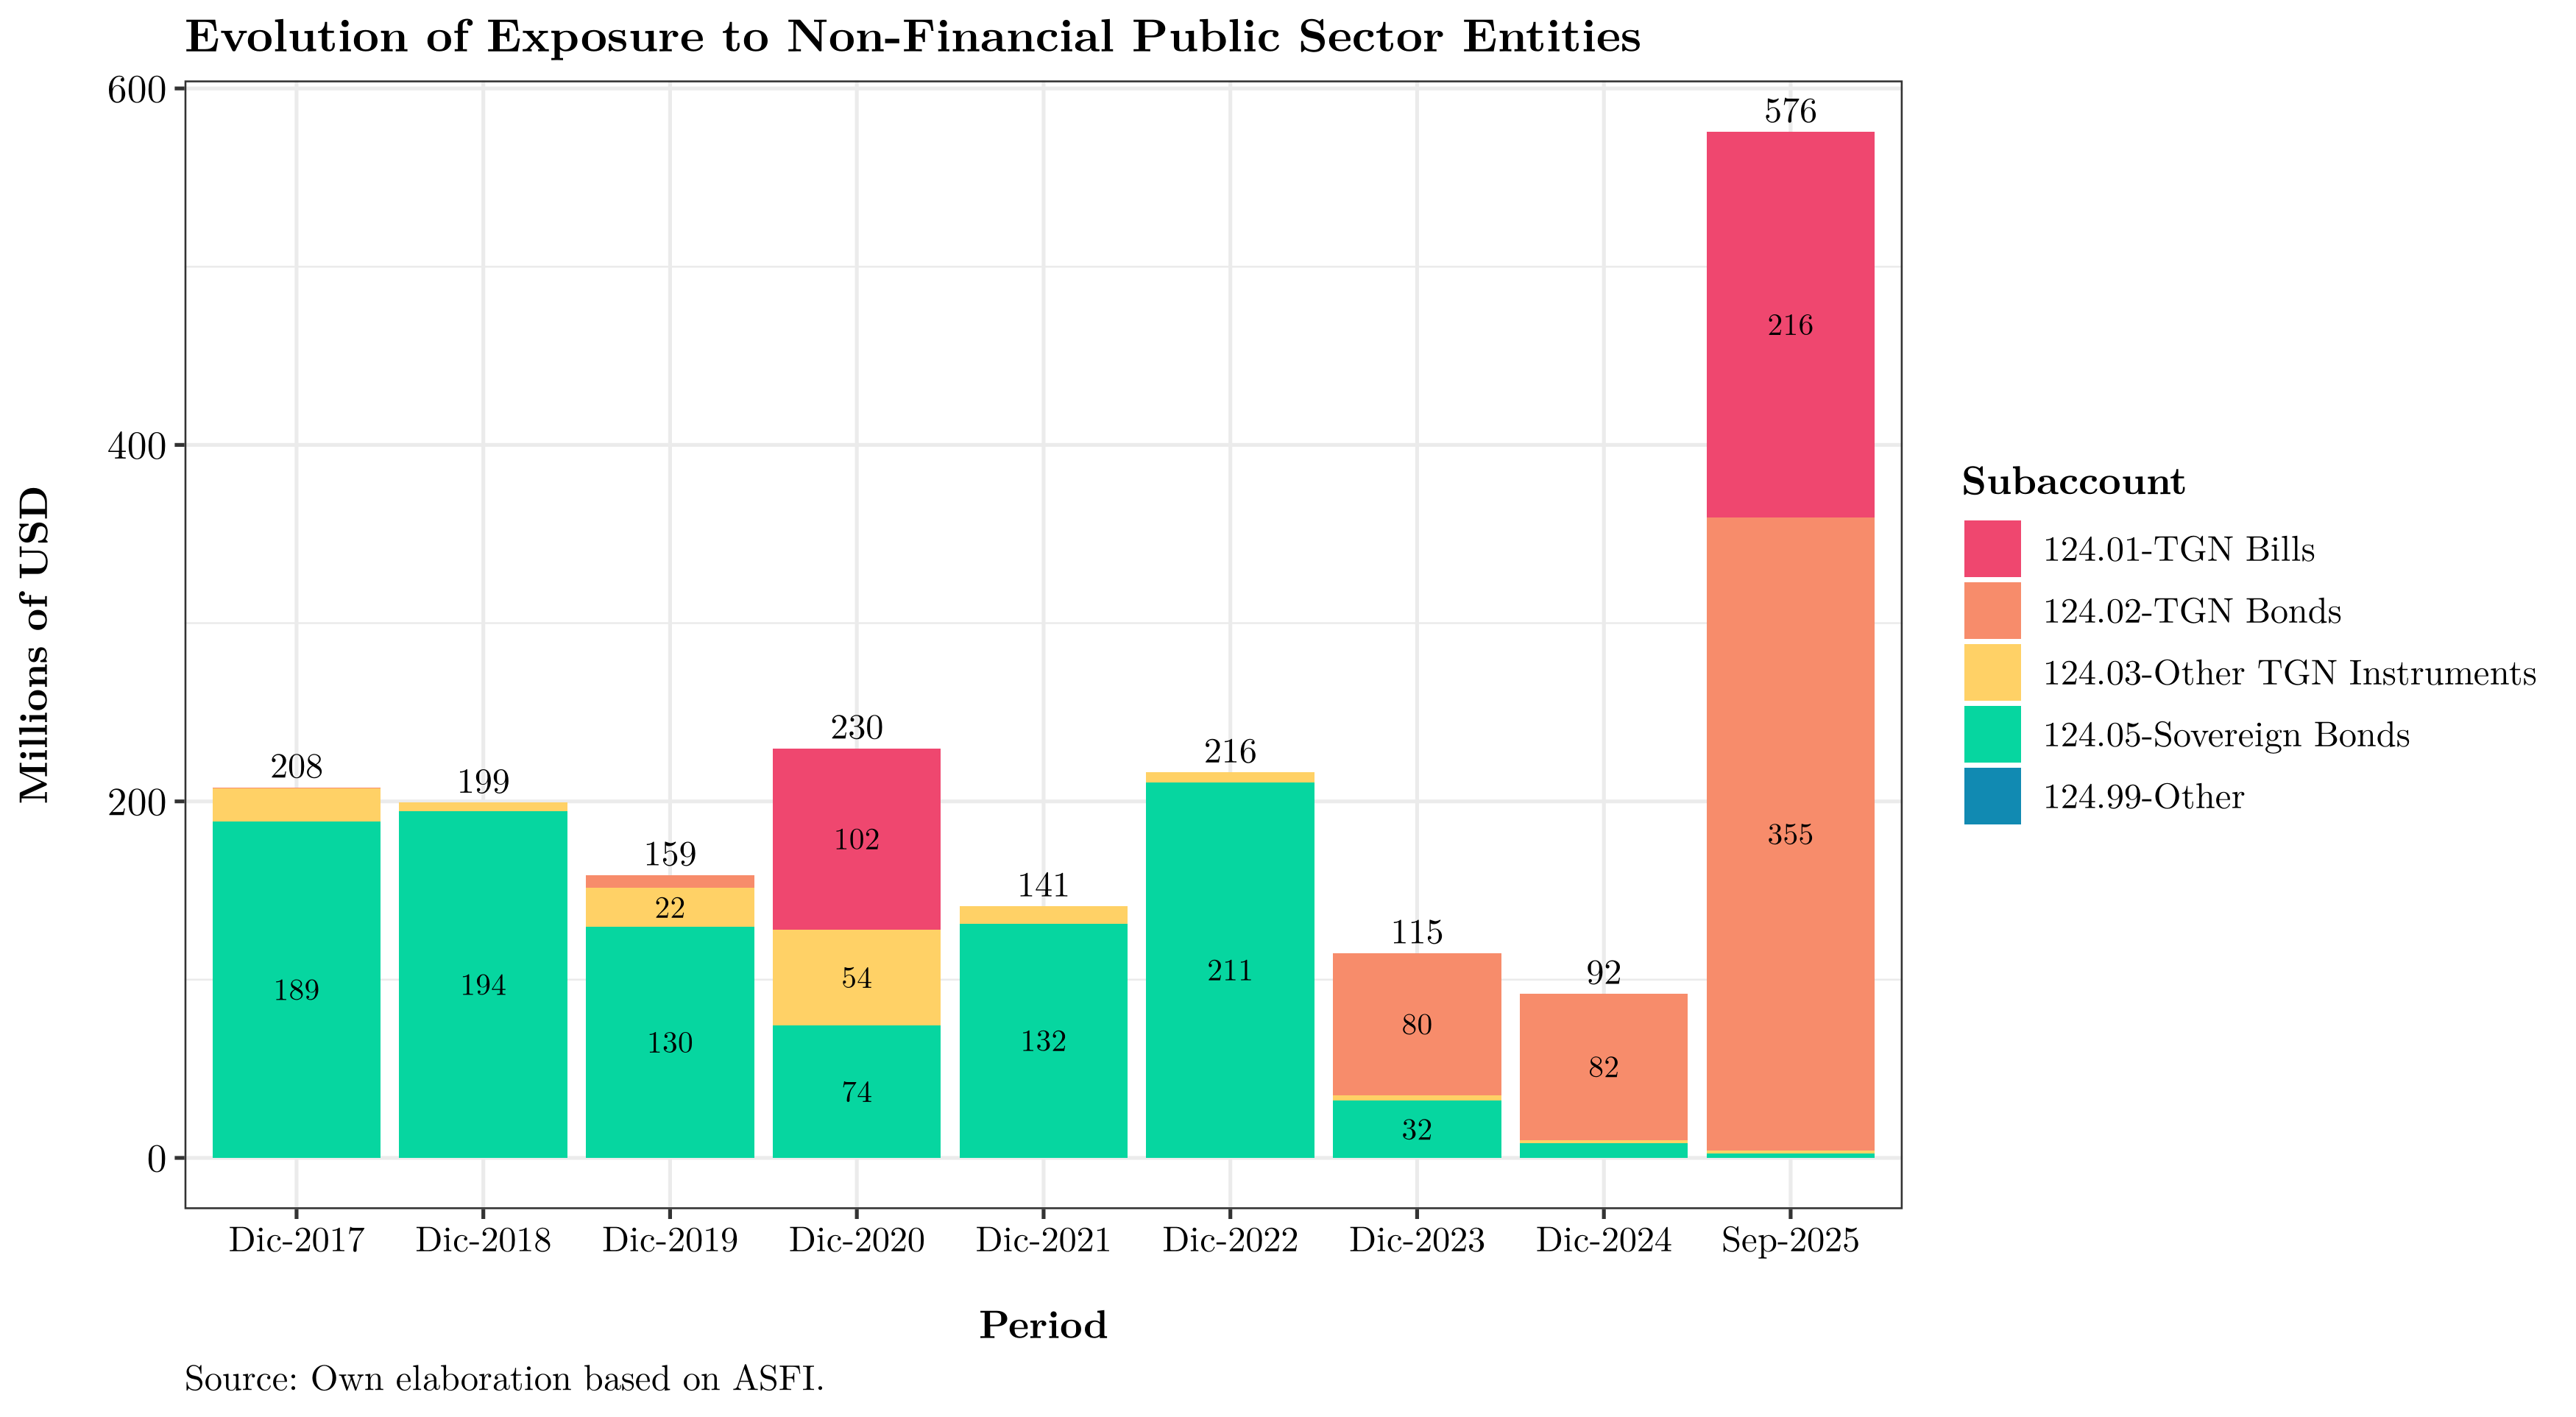
A structural change is visible beginning in 2023 and intensifying through 2025. While the exposure totals just USD 576 million, this account—capturing banks’ ties to the TGN—warrants close monitoring, given current concerns over fiscal sustainability.
By institution and account type:

Banco Unión, Banco Nacional de Bolivia, and Banco Mercantil stand out as the institutions most rapidly increasing exposure to the BCB and the non-financial public sector.
By currency
It is also useful to view temporary investments by currency:
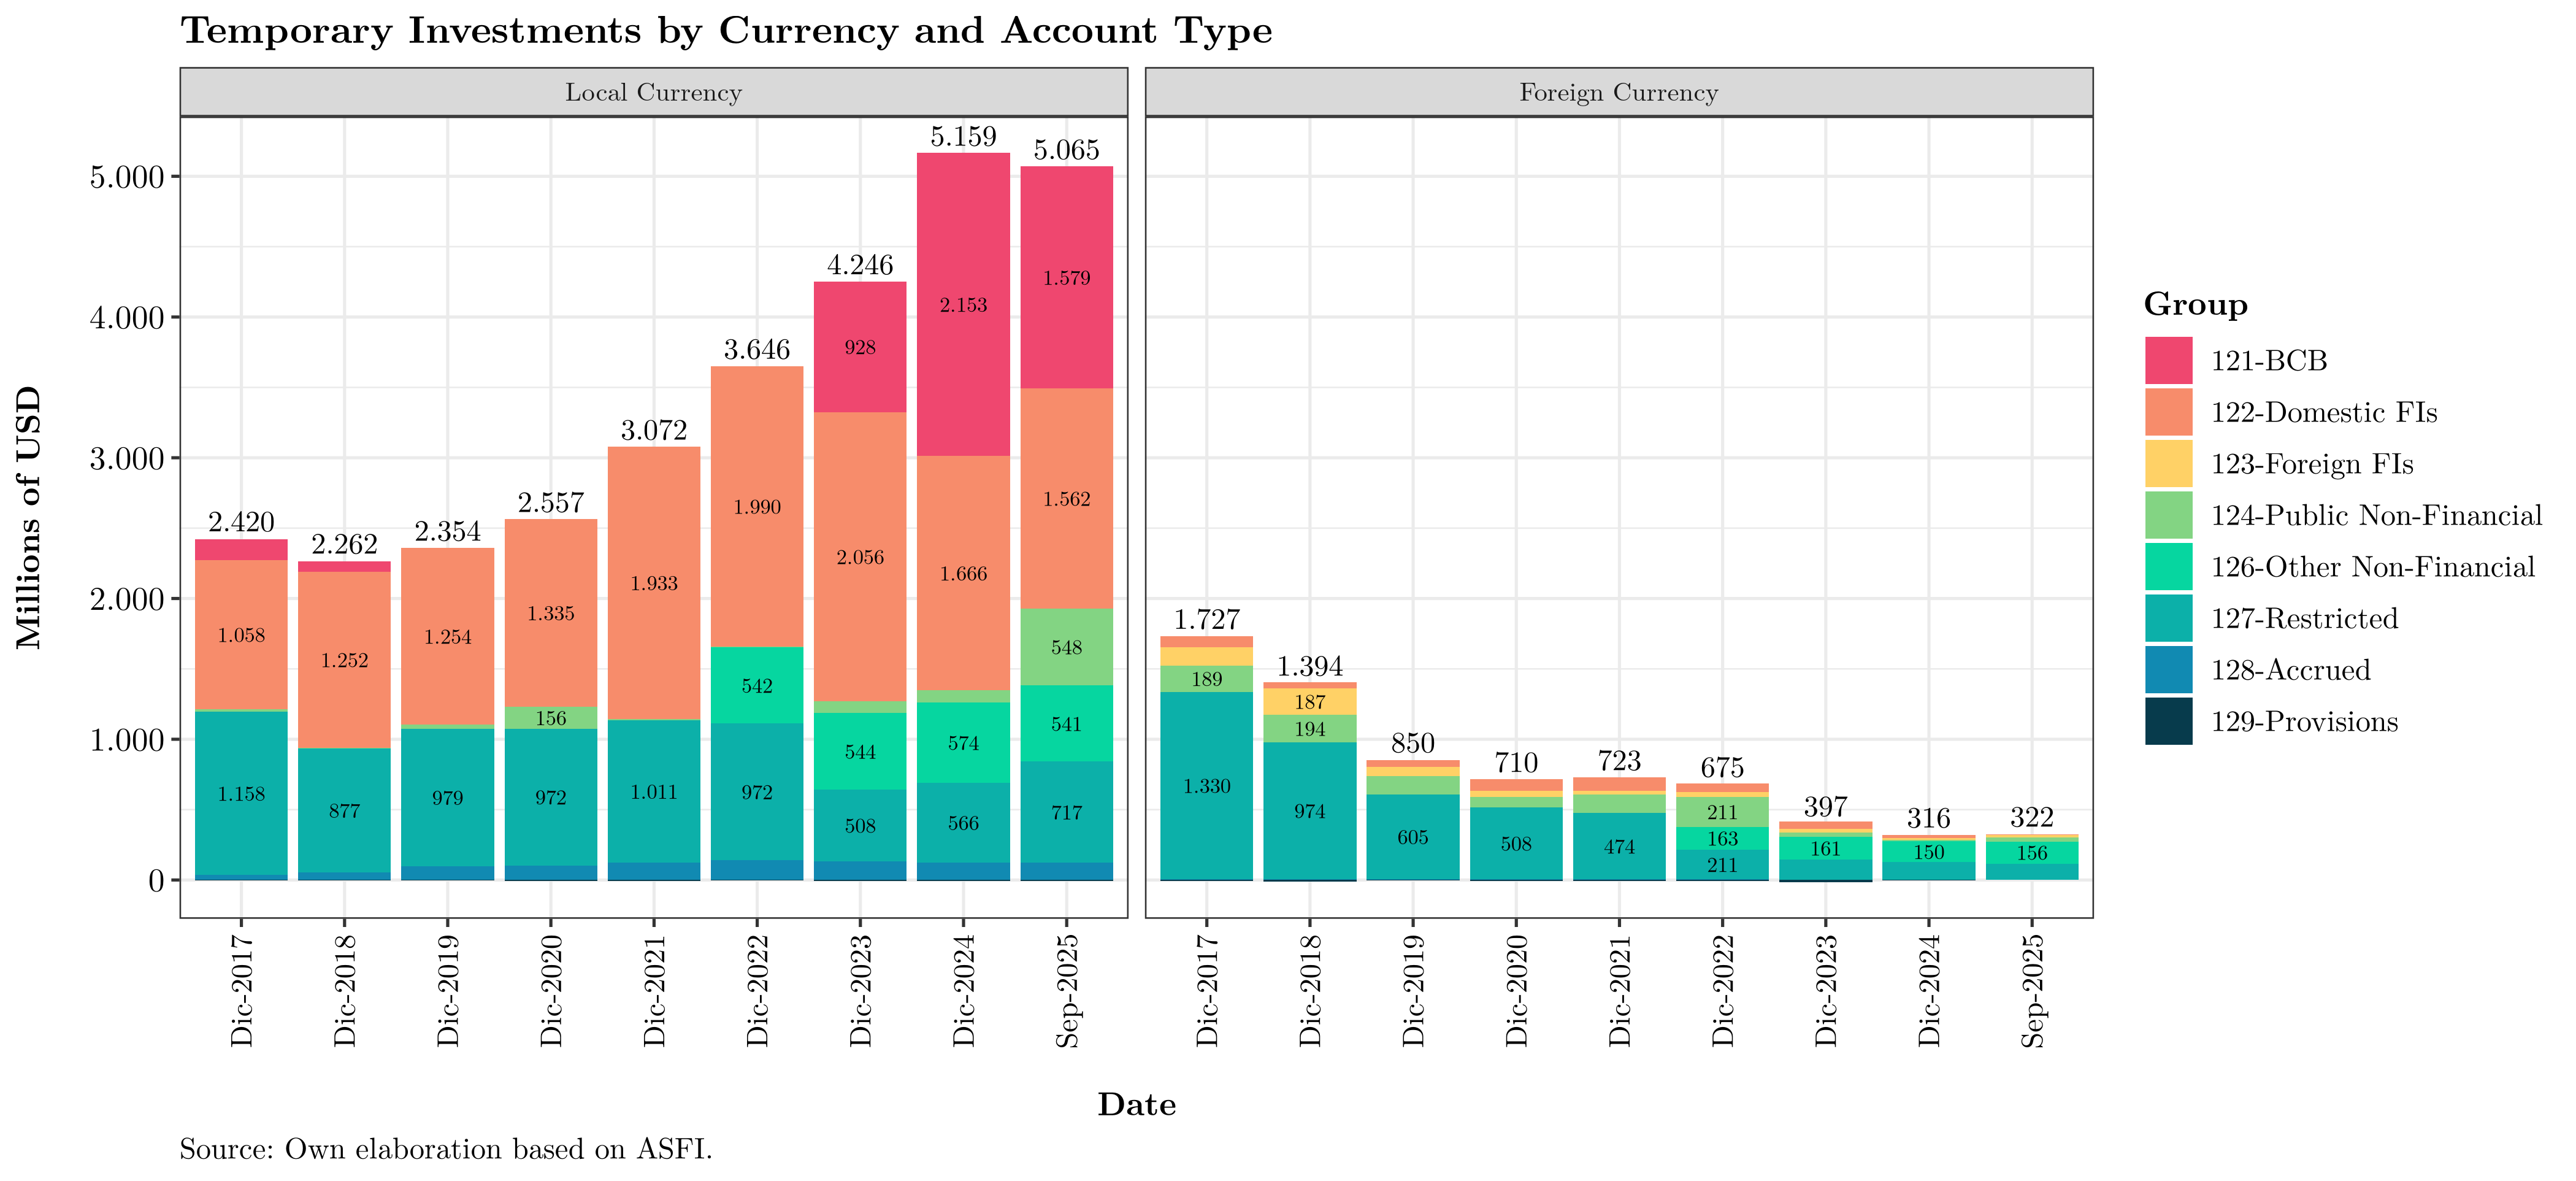
Over time, temporary investments have become increasingly concentrated in local currency and at the BCB—consistent with a monetary policy stance that, while financing the fiscal deficit, has simultaneously absorbed system liquidity to curb inflationary pressures.
Loan portfolio
This section analyzes the banking system’s loan portfolio. Note that loans are the main source of financial income and the system’s core earning asset.
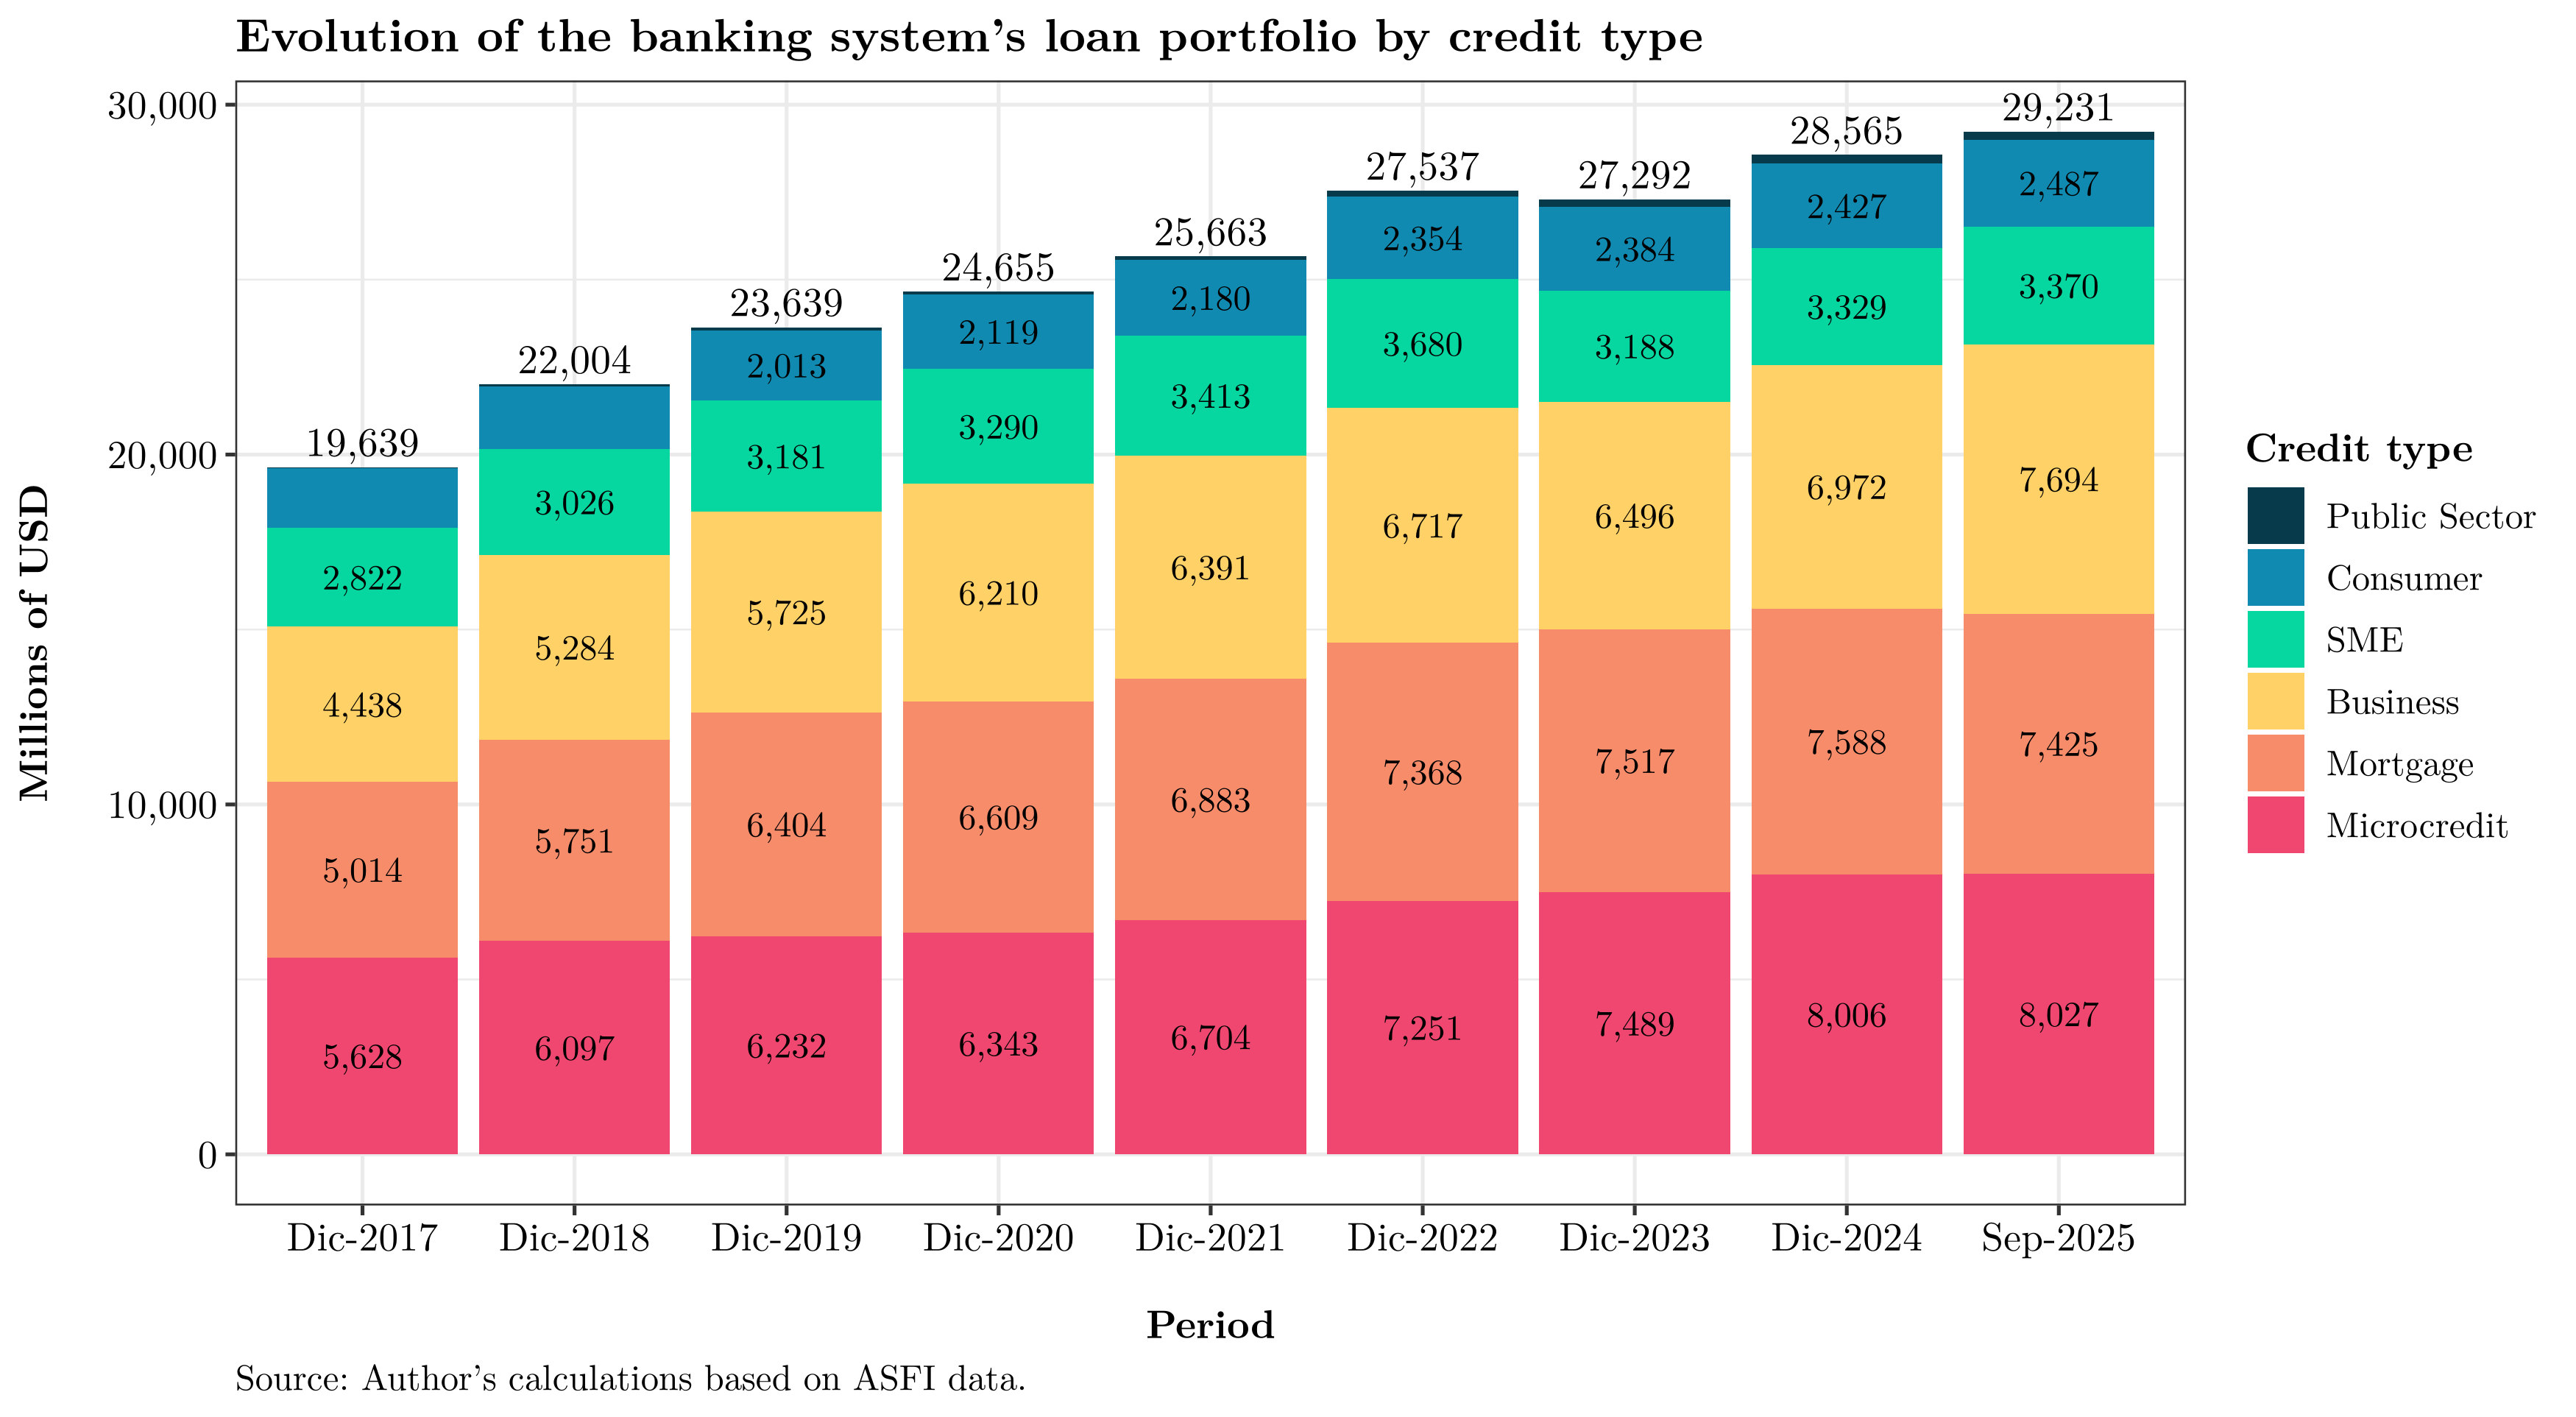
Portfolio by credit type
One approach is to segment by type of credit. As the next figure shows, the loan book has grown steadily since 2016, with a slowdown in 2022–2023 associated with the exit of Banco Fassil:
Growth
A first question is: how has portfolio growth evolved in recent years? This matters because both excess growth and insufficient growth can signal deeper issues. Rapid expansion may presage future solvency problems if underwriting standards deteriorate; sluggish growth may reflect weak aggregate demand and broader real-economy stress.
The next chart shows YoY growth (current month vs. same month a year earlier), excluding provisions and accrued receivables. Growth decelerated and stabilized around 5% in 2024–2025, with a downward trend in recent months:

Additionally, the portfolio expanded strongly in the late 2000s/early 2010s, peaking around March 2011; thereafter growth lost momentum—remaining positive and double-digit at times—but decelerating over time.
By institution, most banks show a pronounced slowdown in loan origination:
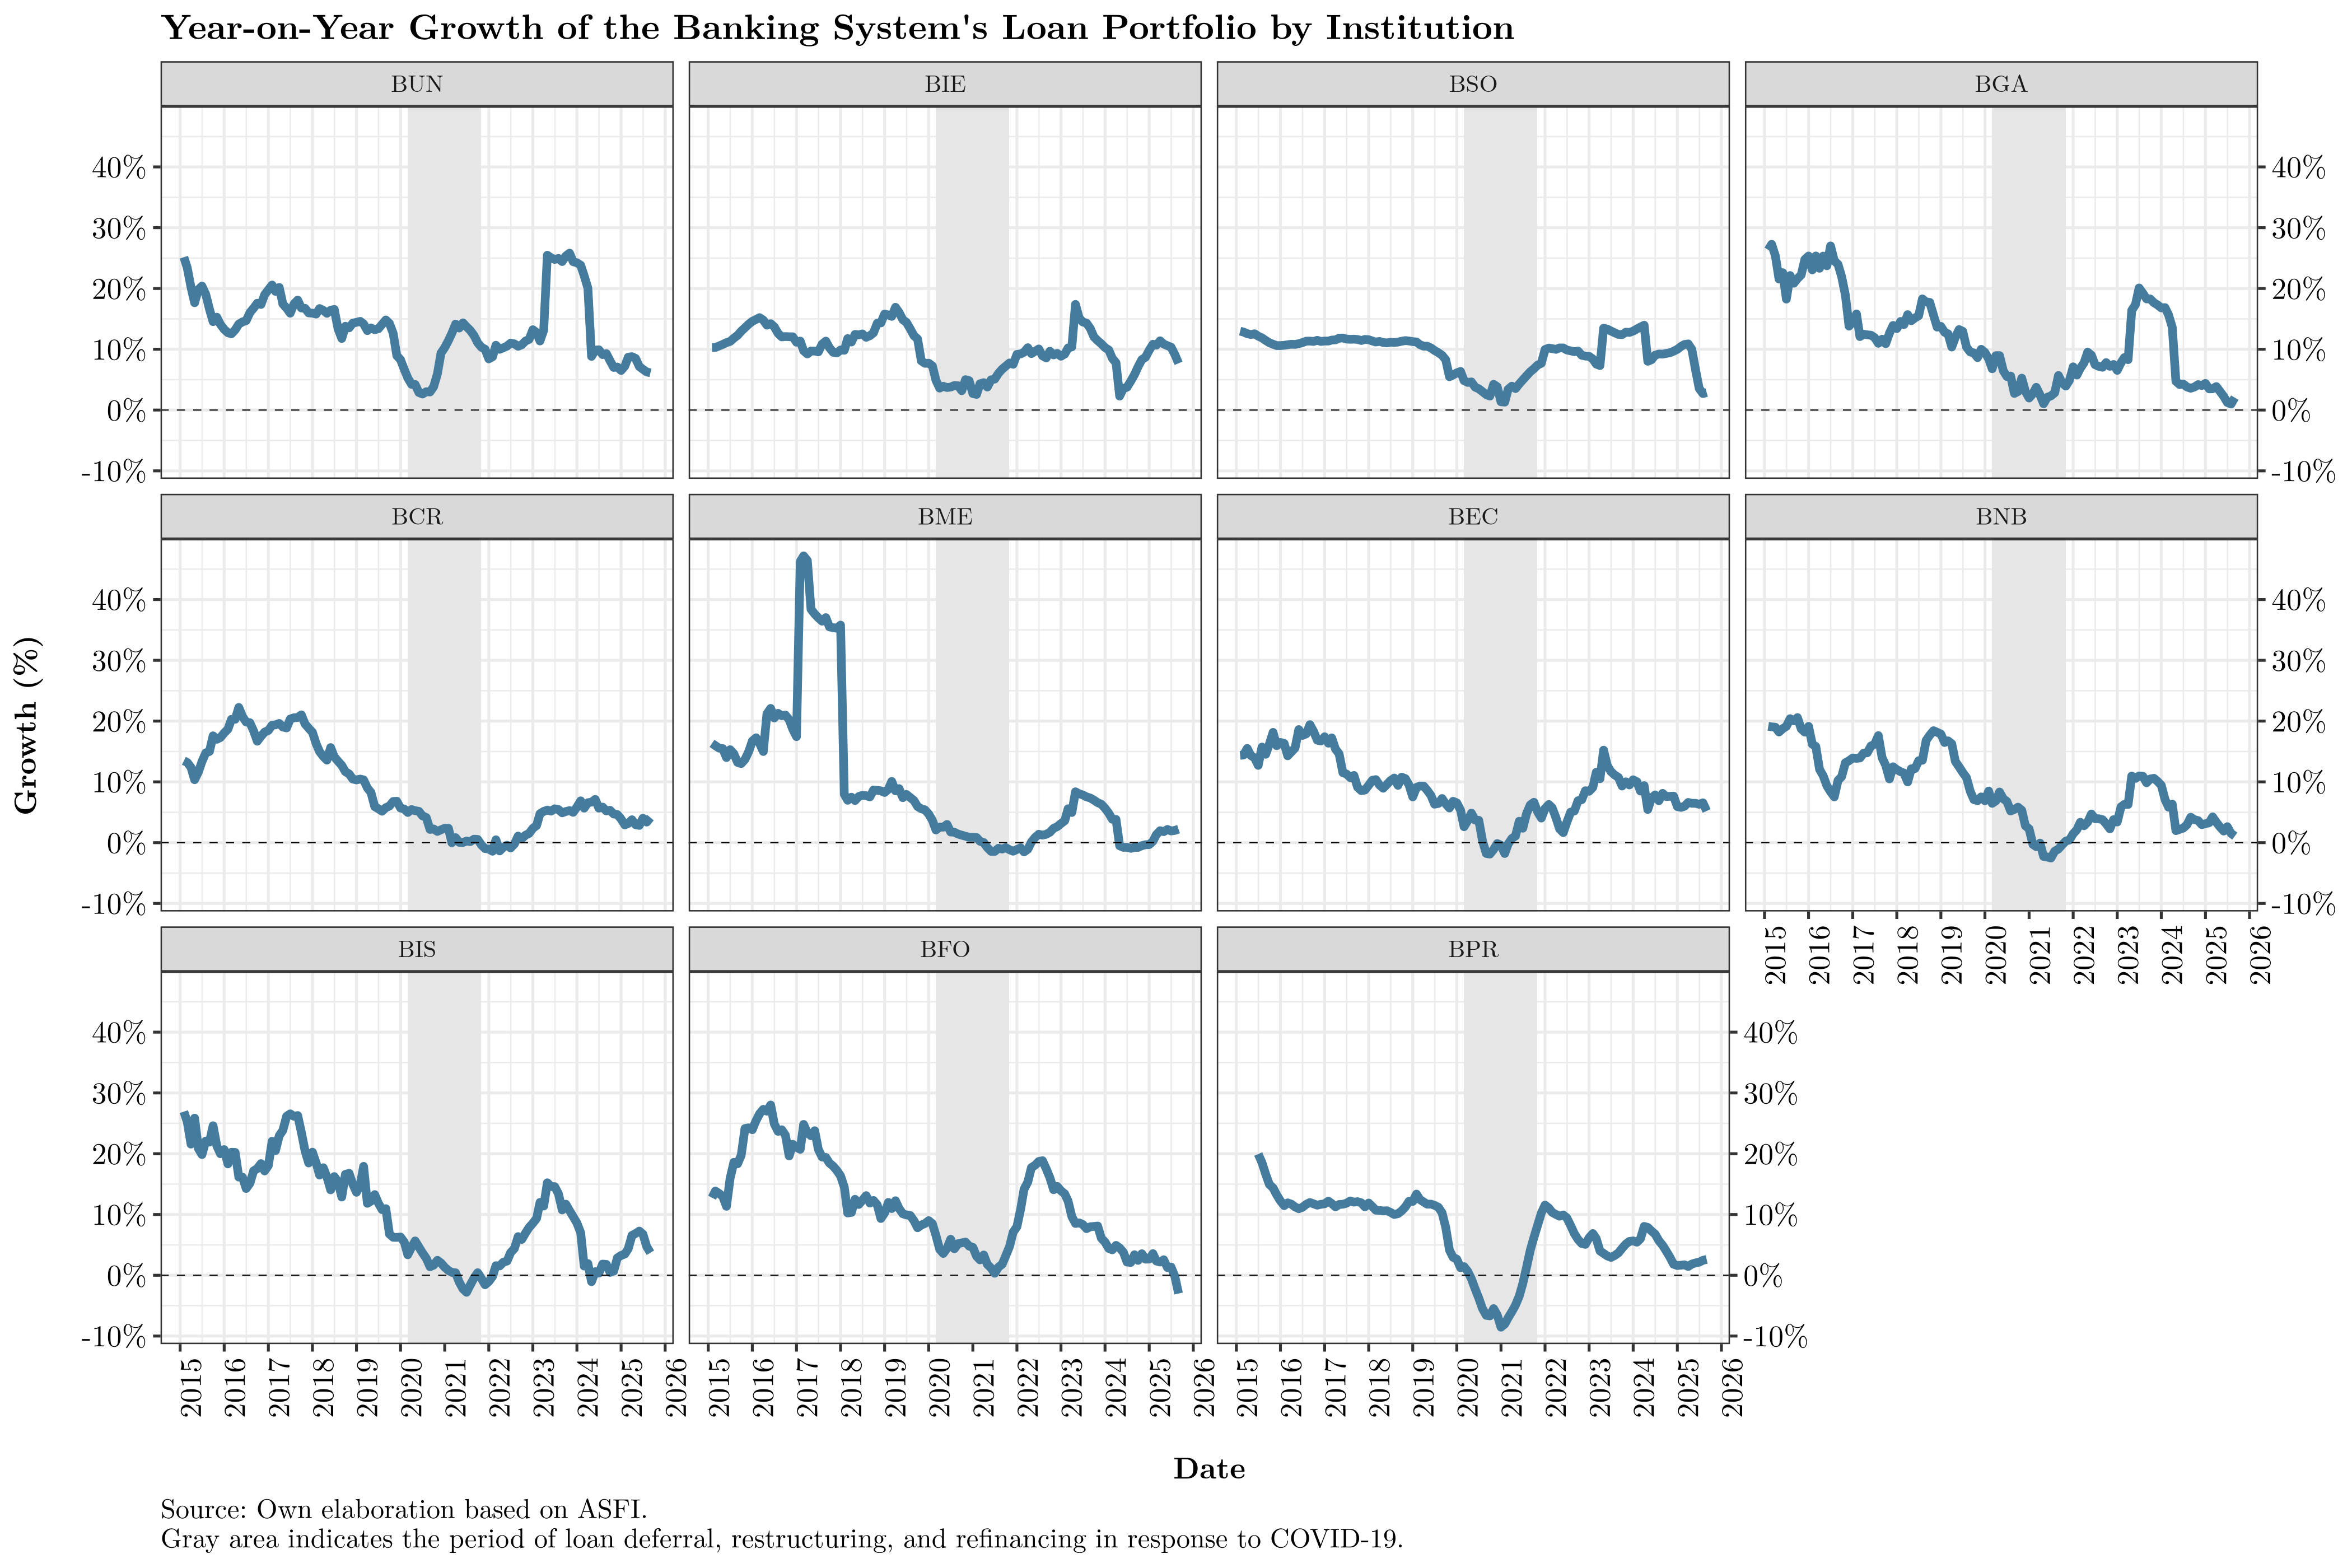
Many institutions are now growing more slowly than during the early months of the pandemic. This warrants close monitoring, as it reflects weaker national economic activity and softer credit demand.
Finally, in stock terms, the following figures show monthly portfolio increases:
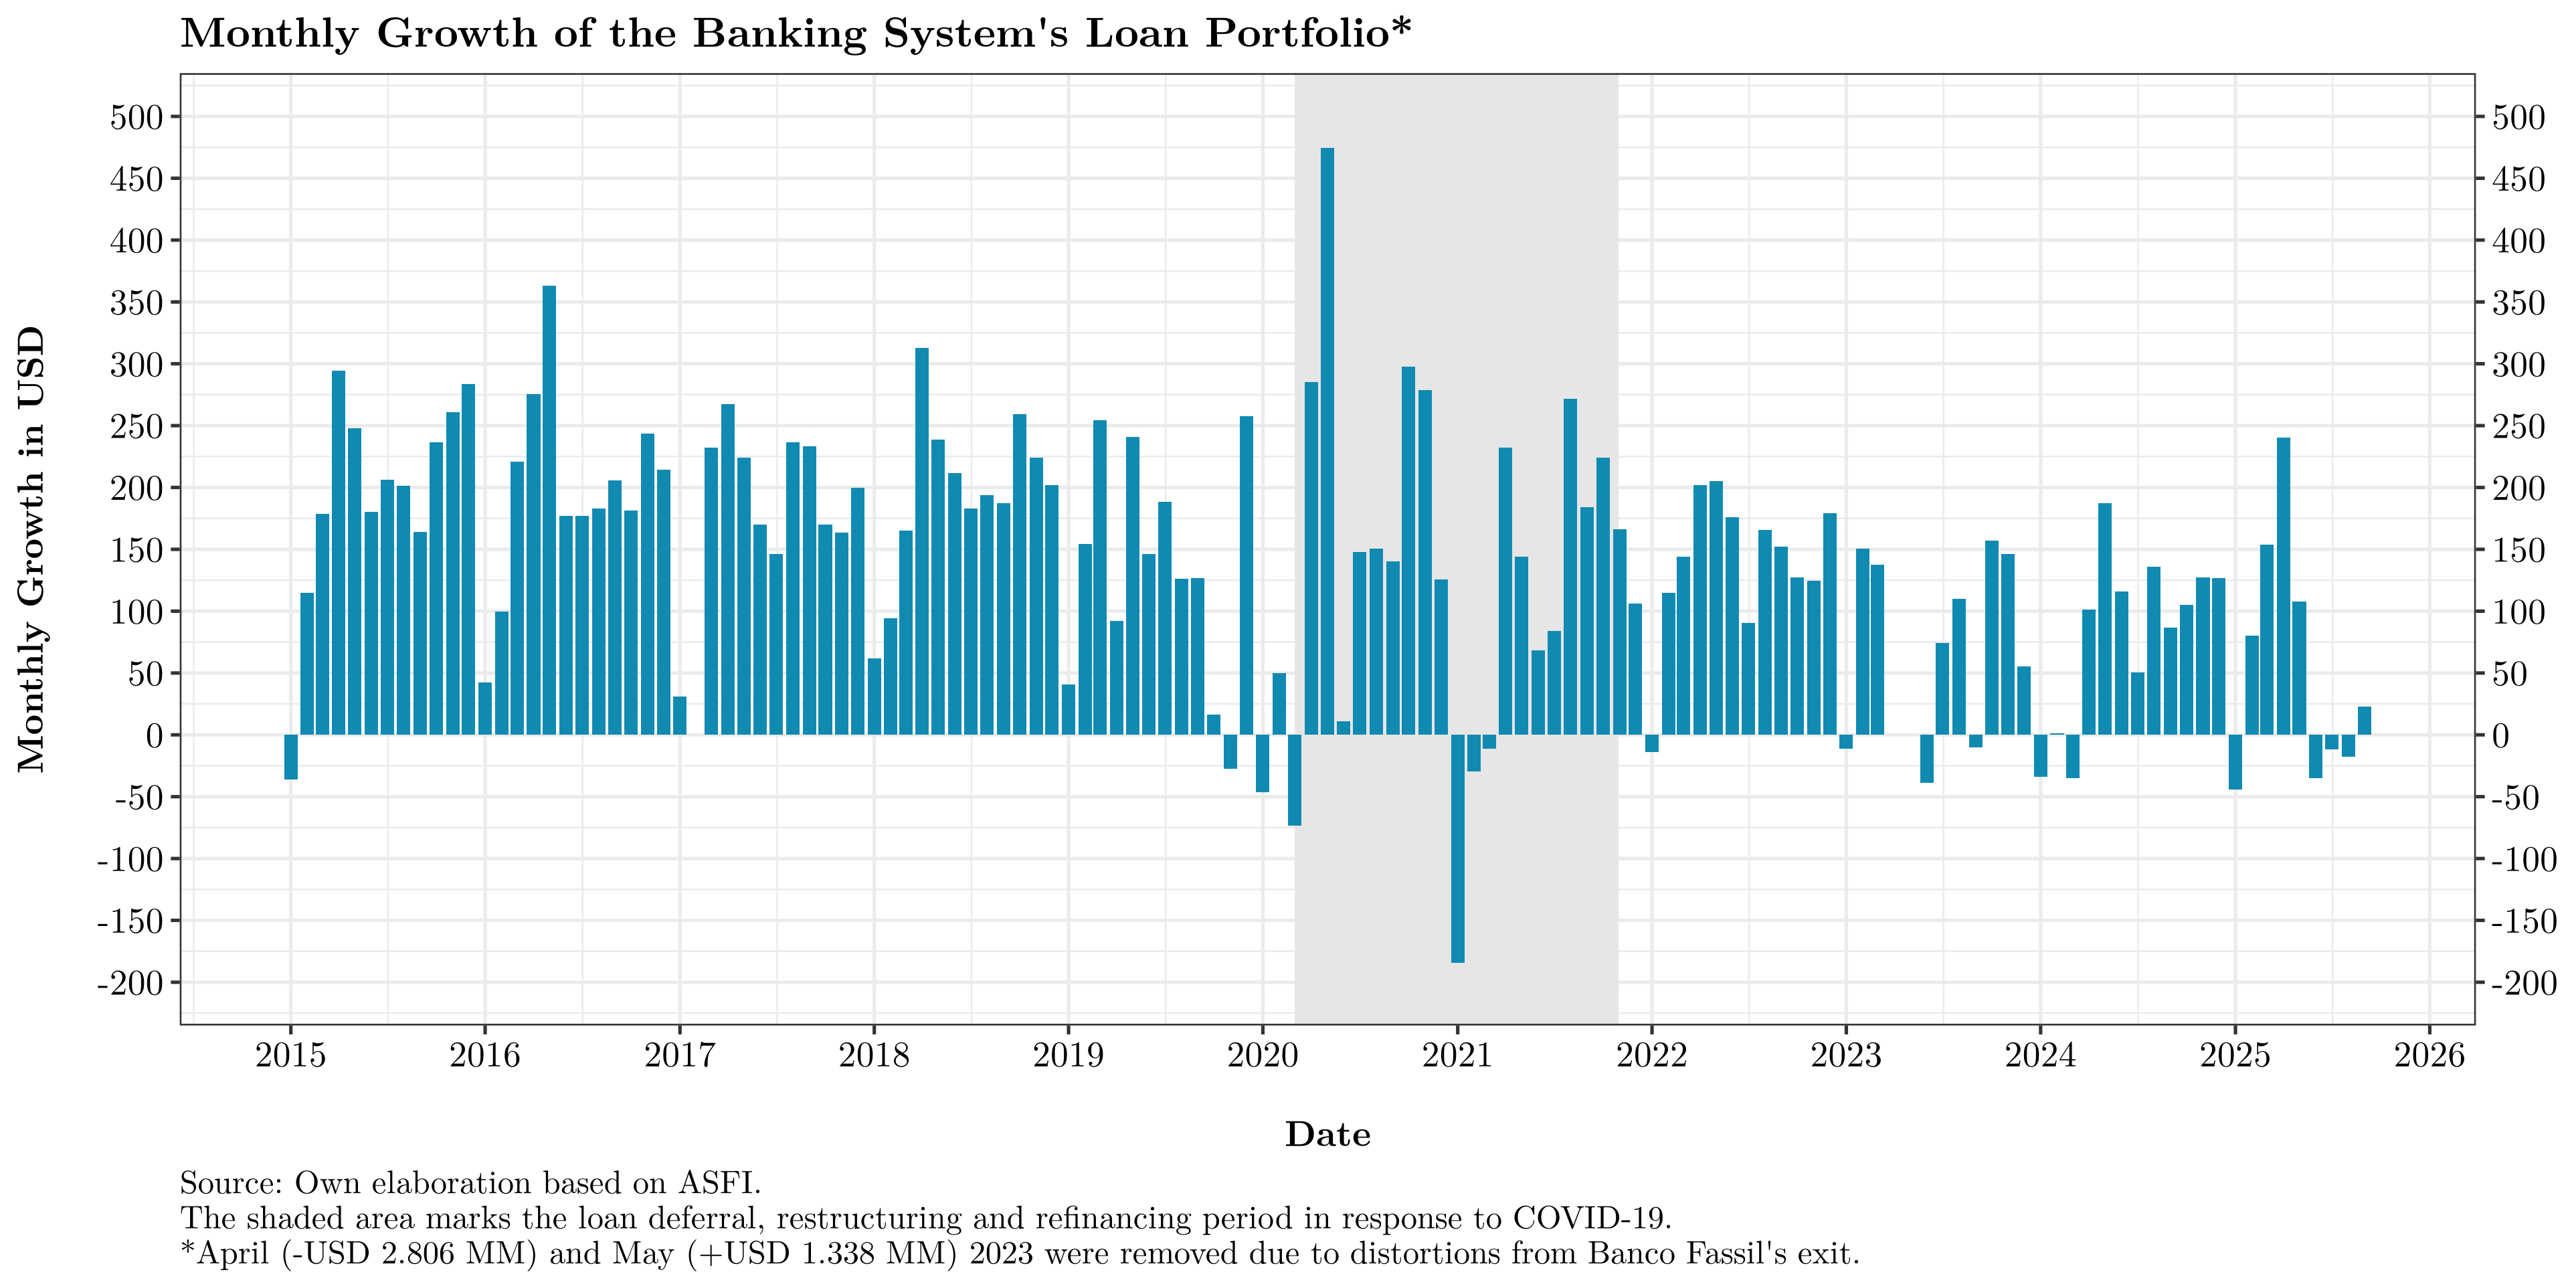

Viewed as a month-to-month flow, loan activity has been contracting over time, despite being expressed in U.S. dollars at the official exchange rate.
Growth by credit type
It is also informative to examine YoY growth by credit type:
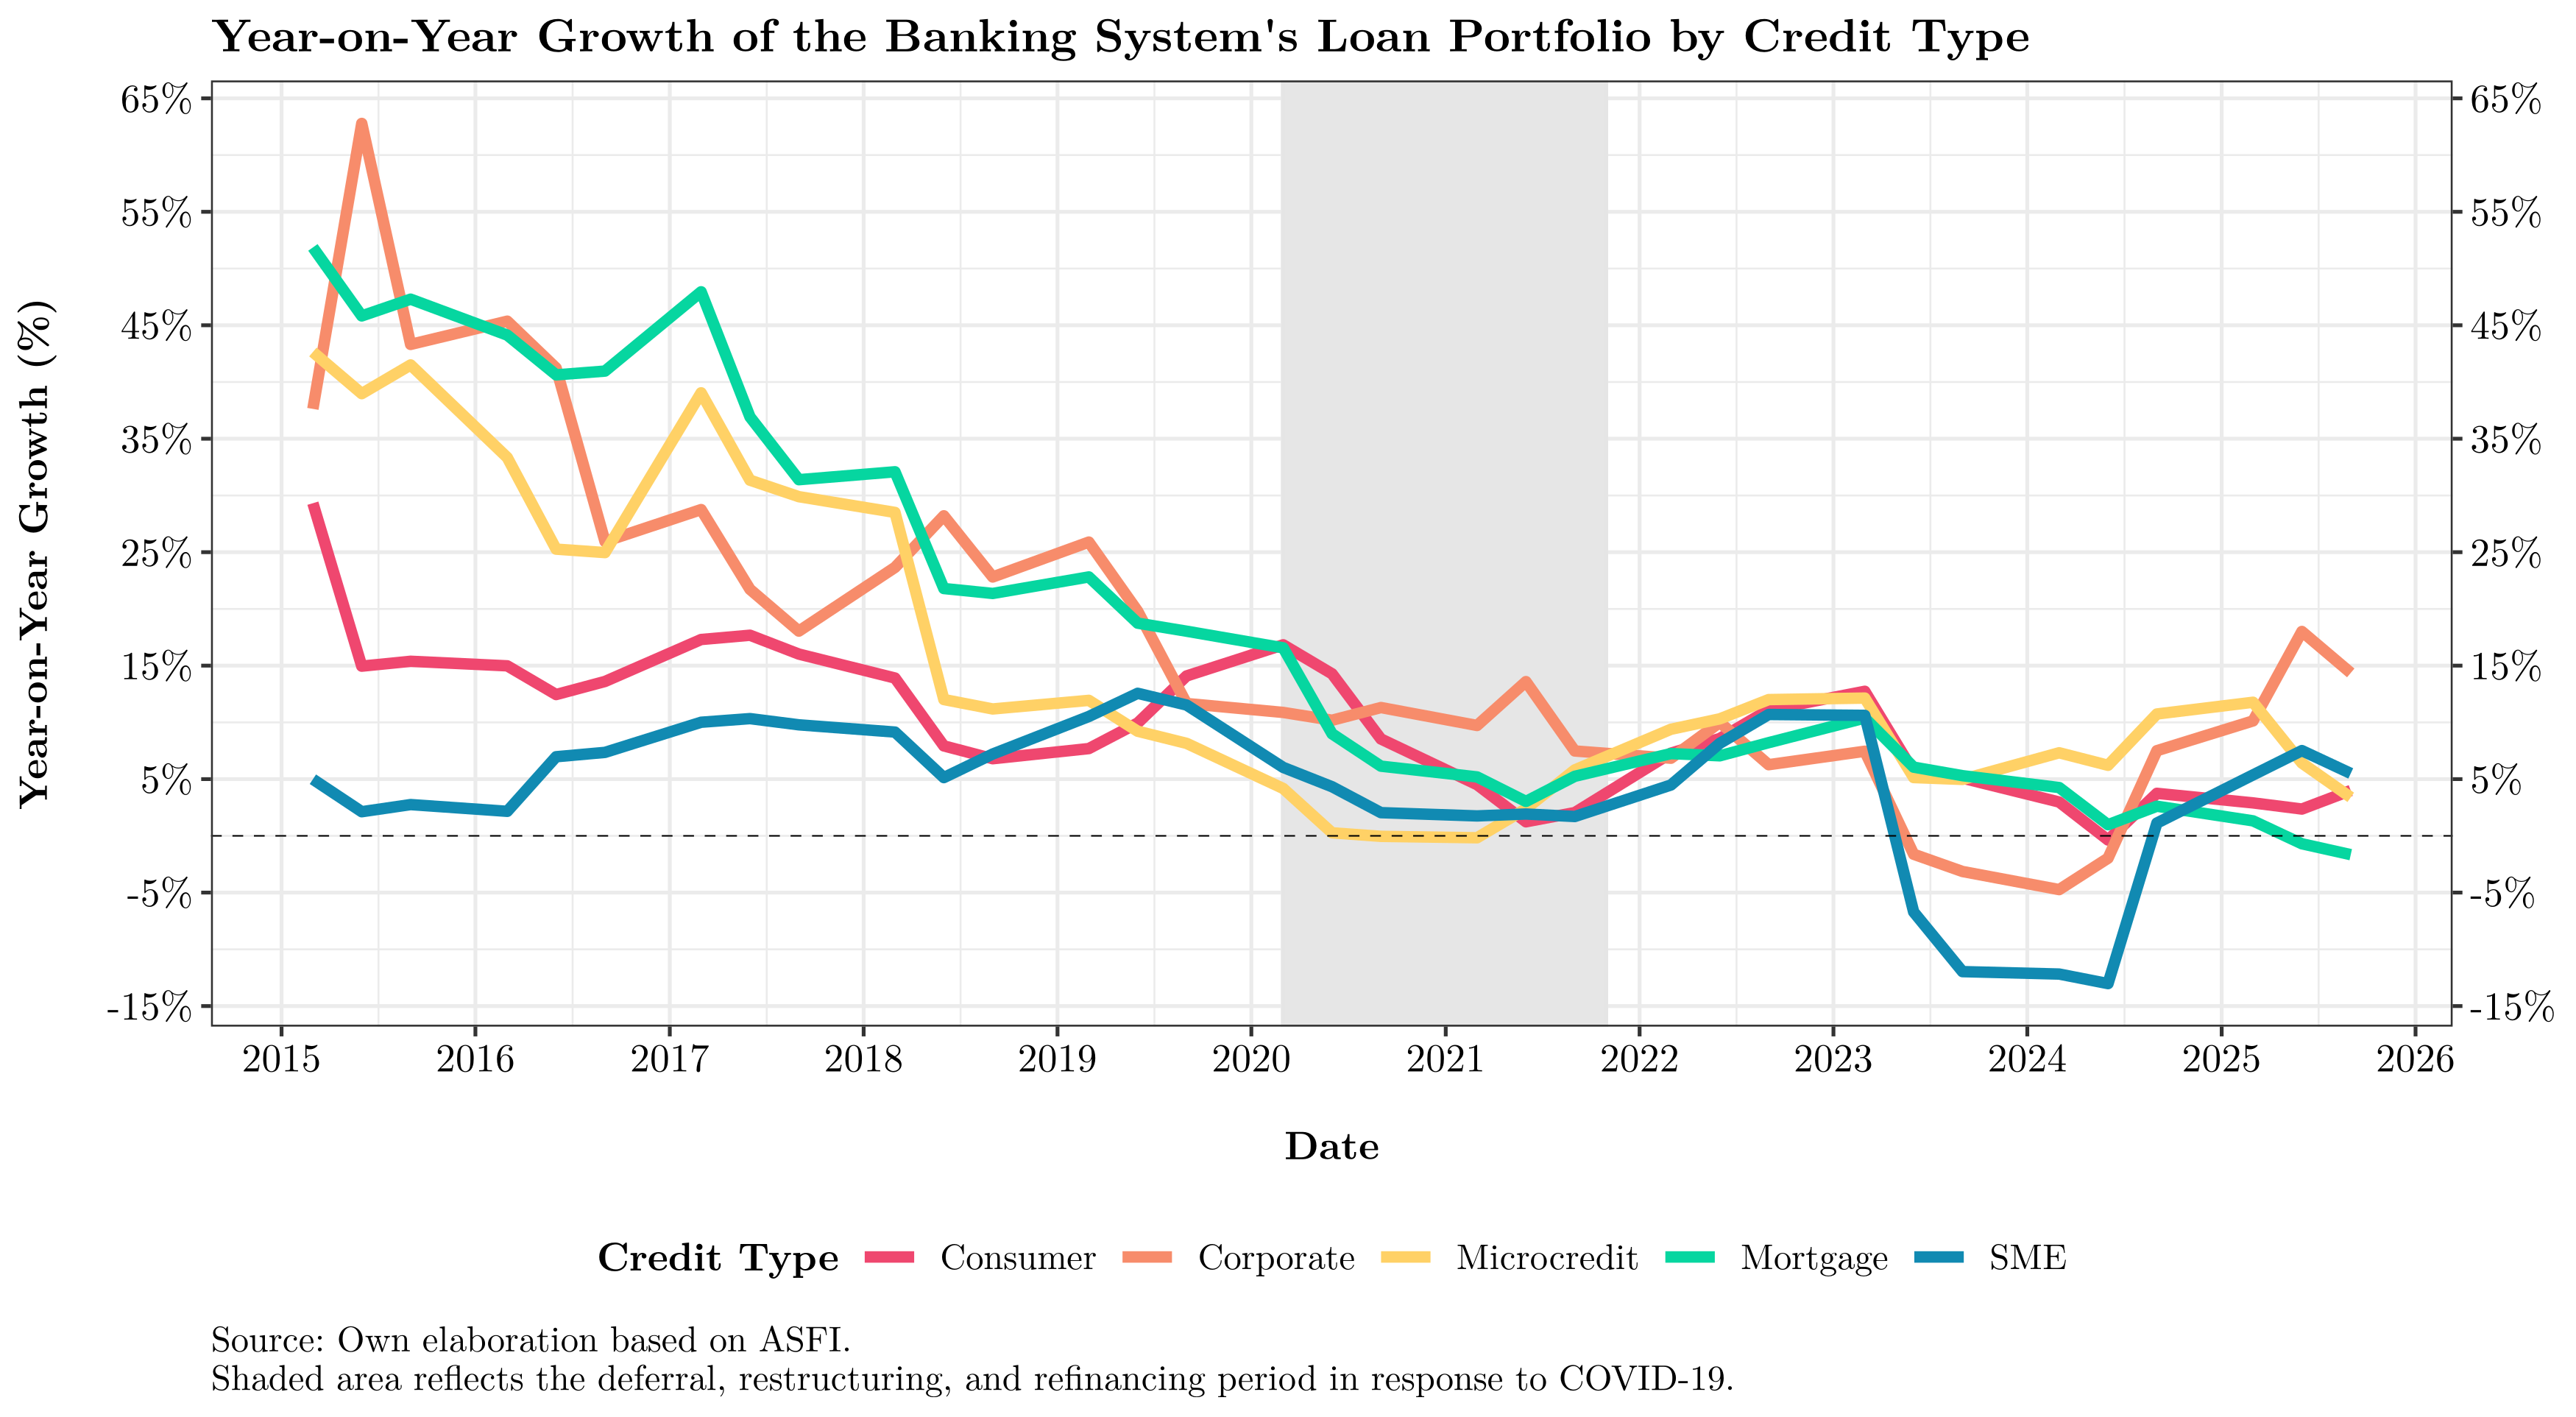
As with the aggregate portfolio, most segments have lost momentum, particularly consumer and mortgage loans. However, after a sharp decline during 2023–2024, SME and corporate loans show a notable rebound.
This warrants deeper investigation. Given current conditions, new SME and corporate credit may be aimed less at expansion and more at sustaining operations amid economic slowdown.1
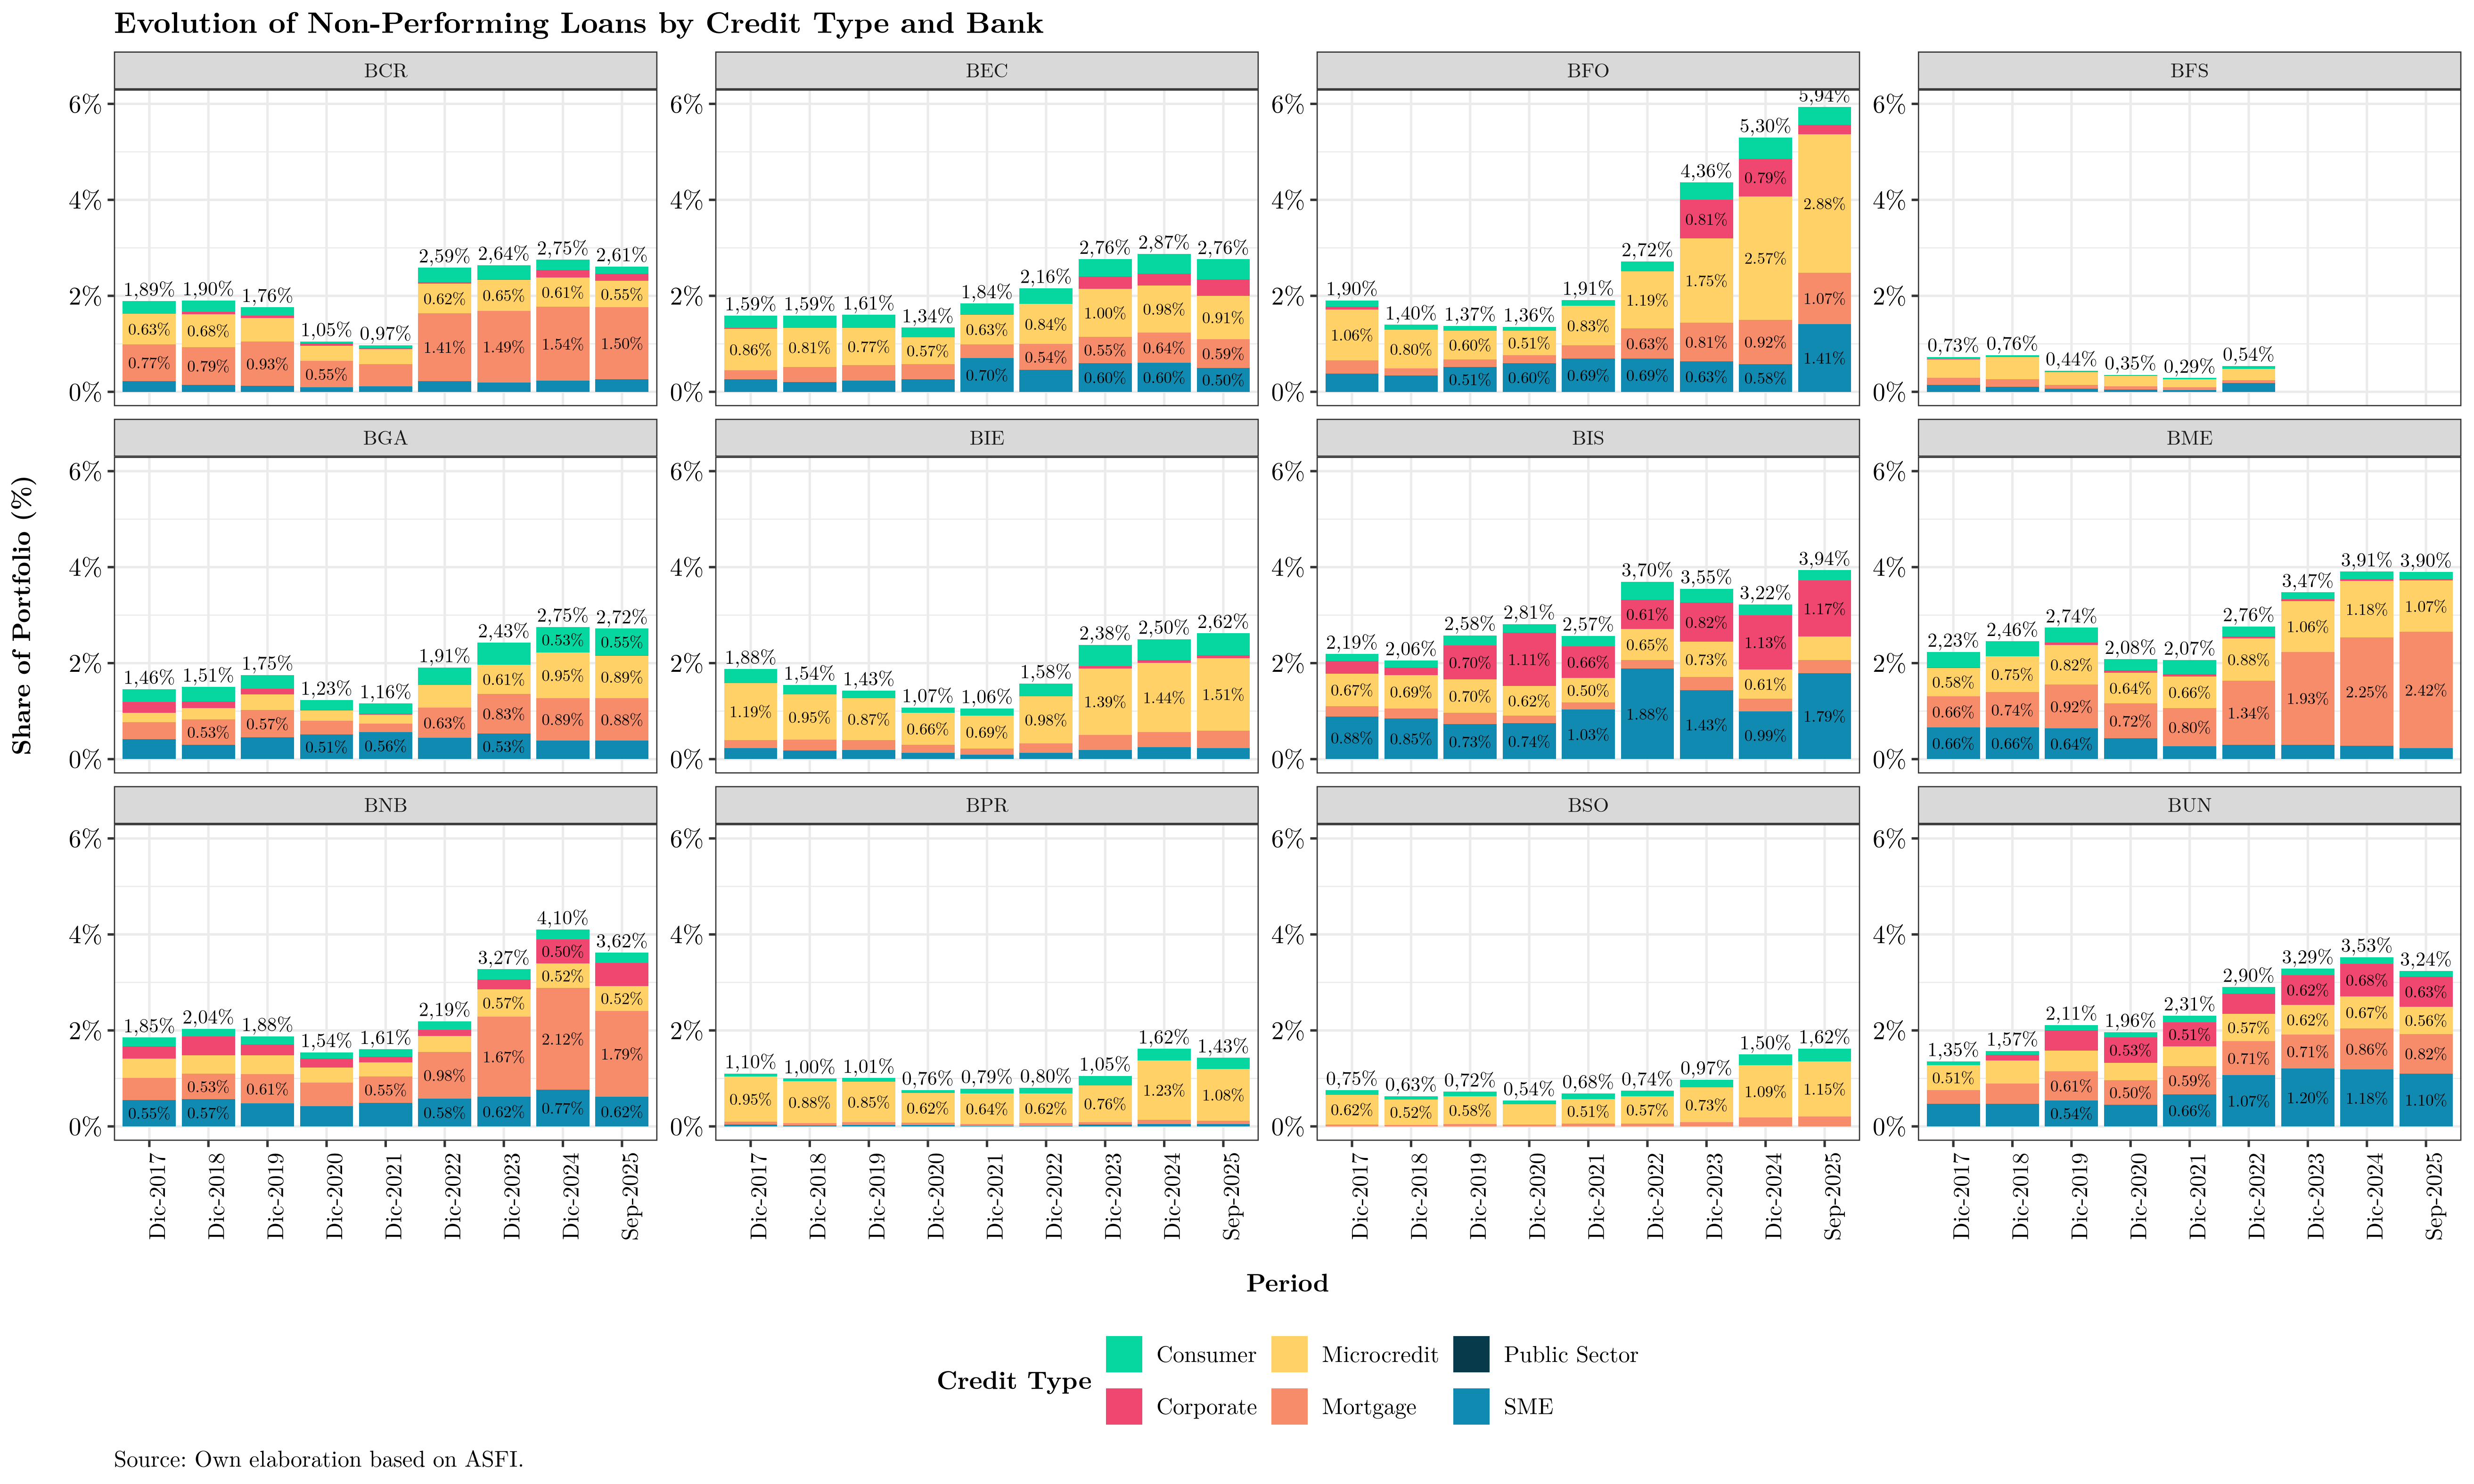
Non-performing loans (NPLs)
The NPL ratio comprises all loans with more than 30 days past due, as a share of total loans.
The following chart shows its evolution since January 2003. NPLs peaked around 23% in 2003—high enough to render the system insolvent in practice—within the challenging macro context of the early 2000s.
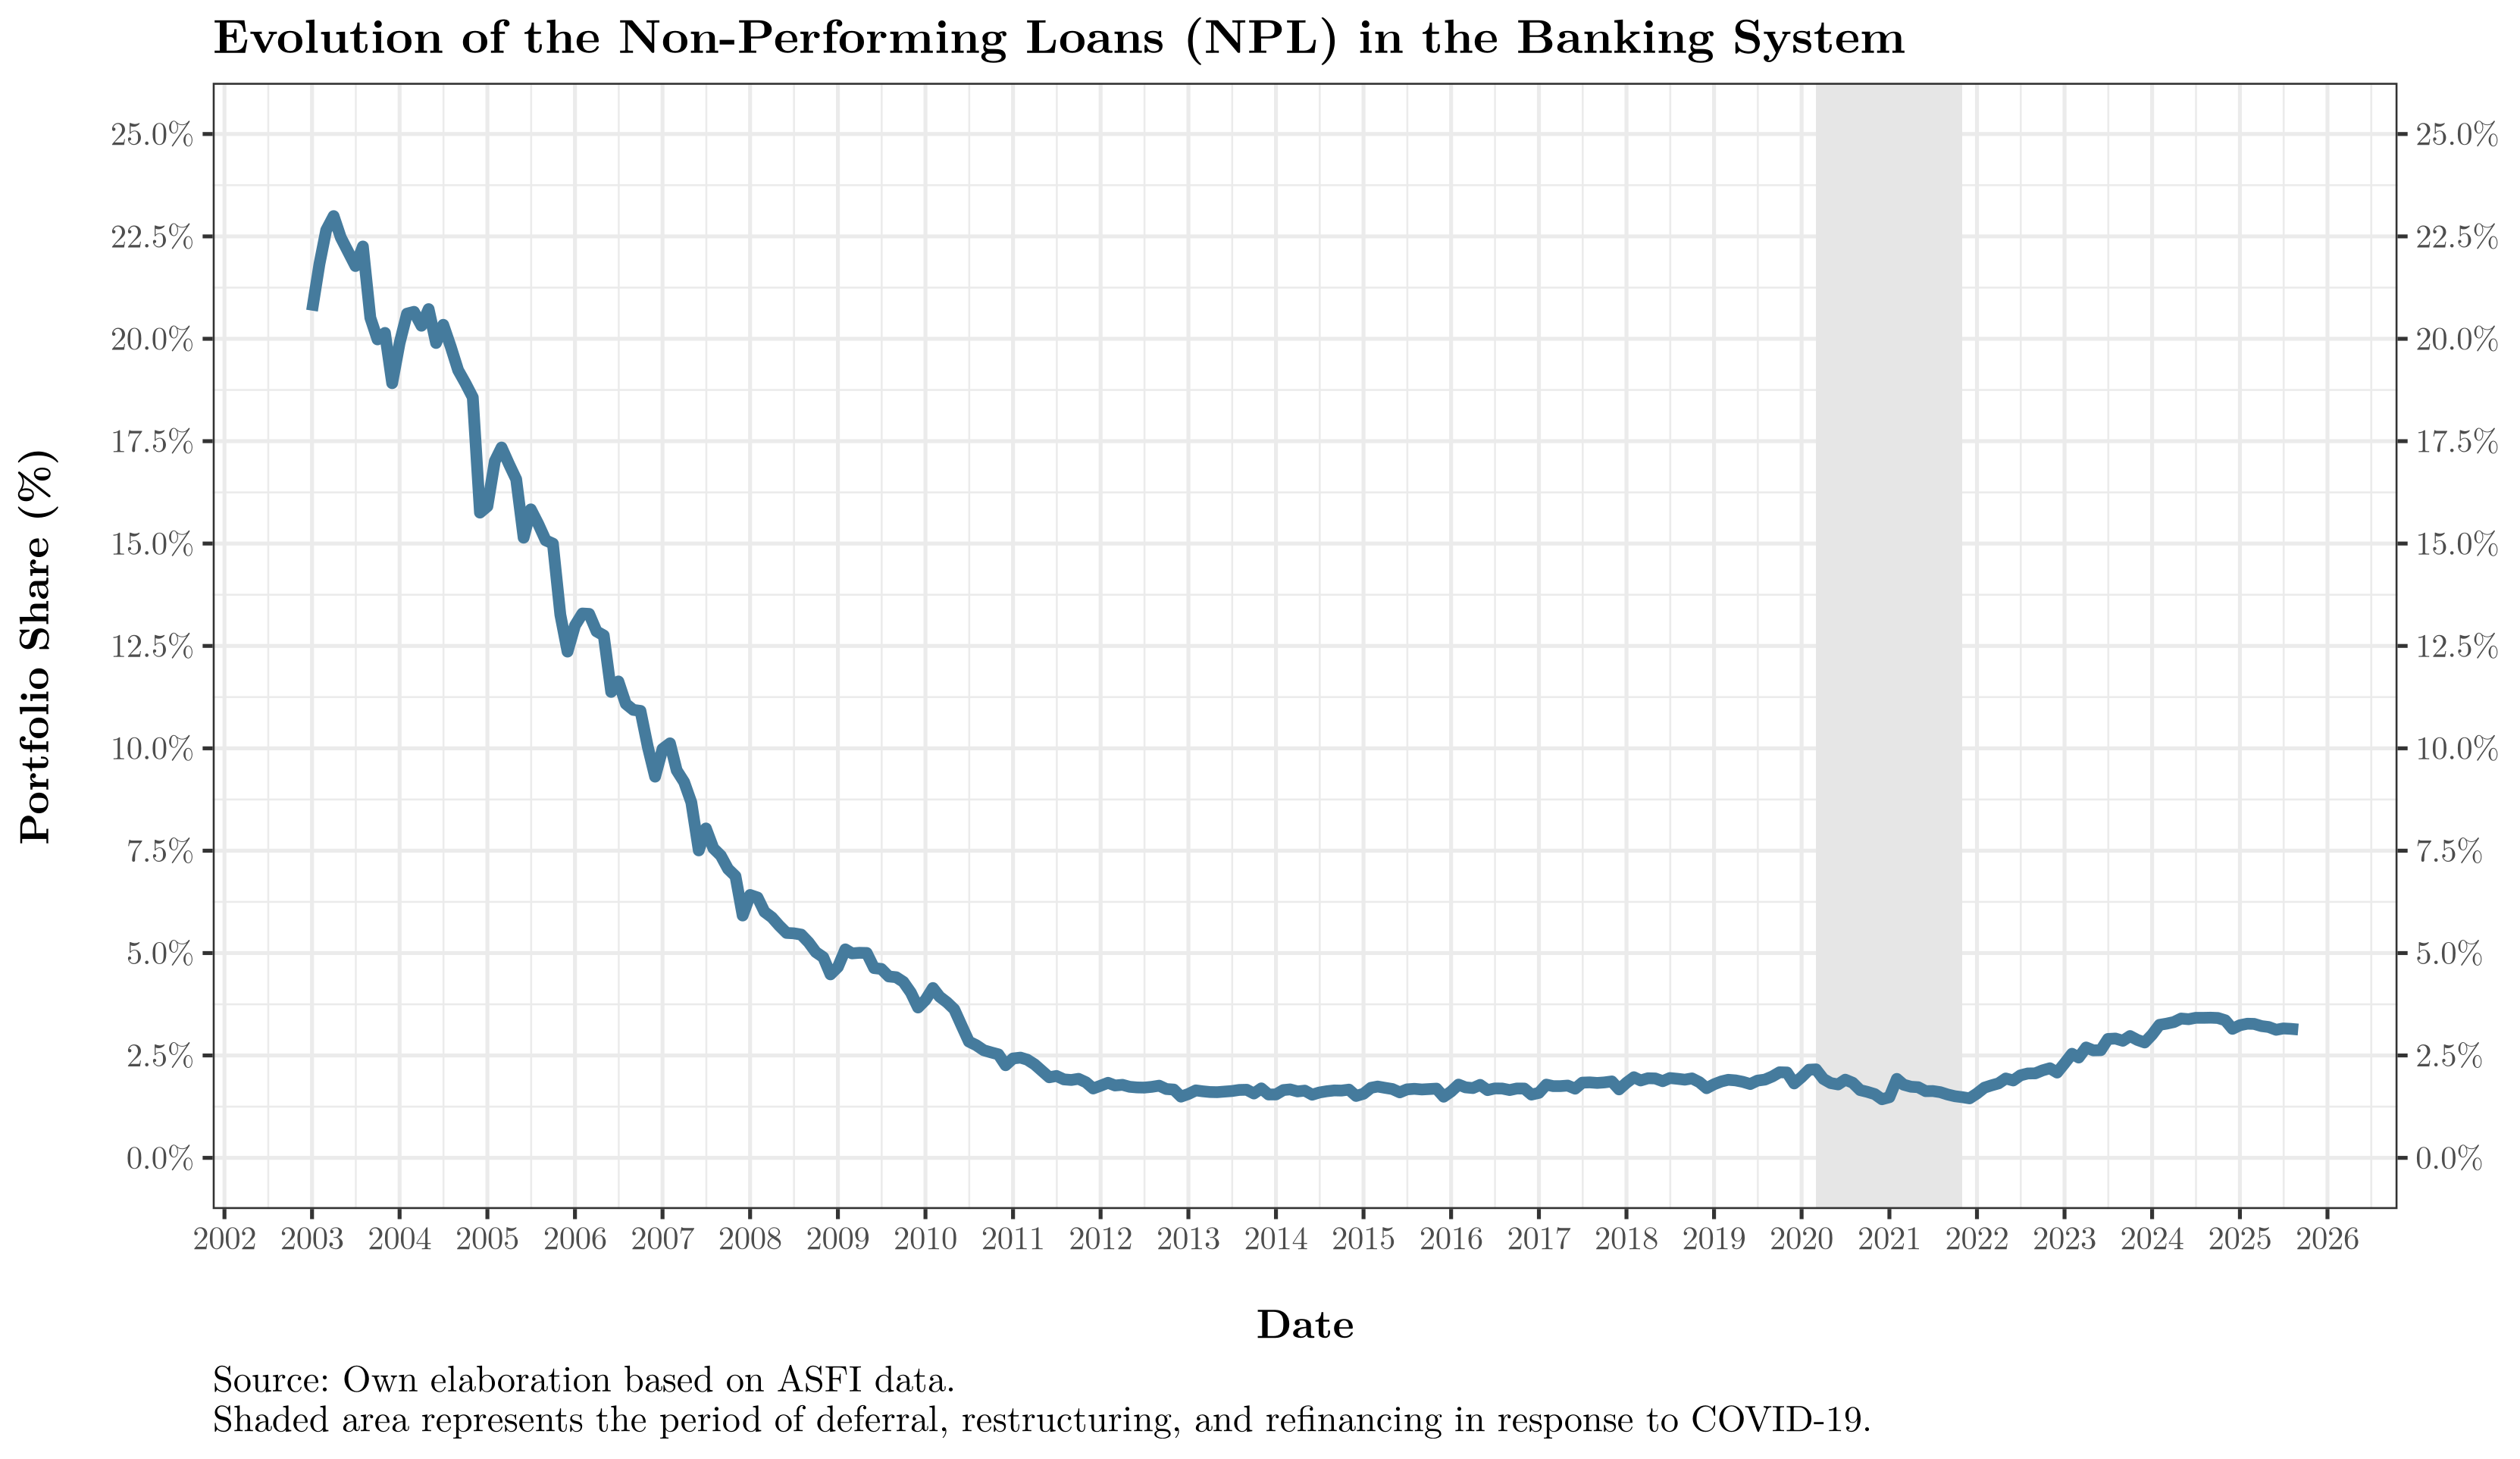
Subsequently, NPLs declined and remained under control. By 2007 the indicator returned to single digits, reaching a low of 1.55% in 2013. Thereafter, NPLs trended up gradually toward ~1.8% until the pandemic, when refinancing, grace periods, and reprogramming temporarily reduced reported NPLs.
Focusing on data since 2015:
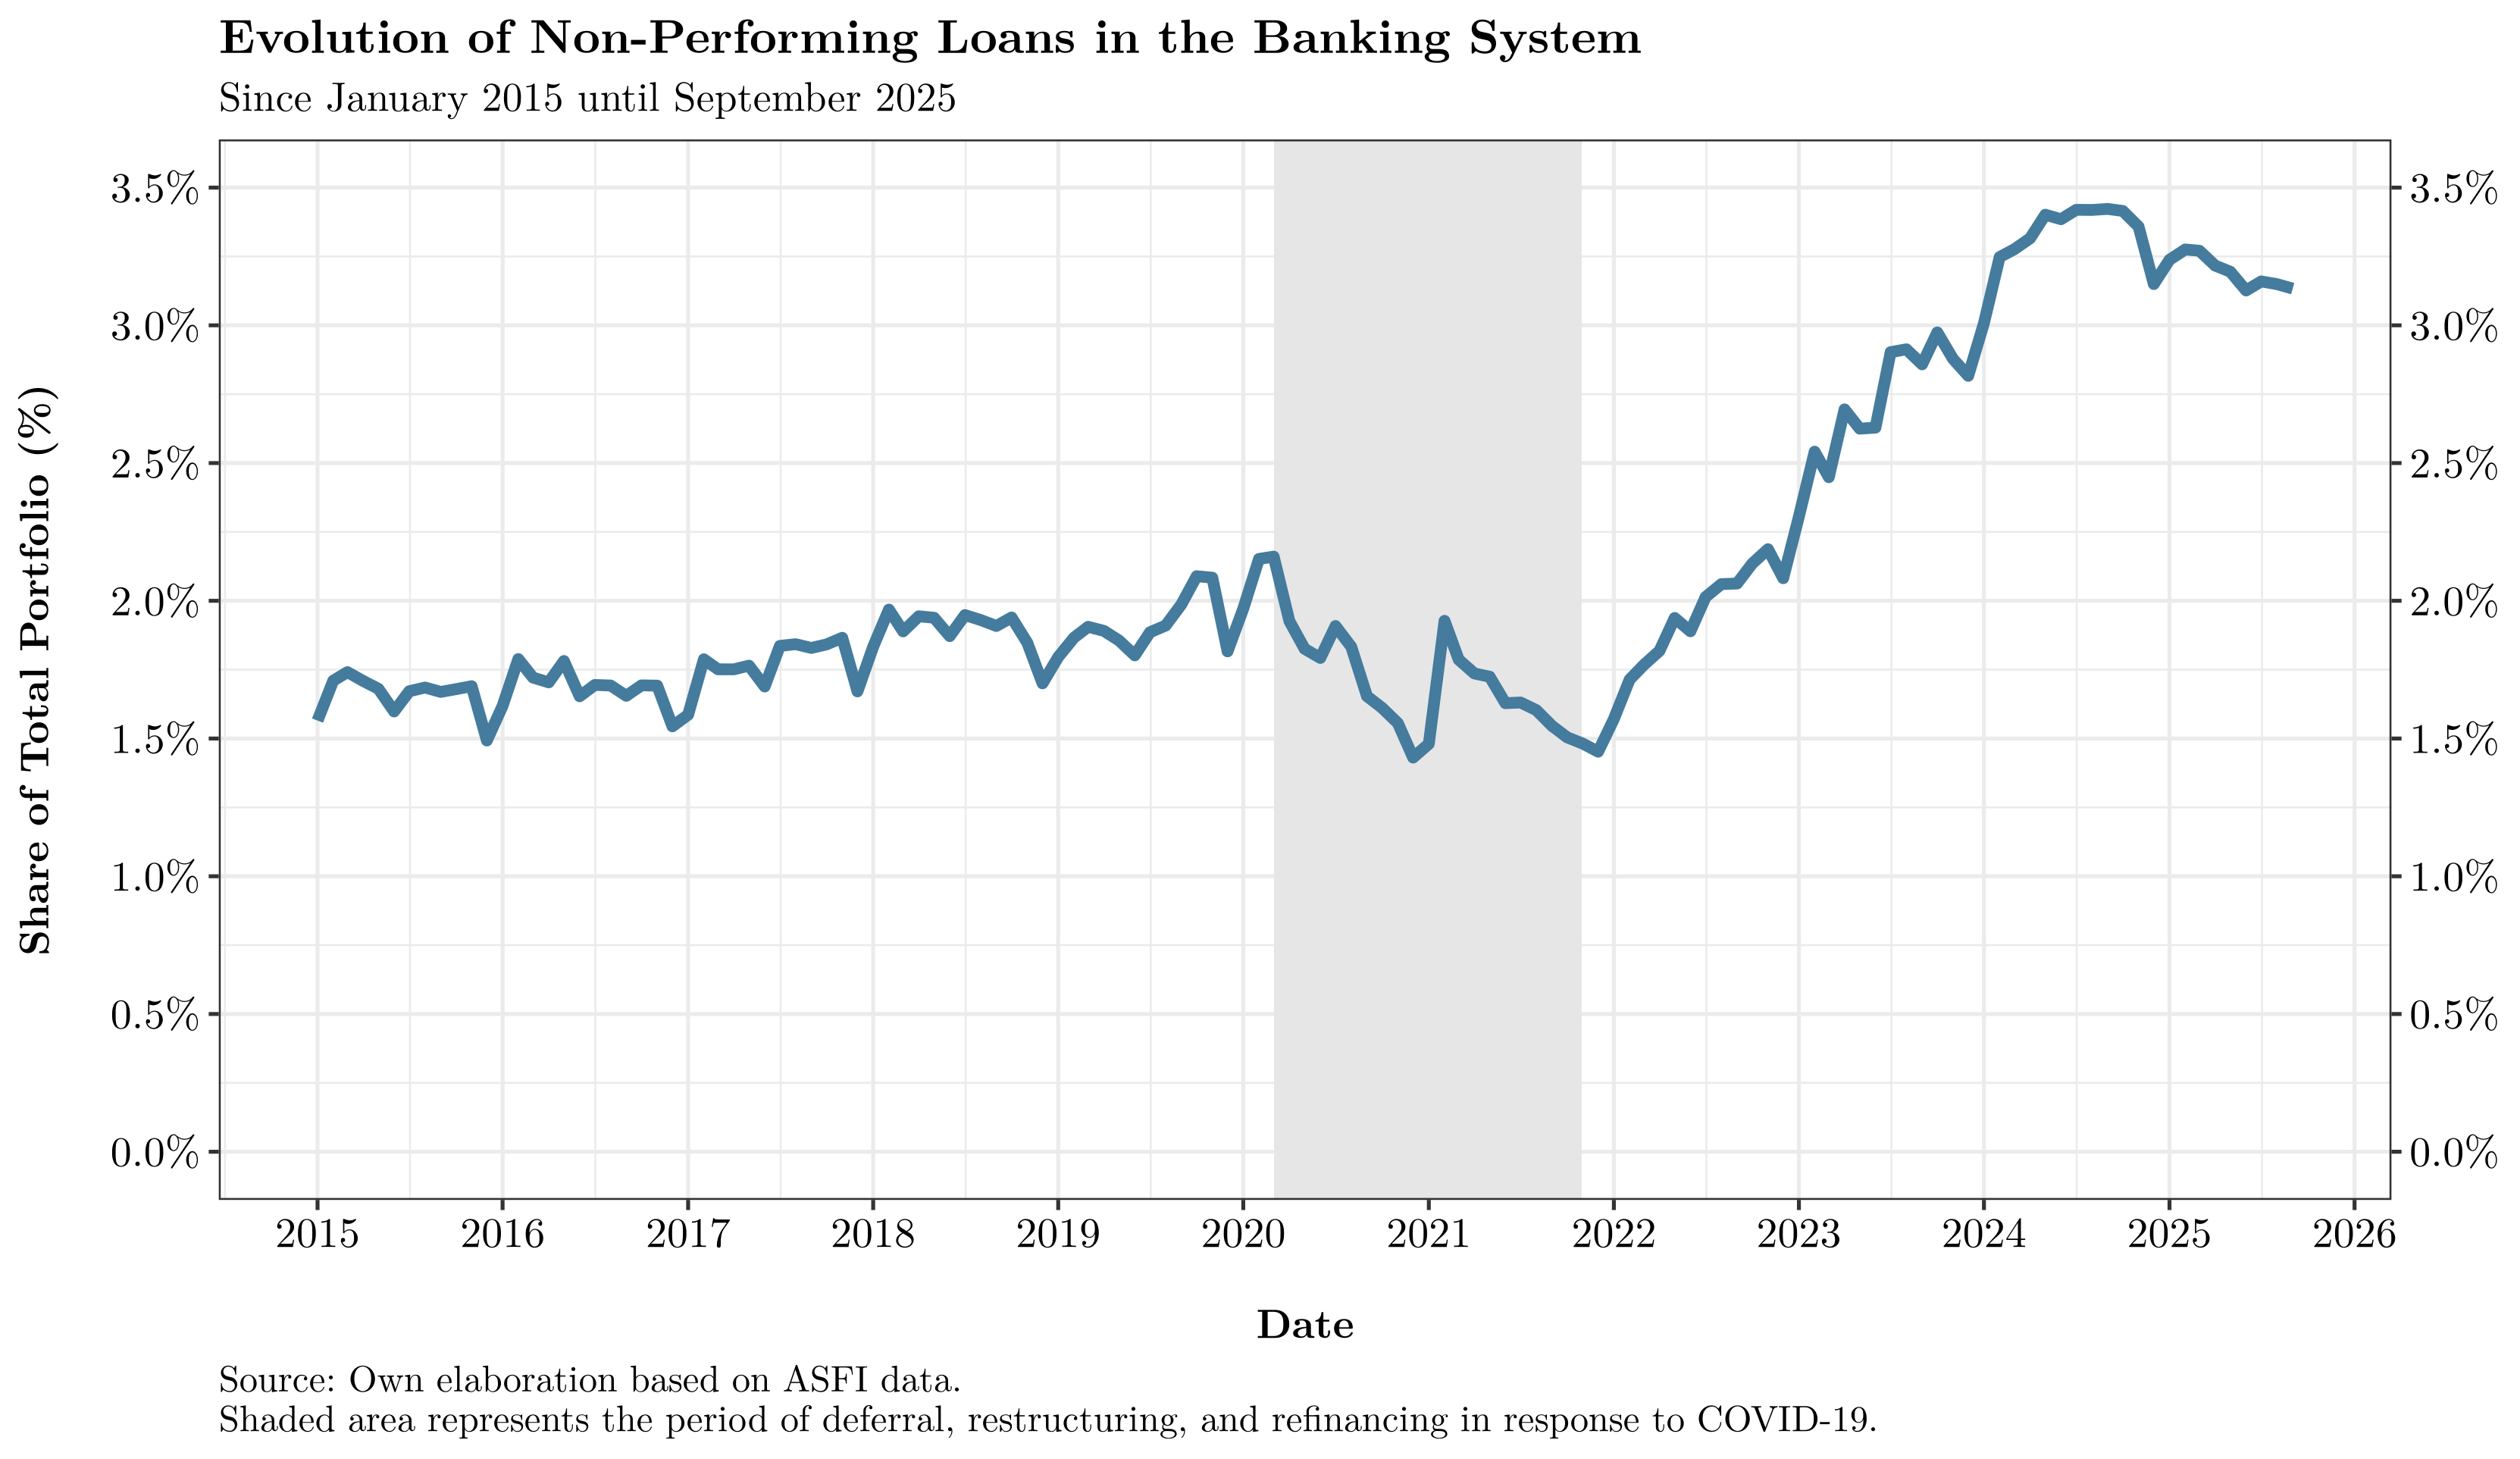
Curiously, the NPL ratio began to fall in late 2024—even as the loan book (and the economy) lost momentum. Several factors could be at play: stricter underwriting, borrowers prioritizing debt service, or a portion of distressed loans being reprogrammed—thus not counted as NPLs but rather as current reprogrammed.
Separating NPLs originating from reprogrammed loans versus others shows that most current NPLs stem from the former; reprogrammed credit is driving a large share of portfolio risk:

By institution:
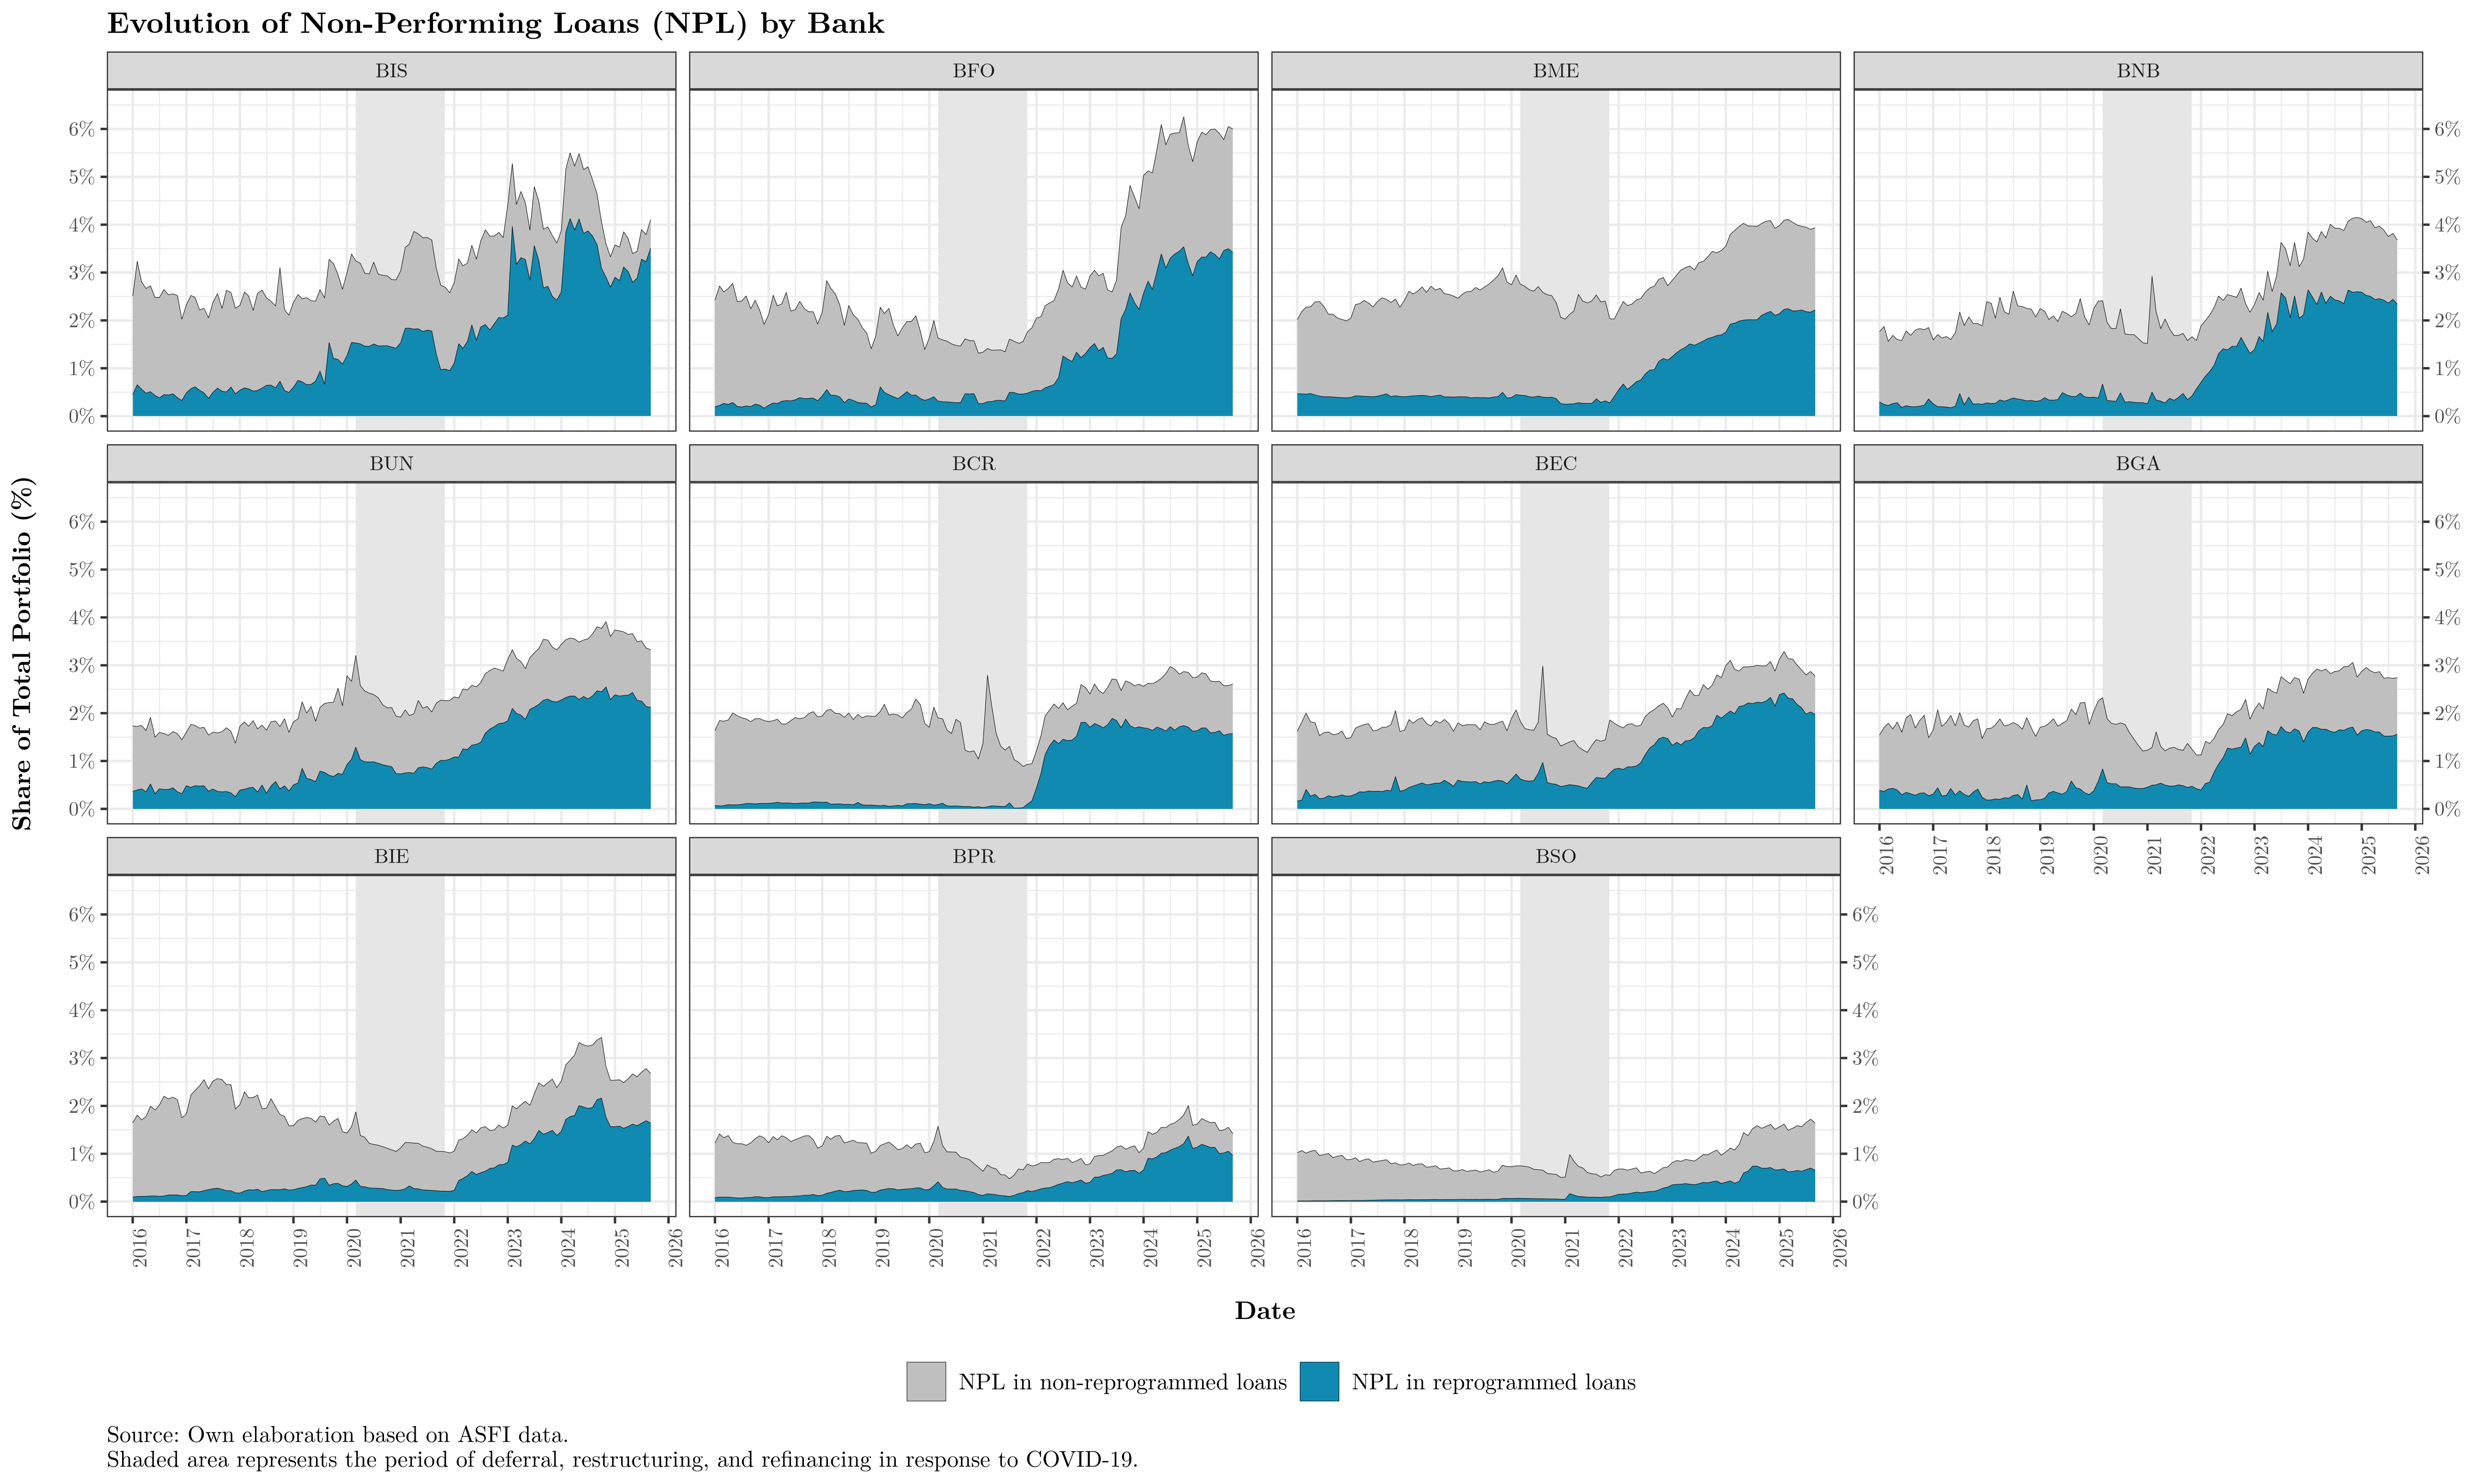
Some banks—Bisa, Económico, Prodem—now display NPLs concentrated almost entirely in reprogrammed portfolios. Pre-pandemic, the opposite was typical: missed payments were classified as delinquent without necessarily undergoing reprogramming. Either newly originated loans are performing unusually well (unlikely in today’s context) or banks are systematically reprogramming, which could be problematic if reprogrammed portfolios are not sustainable. We return to this issue below.
By credit type:
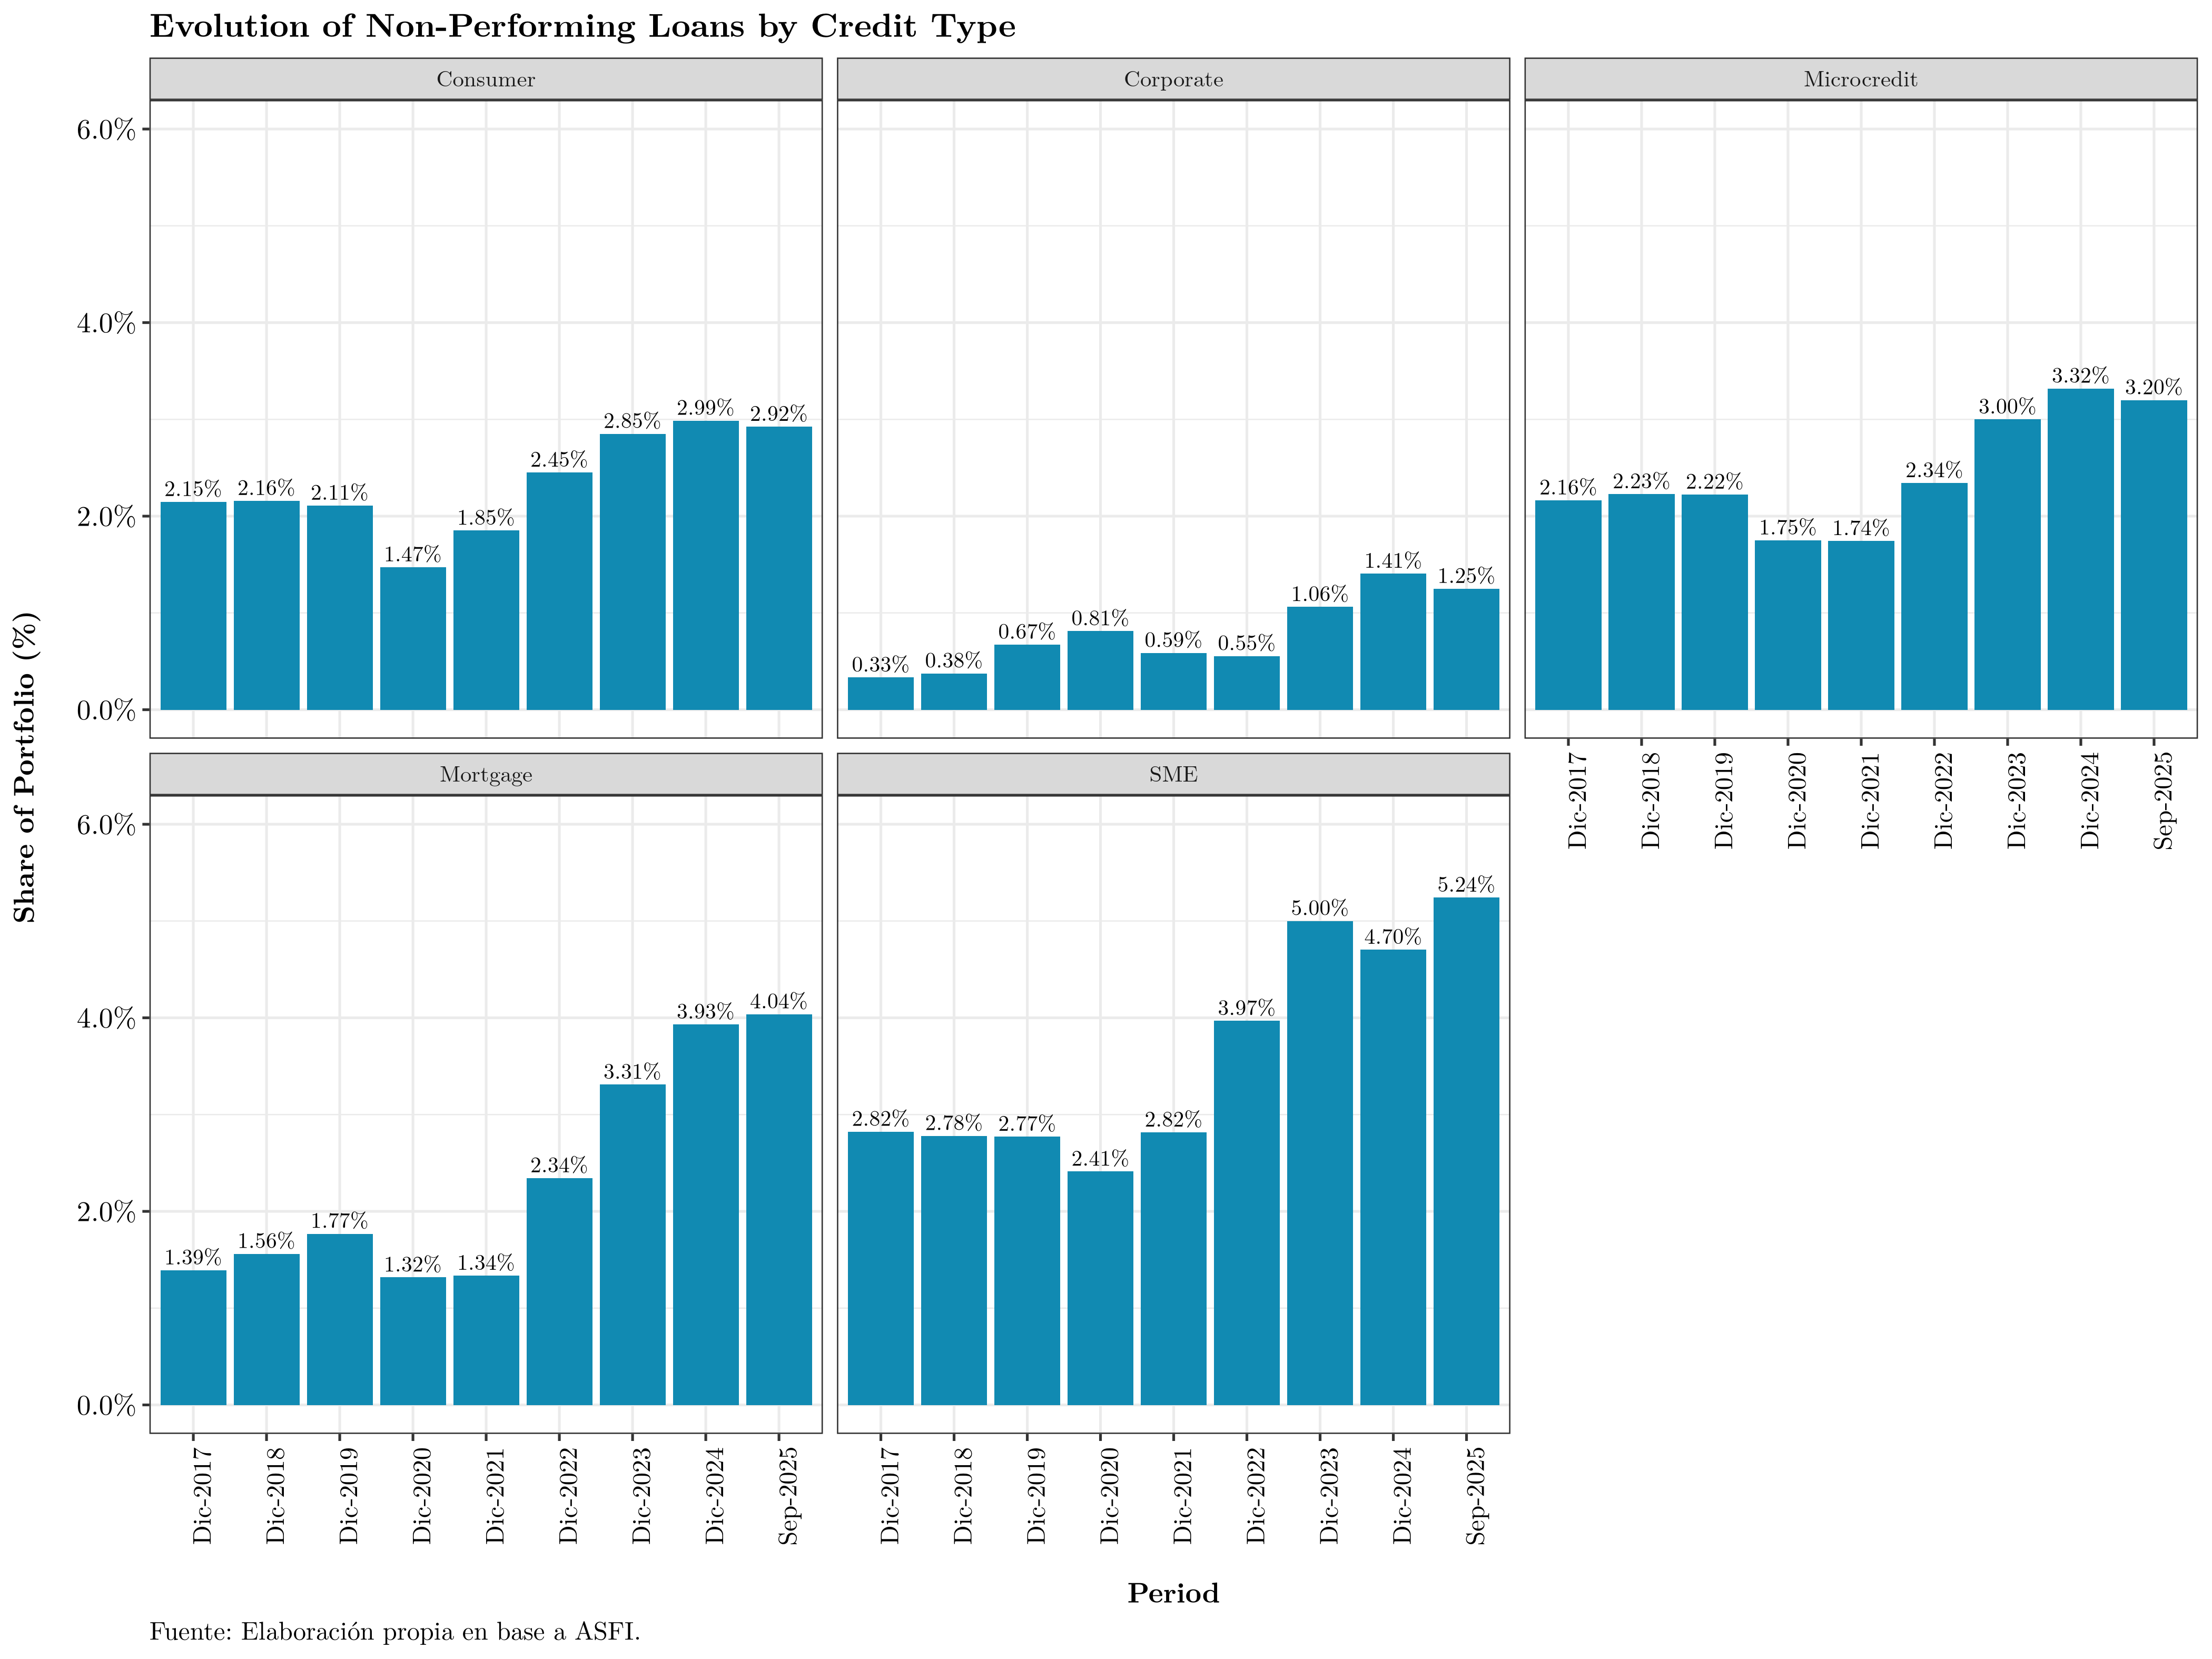
Except for corporate loans, NPLs have risen materially across segments, especially mortgage and SME.
Finally, NPLs by institution and credit type:
Reprogrammed portfolio
Reprogrammed loans—structurally more prone to default—remain around 15% of total loans. While some institutions have reduced this share, others continue to rely on reprogramming. As noted last year: “In the past, loans were reprogrammed when the borrower indicated a (perhaps temporary) inability to pay. Case by case, institutions adjusted schedules—lower rates, longer terms, smaller installments—to prevent deterioration. Today, however, a borrower’s current inability to pay raises the risk that they will not be able to do so in the future.”
First, the reprogrammed portfolio has declined in recent months as some loans mature and overall portfolios continue to grow:

The issue is that reprogrammed loans are more likely to become delinquent, having already signaled strain. It is crucial to monitor not only problematic reprogrammed loans but the entire reprogrammed stock. Below we show the reprogrammed portfolio in USD millions, by status:
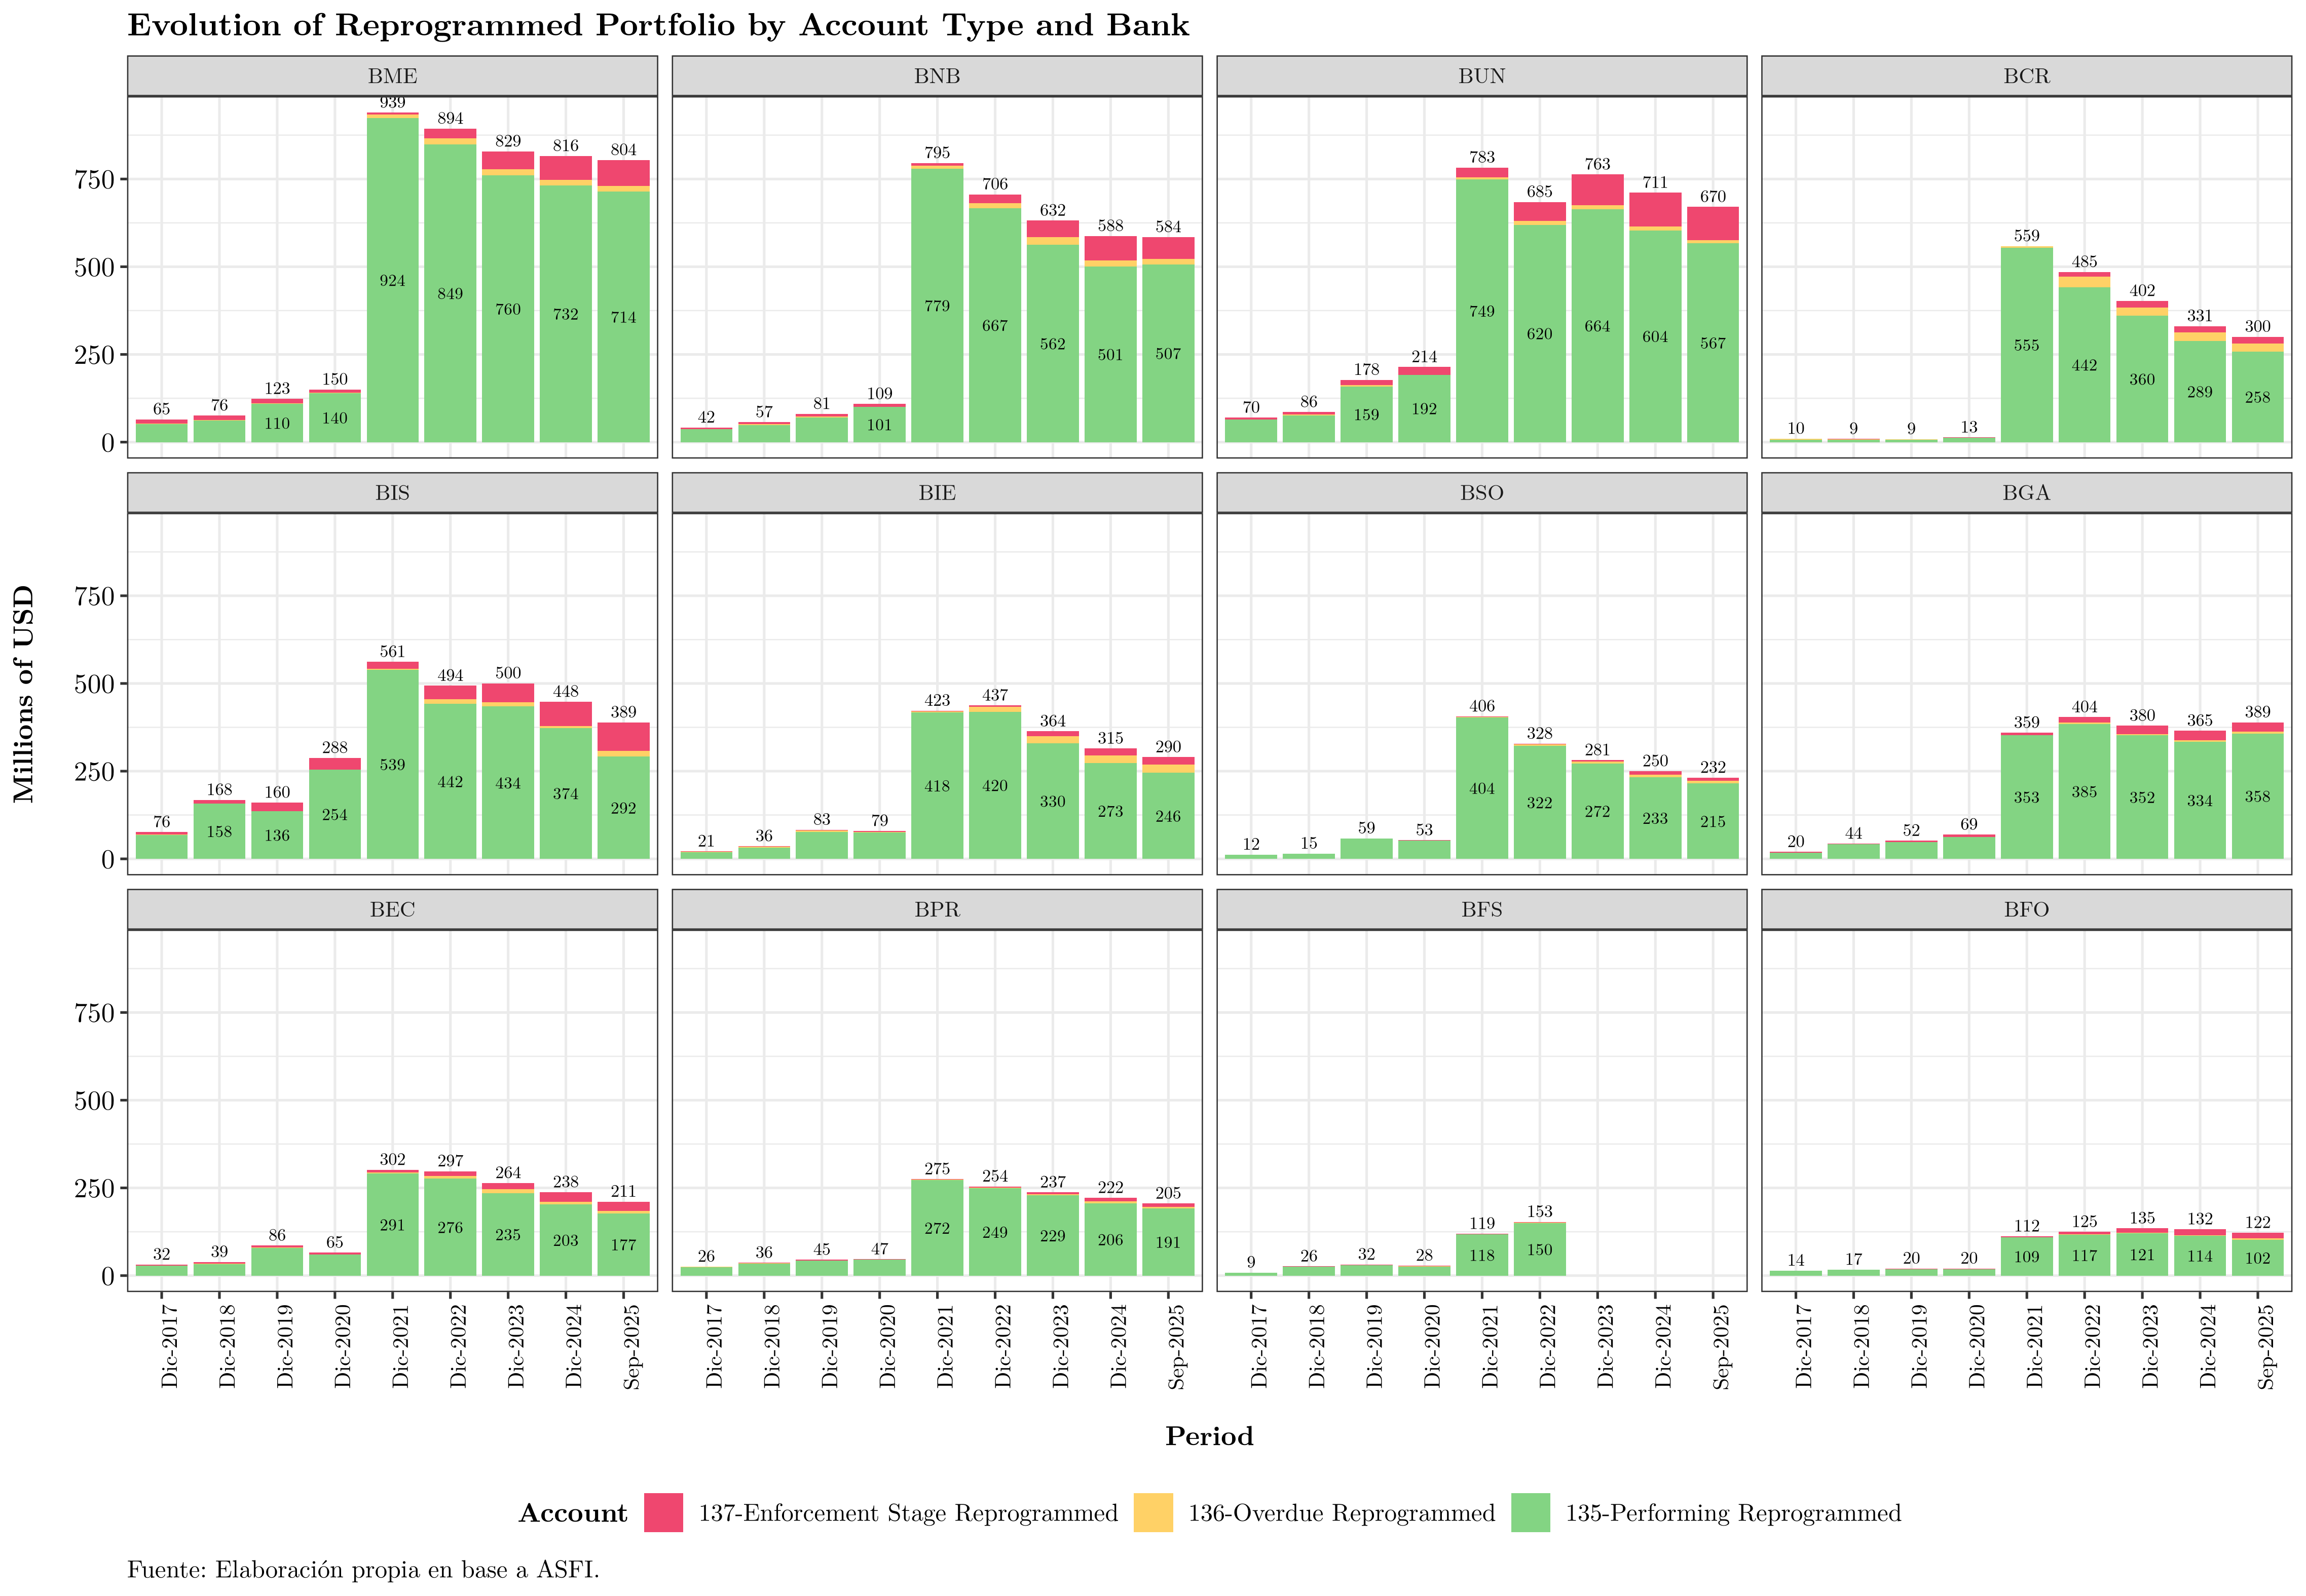
The area of concern is the current reprogrammed portfolio—the most likely to transition into NPLs—which, for some institutions, continues to grow.
Permanent investments
Per the Chart of Accounts:
“Permanent investments include deposits in financial intermediation entities, deposits at the Central Bank of Bolivia, debt securities acquired by the entity, and non-exchange-listed debt certificates issued by the public sector. These investments are not readily convertible to cash or, even if liquid, the entity intends to hold them for more than 30 days per its investment policy.”
Composition
The next chart shows the composition of permanent investments by account:

The largest concentration is in account 167 (restricted-availability investments): “securities issued by domestic or foreign entities whose availability is restricted as of the reporting date due to a repurchase agreement, additional reserve requirement, collateralization, etc.”
By institution:

These permanent investments mainly comprise contributions to BCB-managed funds (CPVIS, CAPROSEN, FIUSEER, etc.) created when foreign-currency reserve requirements were reduced for banks. Although these funds are to be returned to banks in U.S. dollars, they have not been fully repaid, raising concerns within the financial system.
Liabilities
Liabilities are a vital source of bank funding—obligations to the public (deposits), to firms (current accounts), and to institutional investors.
In recent months, speculation about banks’ capacity to return deposits has led some clients to withdraw funds, creating liquidity challenges that institutions needed to address quickly.
The next chart shows the evolution of system liabilities at each December since 2015, plus the latest quarter:
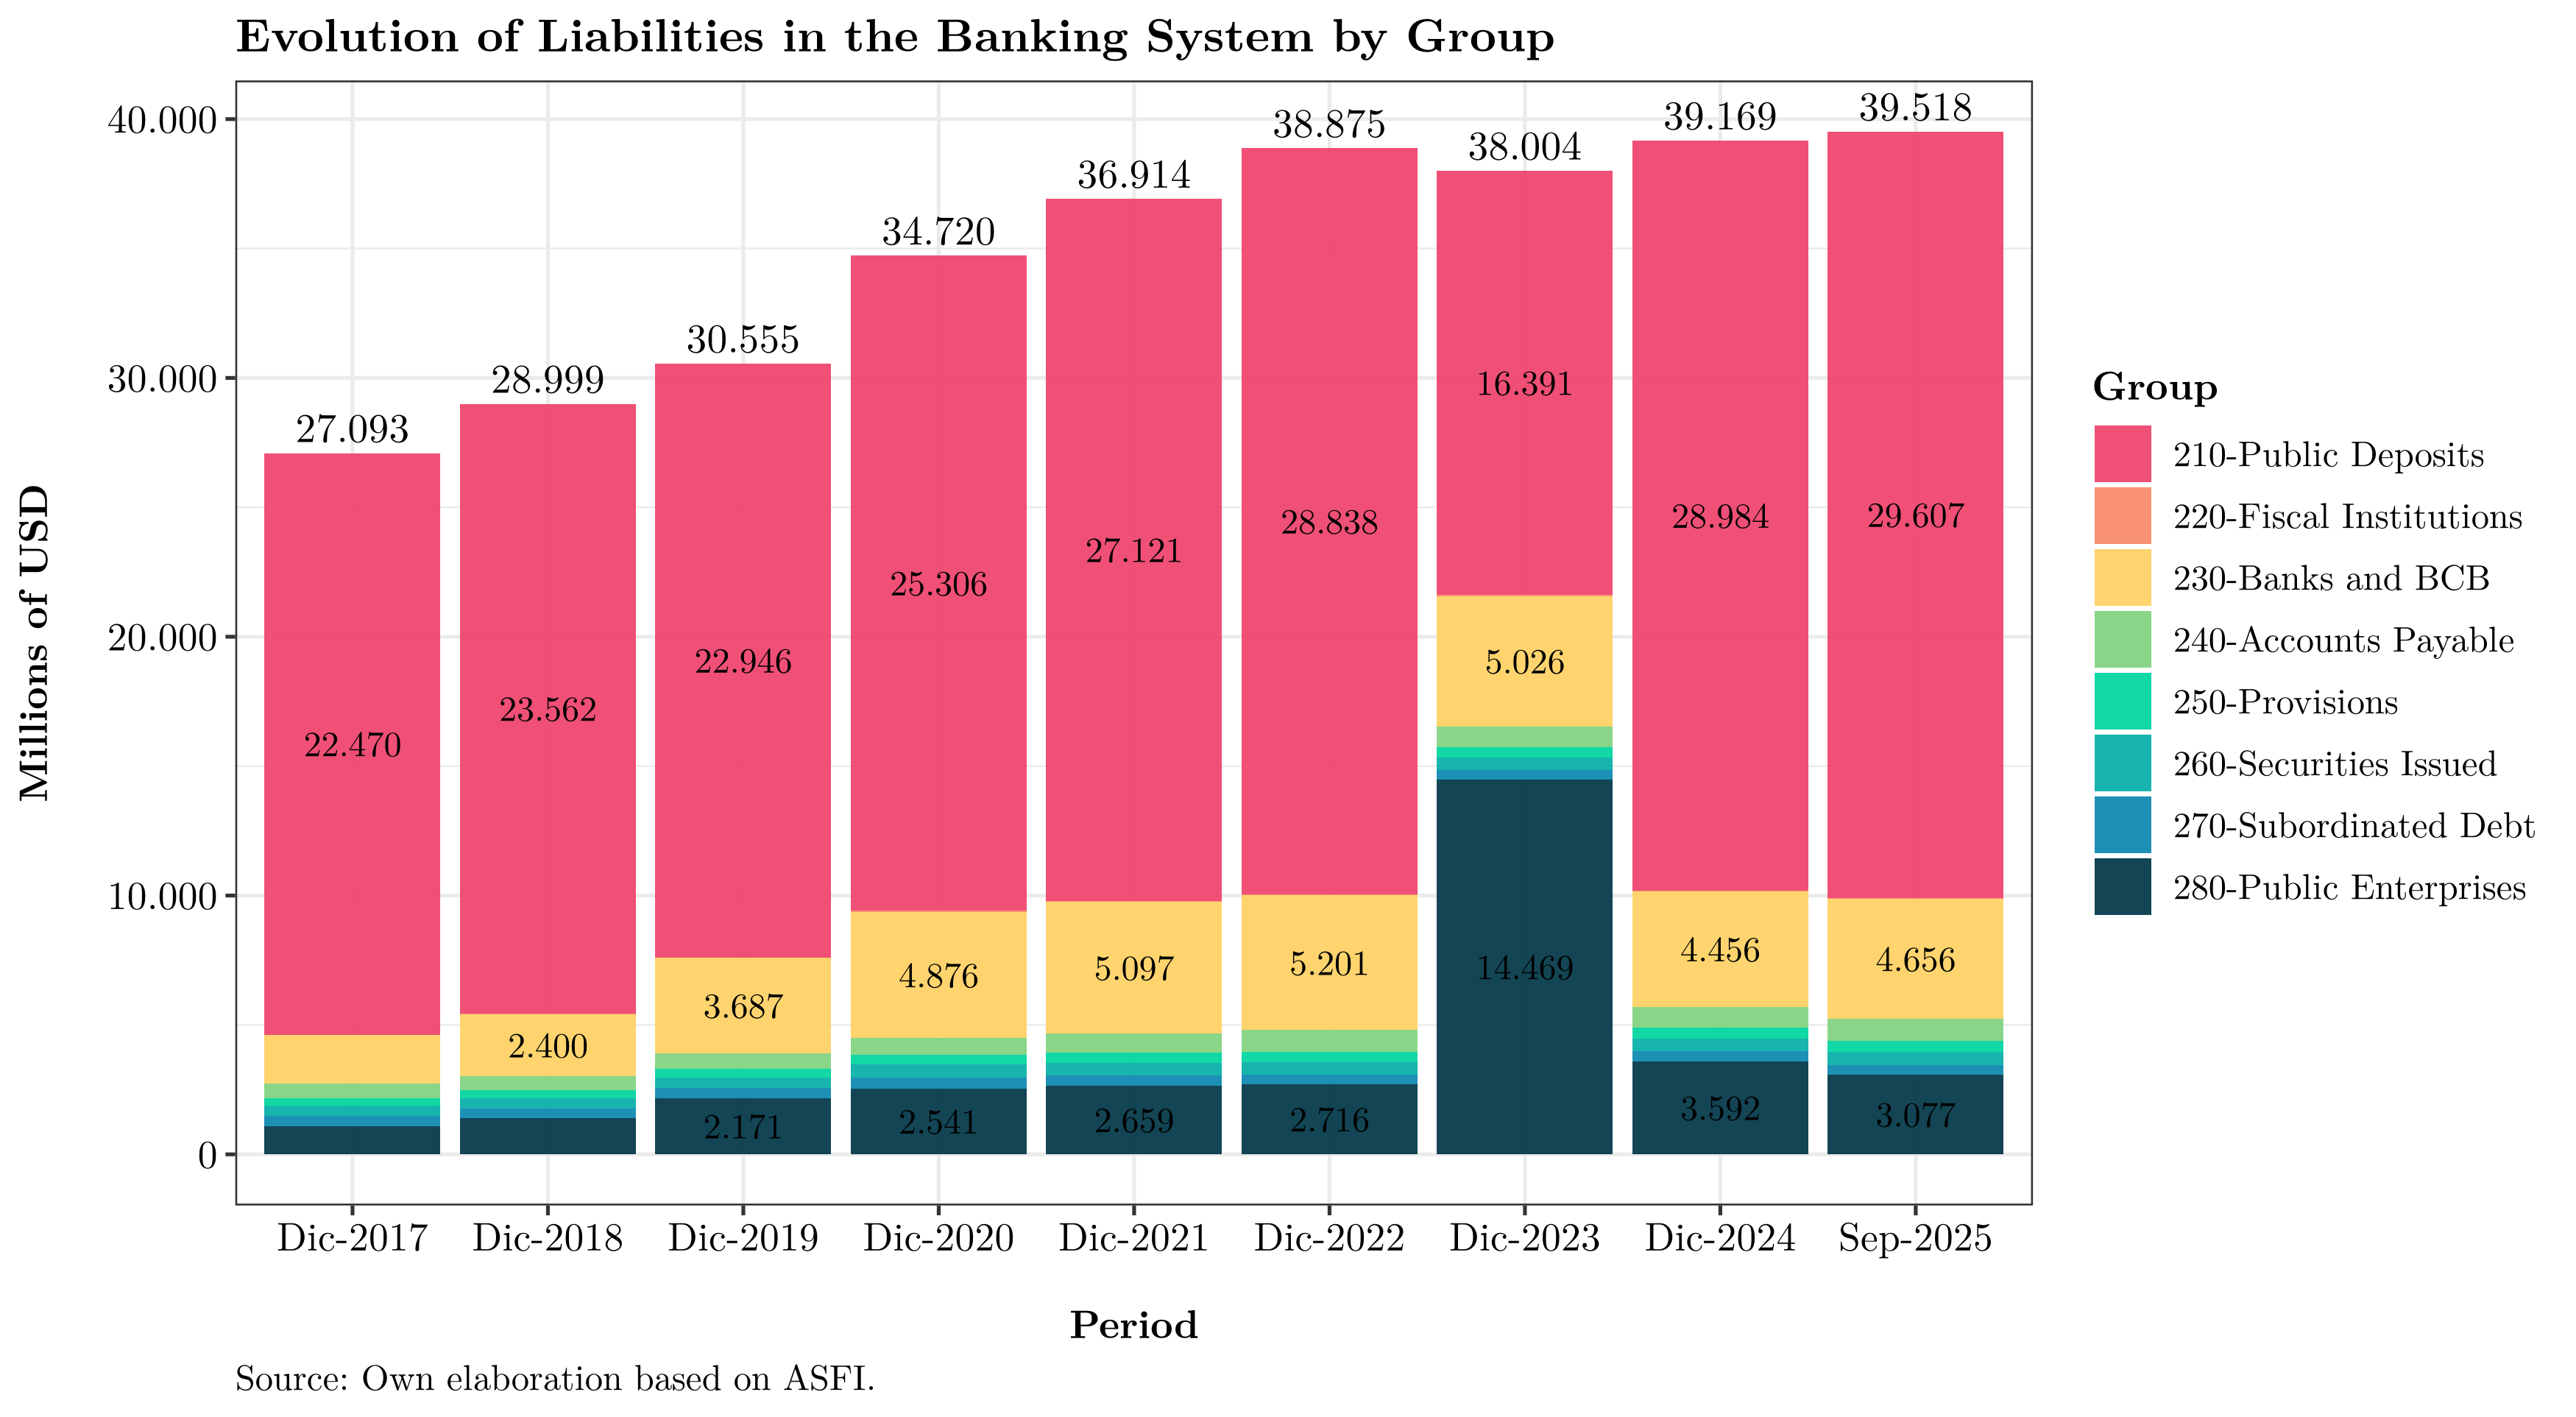
From December 2023, account 280 (public enterprises) rose due to a reclassification from the pension fund administrators (AFPs) to the state-run Gestora Pública (which now manages pension assets). Nearly 40% of banking system funding became concentrated in a single entity—posing liquidity management risks given its market power. This reclassification was later reversed; with available data it is not possible to precisely gauge the Gestora’s current weight in bank funding.
During the year, total liabilities grew by USD 349 million versus December 2024. If banks cannot attract deposits, they cannot sustain loan growth, their core business. Options include raising deposit rates to attract funding or negotiating liquidity directly with the Gestora—again at higher rates. Either way, given regulated lending rates on social housing and productive credit, higher funding costs imply margin compression and lower profitability.
Alternatively, liabilities can be reclassified by deposit type:
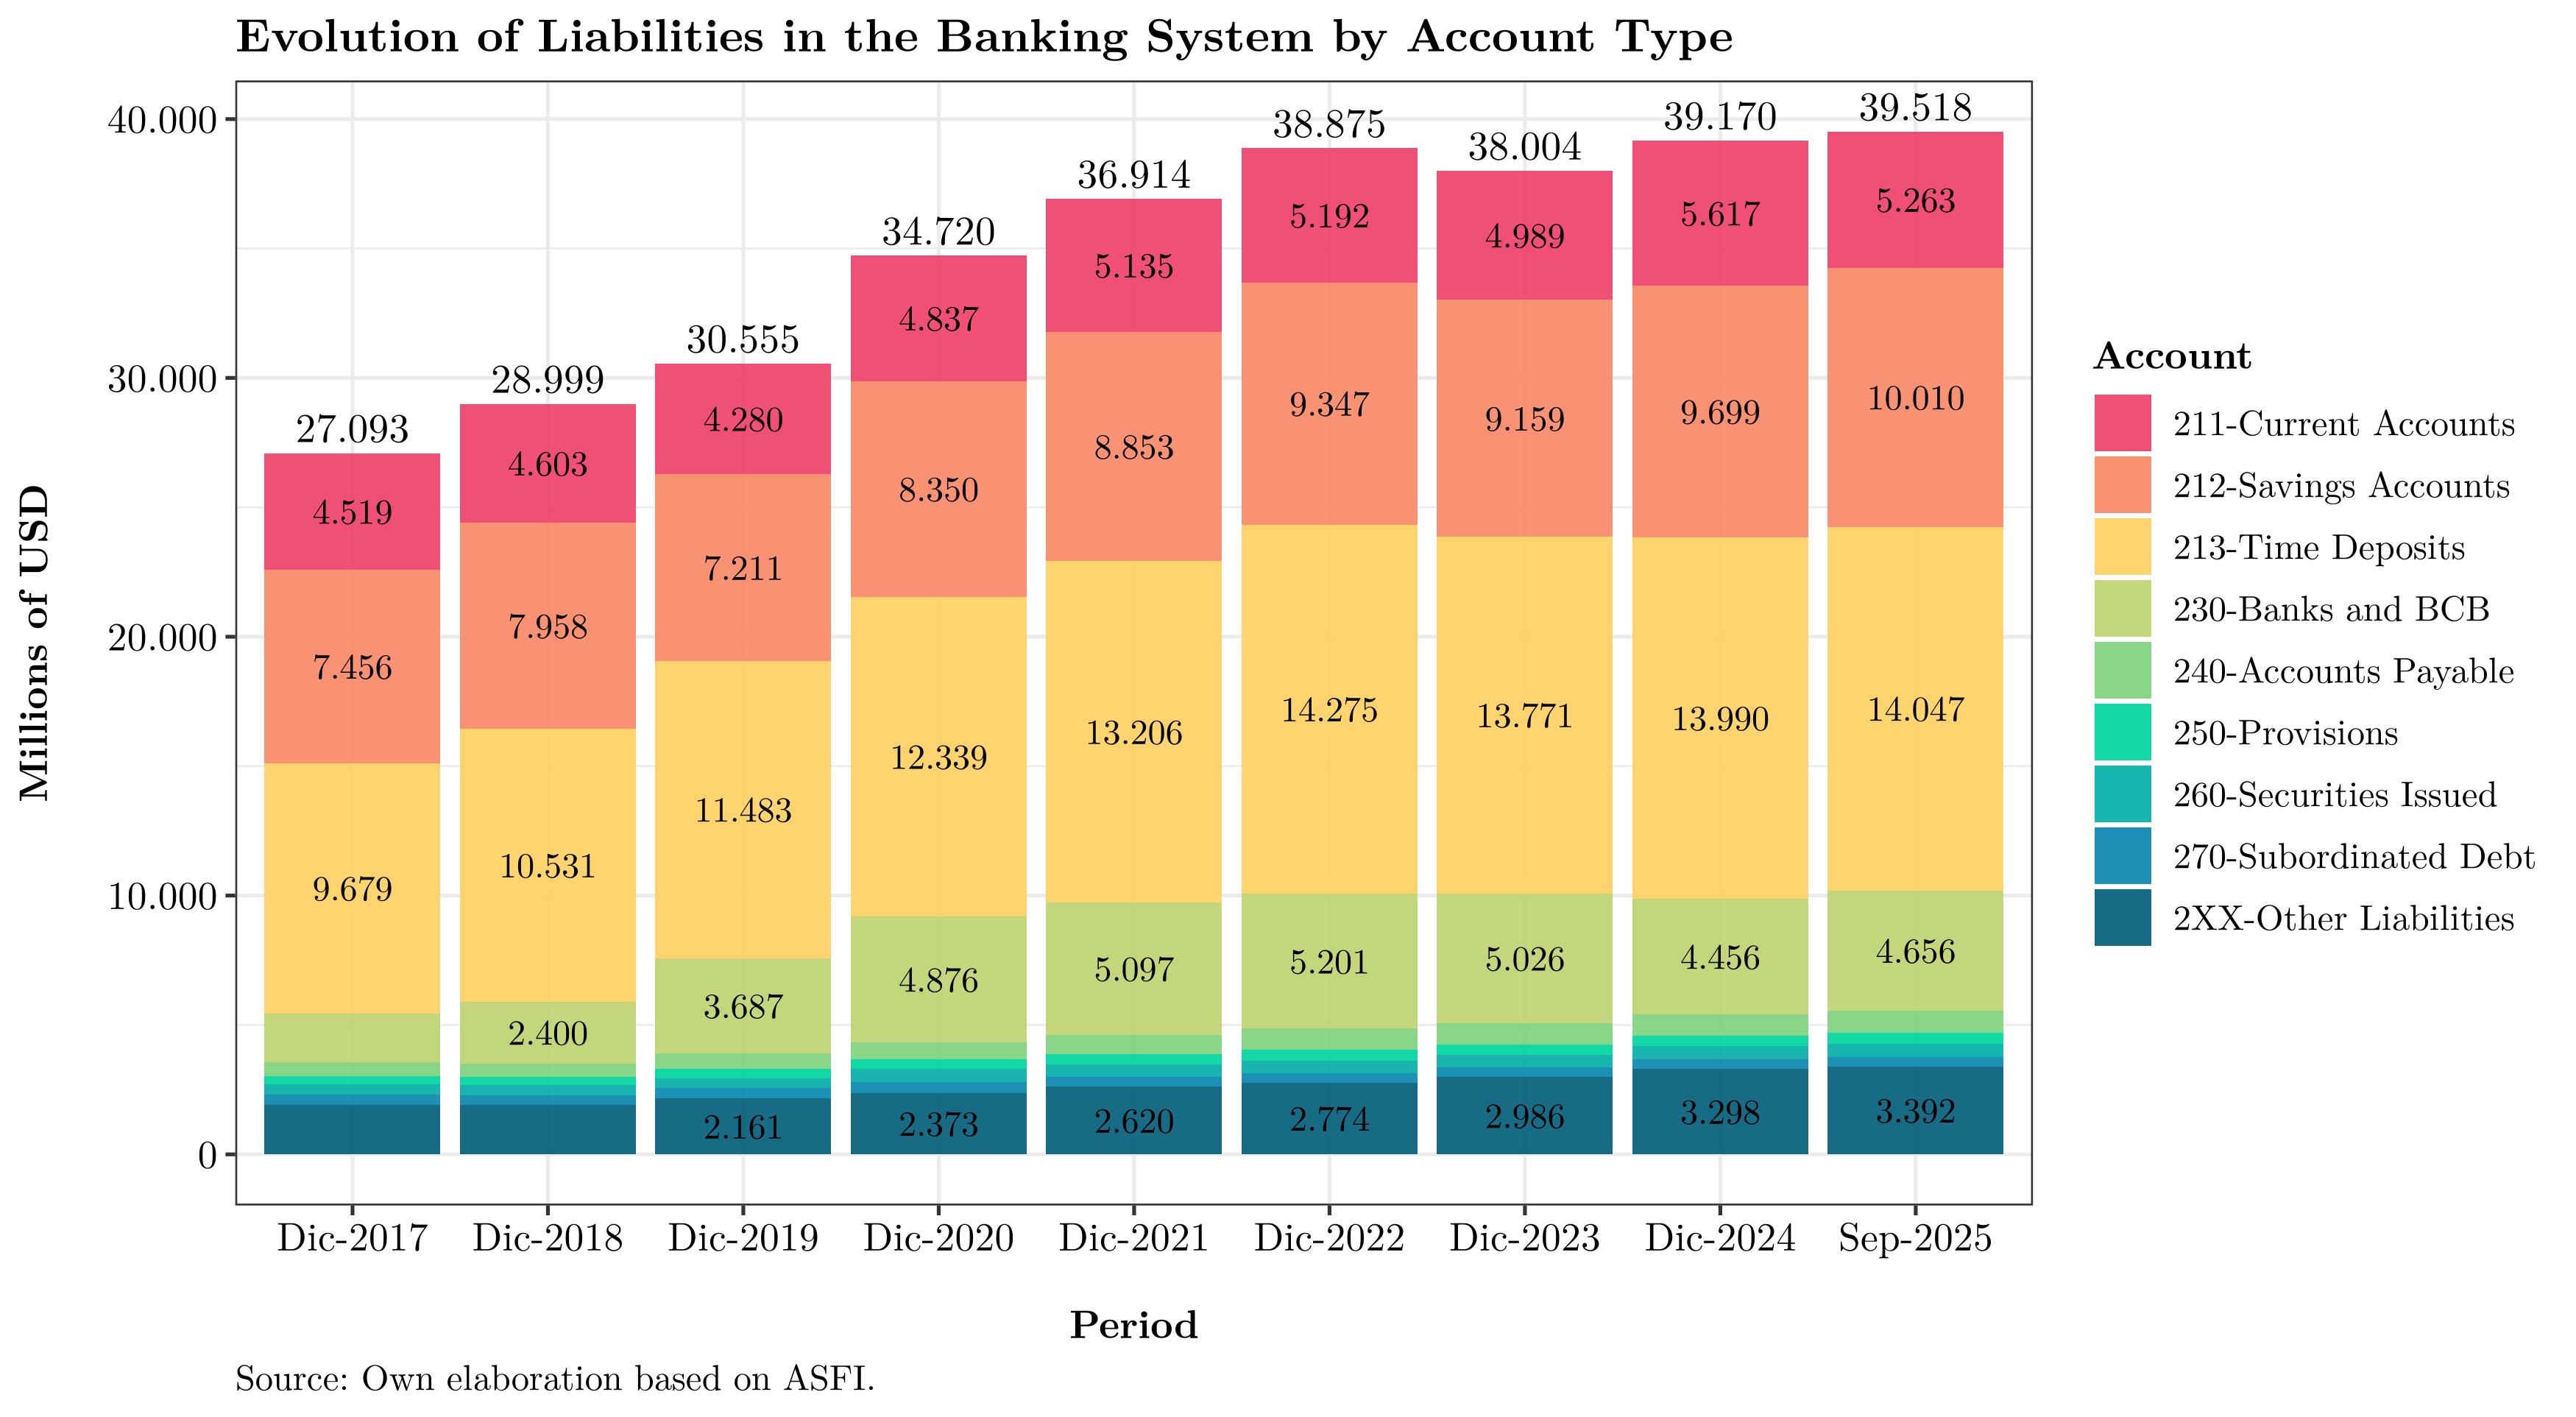
Current accounts—mostly corporate—contracted sharply year-to-date, offset by an increase in savings balances. Other categories remained relatively stable.
Growth
How have liabilities evolved? In general, the banking system’s liabilities have continued to grow YoY (month vs. same month a year earlier), but at declining rates:
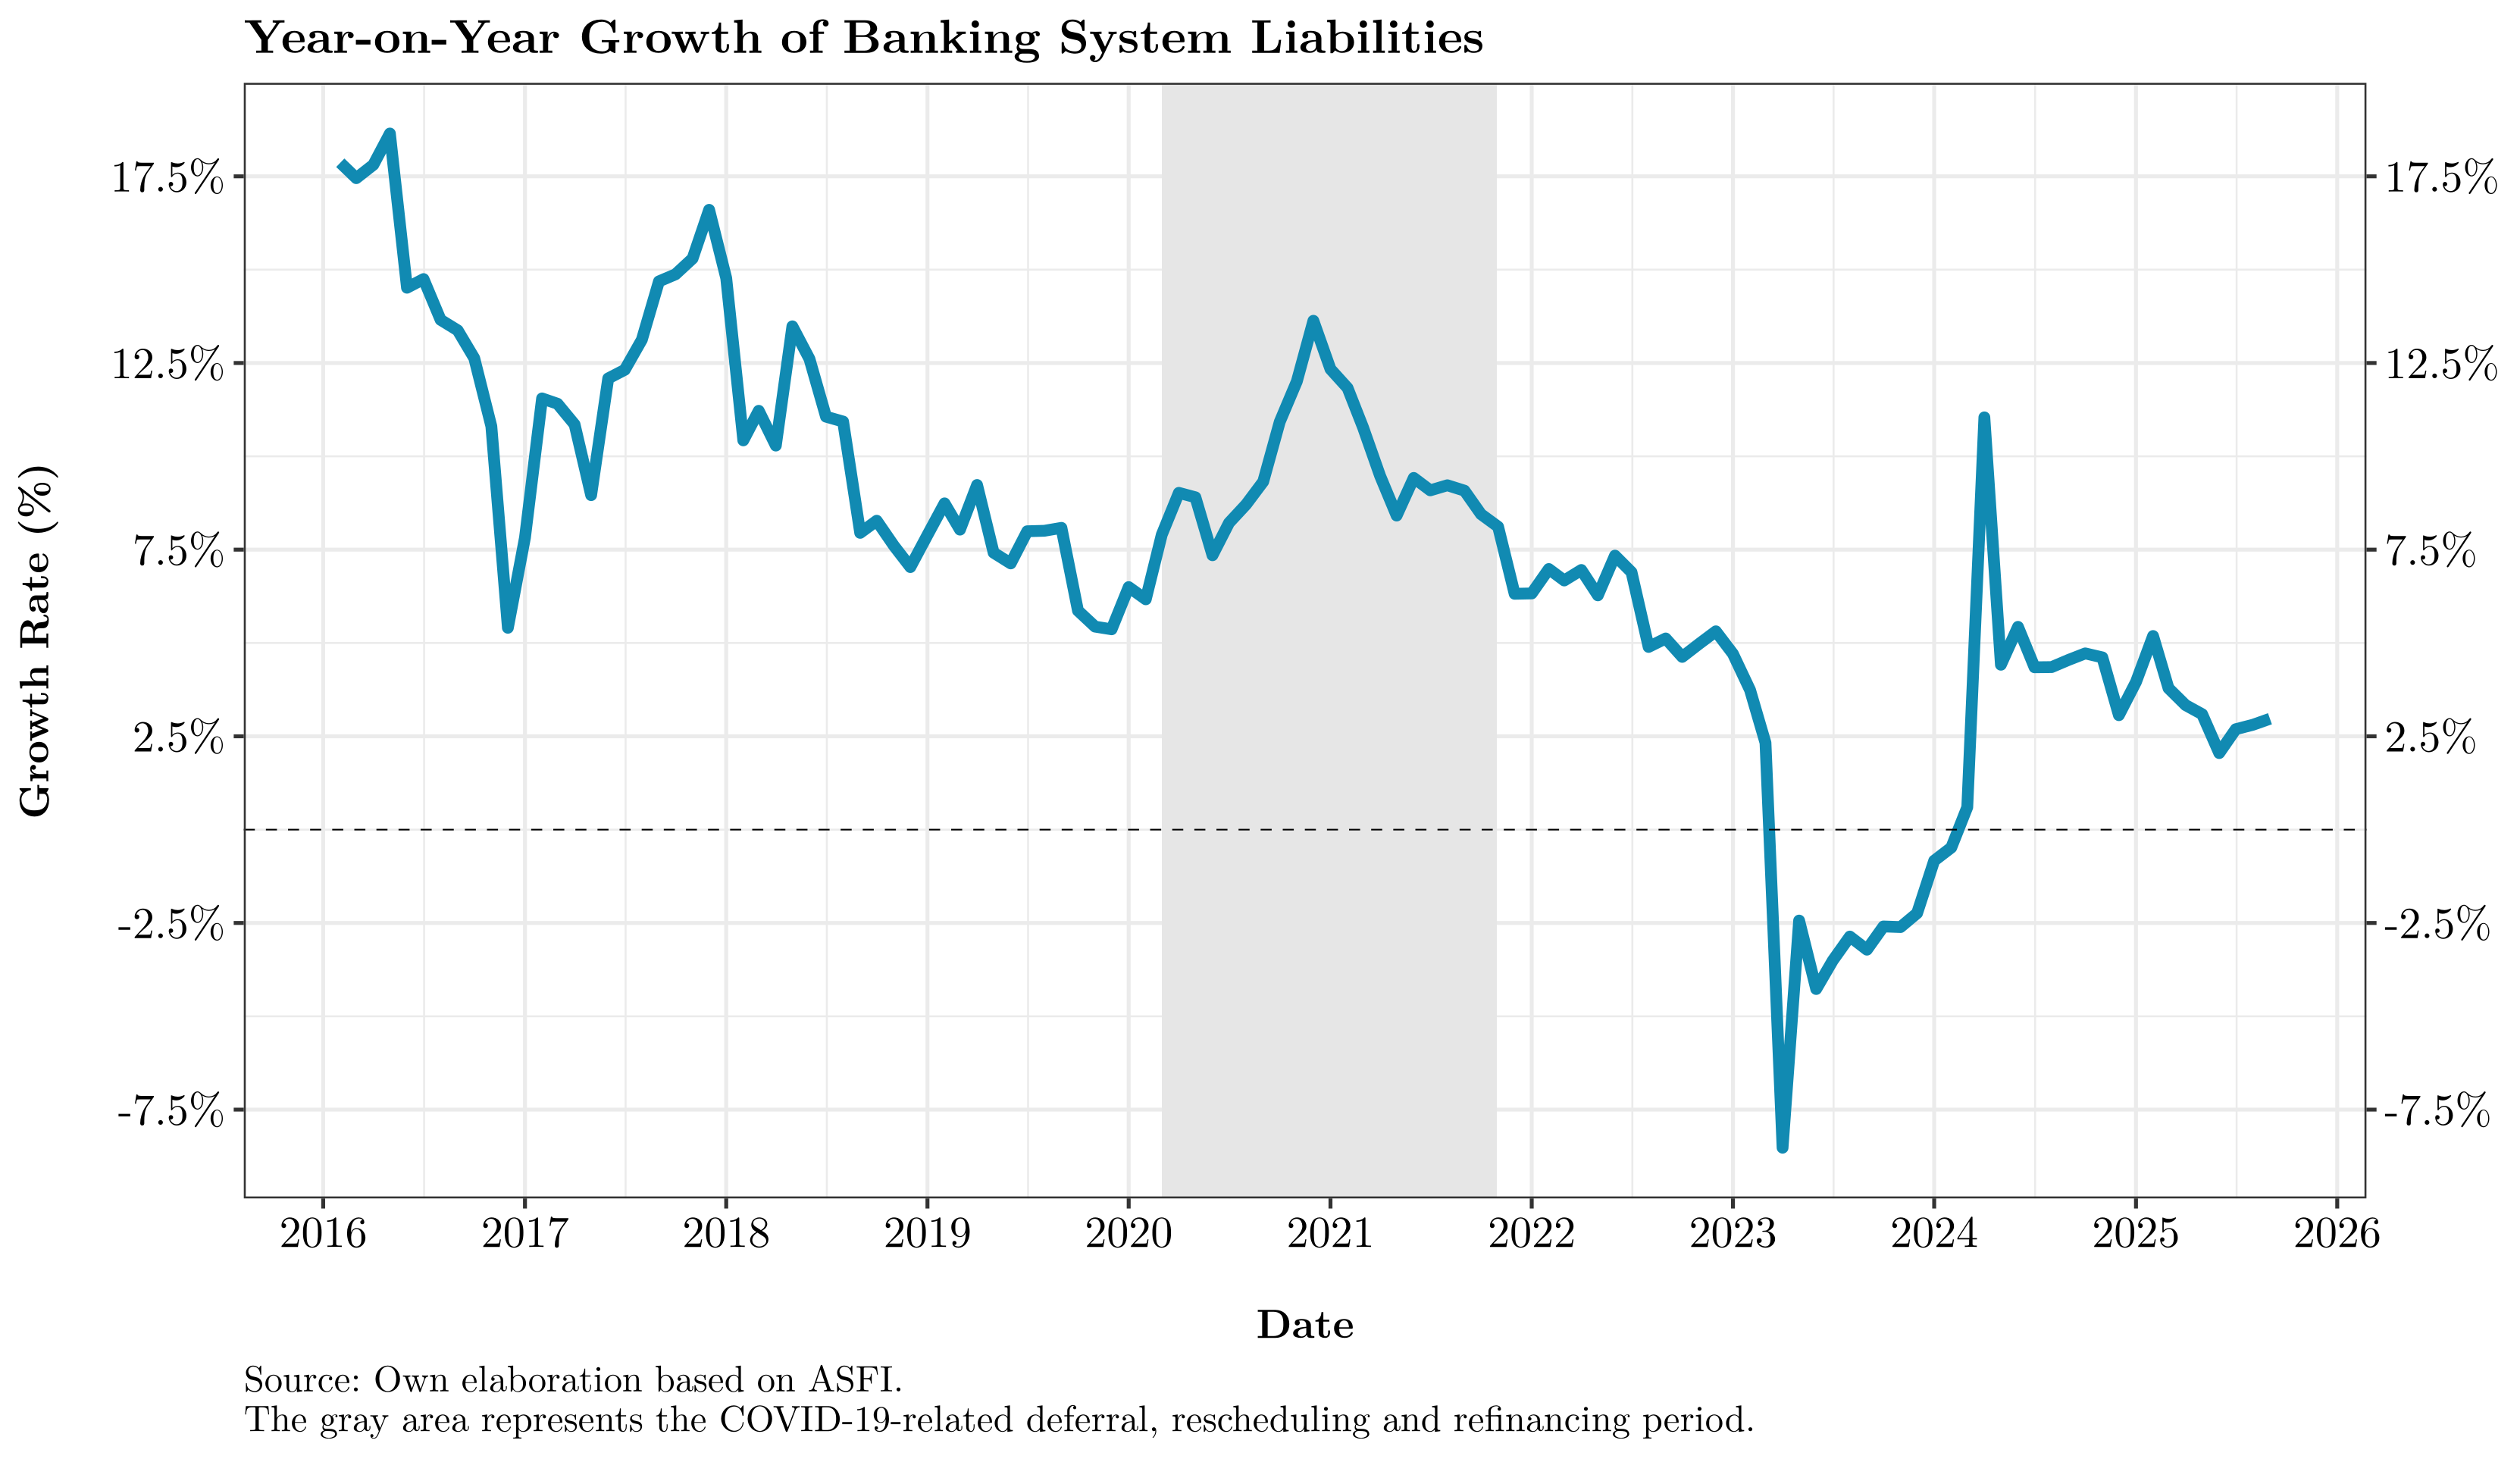
By institution:

Overall, institutions are finding it harder to attract funding. Some still show YoY growth, but others have seen liabilities contract.
Contribution to growth
As with assets, we can decompose YoY liability growth by category—the mirror image of the asset-side dynamics:

What does this imply? Before March 2023, time deposits led liability growth, followed by savings—more expensive but more stable, aiding asset-liability maturity matching. From March 2023 through year-end, current accounts turned negative, and time deposits followed suit toward the end of the year. From April 2024, liabilities resumed growth, now led by current accounts and, to a lesser extent, savings. While not intrinsically bad, this composition raises liquidity risk, as current and savings balances are more volatile than time deposits and prone to rapid withdrawals when confidence is shaken—as seen in 2023.
For the latest month, the YoY growth contribution by deposit type is:
| Deposit type | Contribution |
|---|---|
| 211-Current accounts | -0.5% |
| 212-Savings | 2.3% |
| 213-Time deposits | 0.2% |
| 2XX-Other liabilities | 1.0% |
| Total | 3.0% |
YoY growth by deposit type:
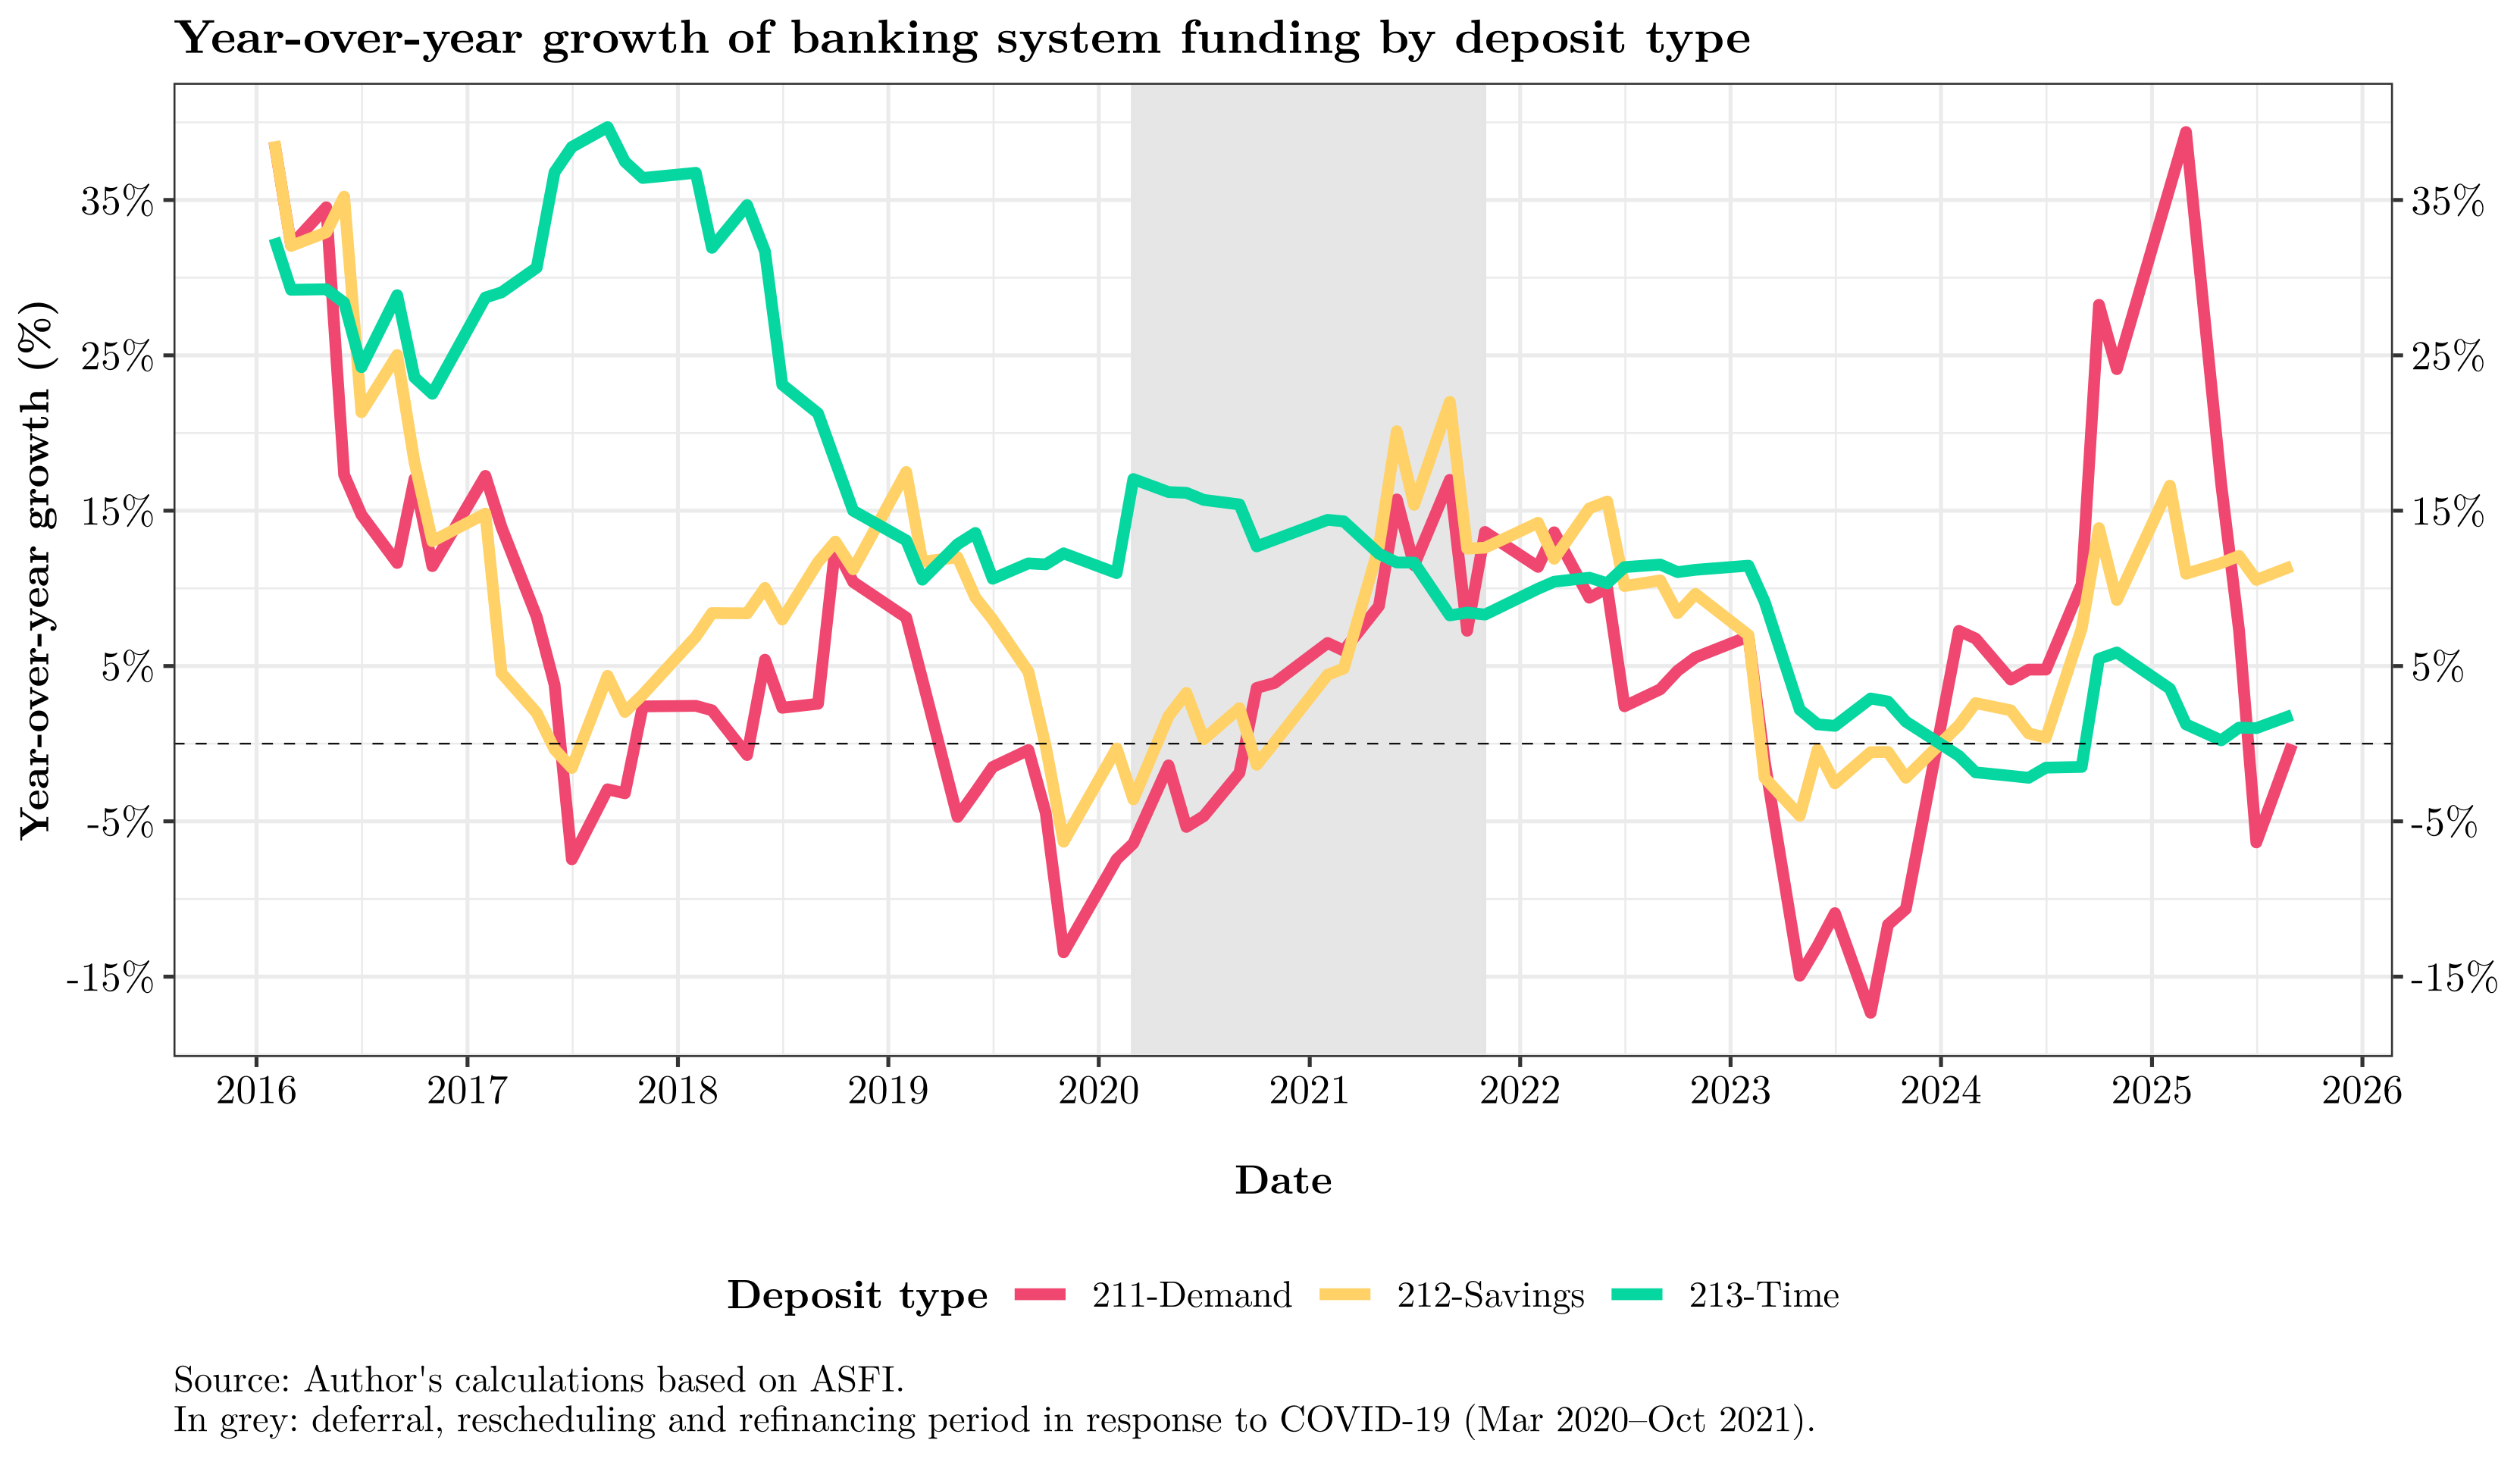
Aside from current accounts—which grew sharply and then fell abruptly—savings and time deposits have decelerated in recent months. Whether this pattern reflects public-sector flows (Gestora) or private-sector behavior (firms and households) is unclear, but banks are struggling to attract especially time deposits, constraining their ability to support loan growth.
Income statement
Without delving into full detail, the next figure presents financial results for the Bolivian banking system as of September for the last three years:
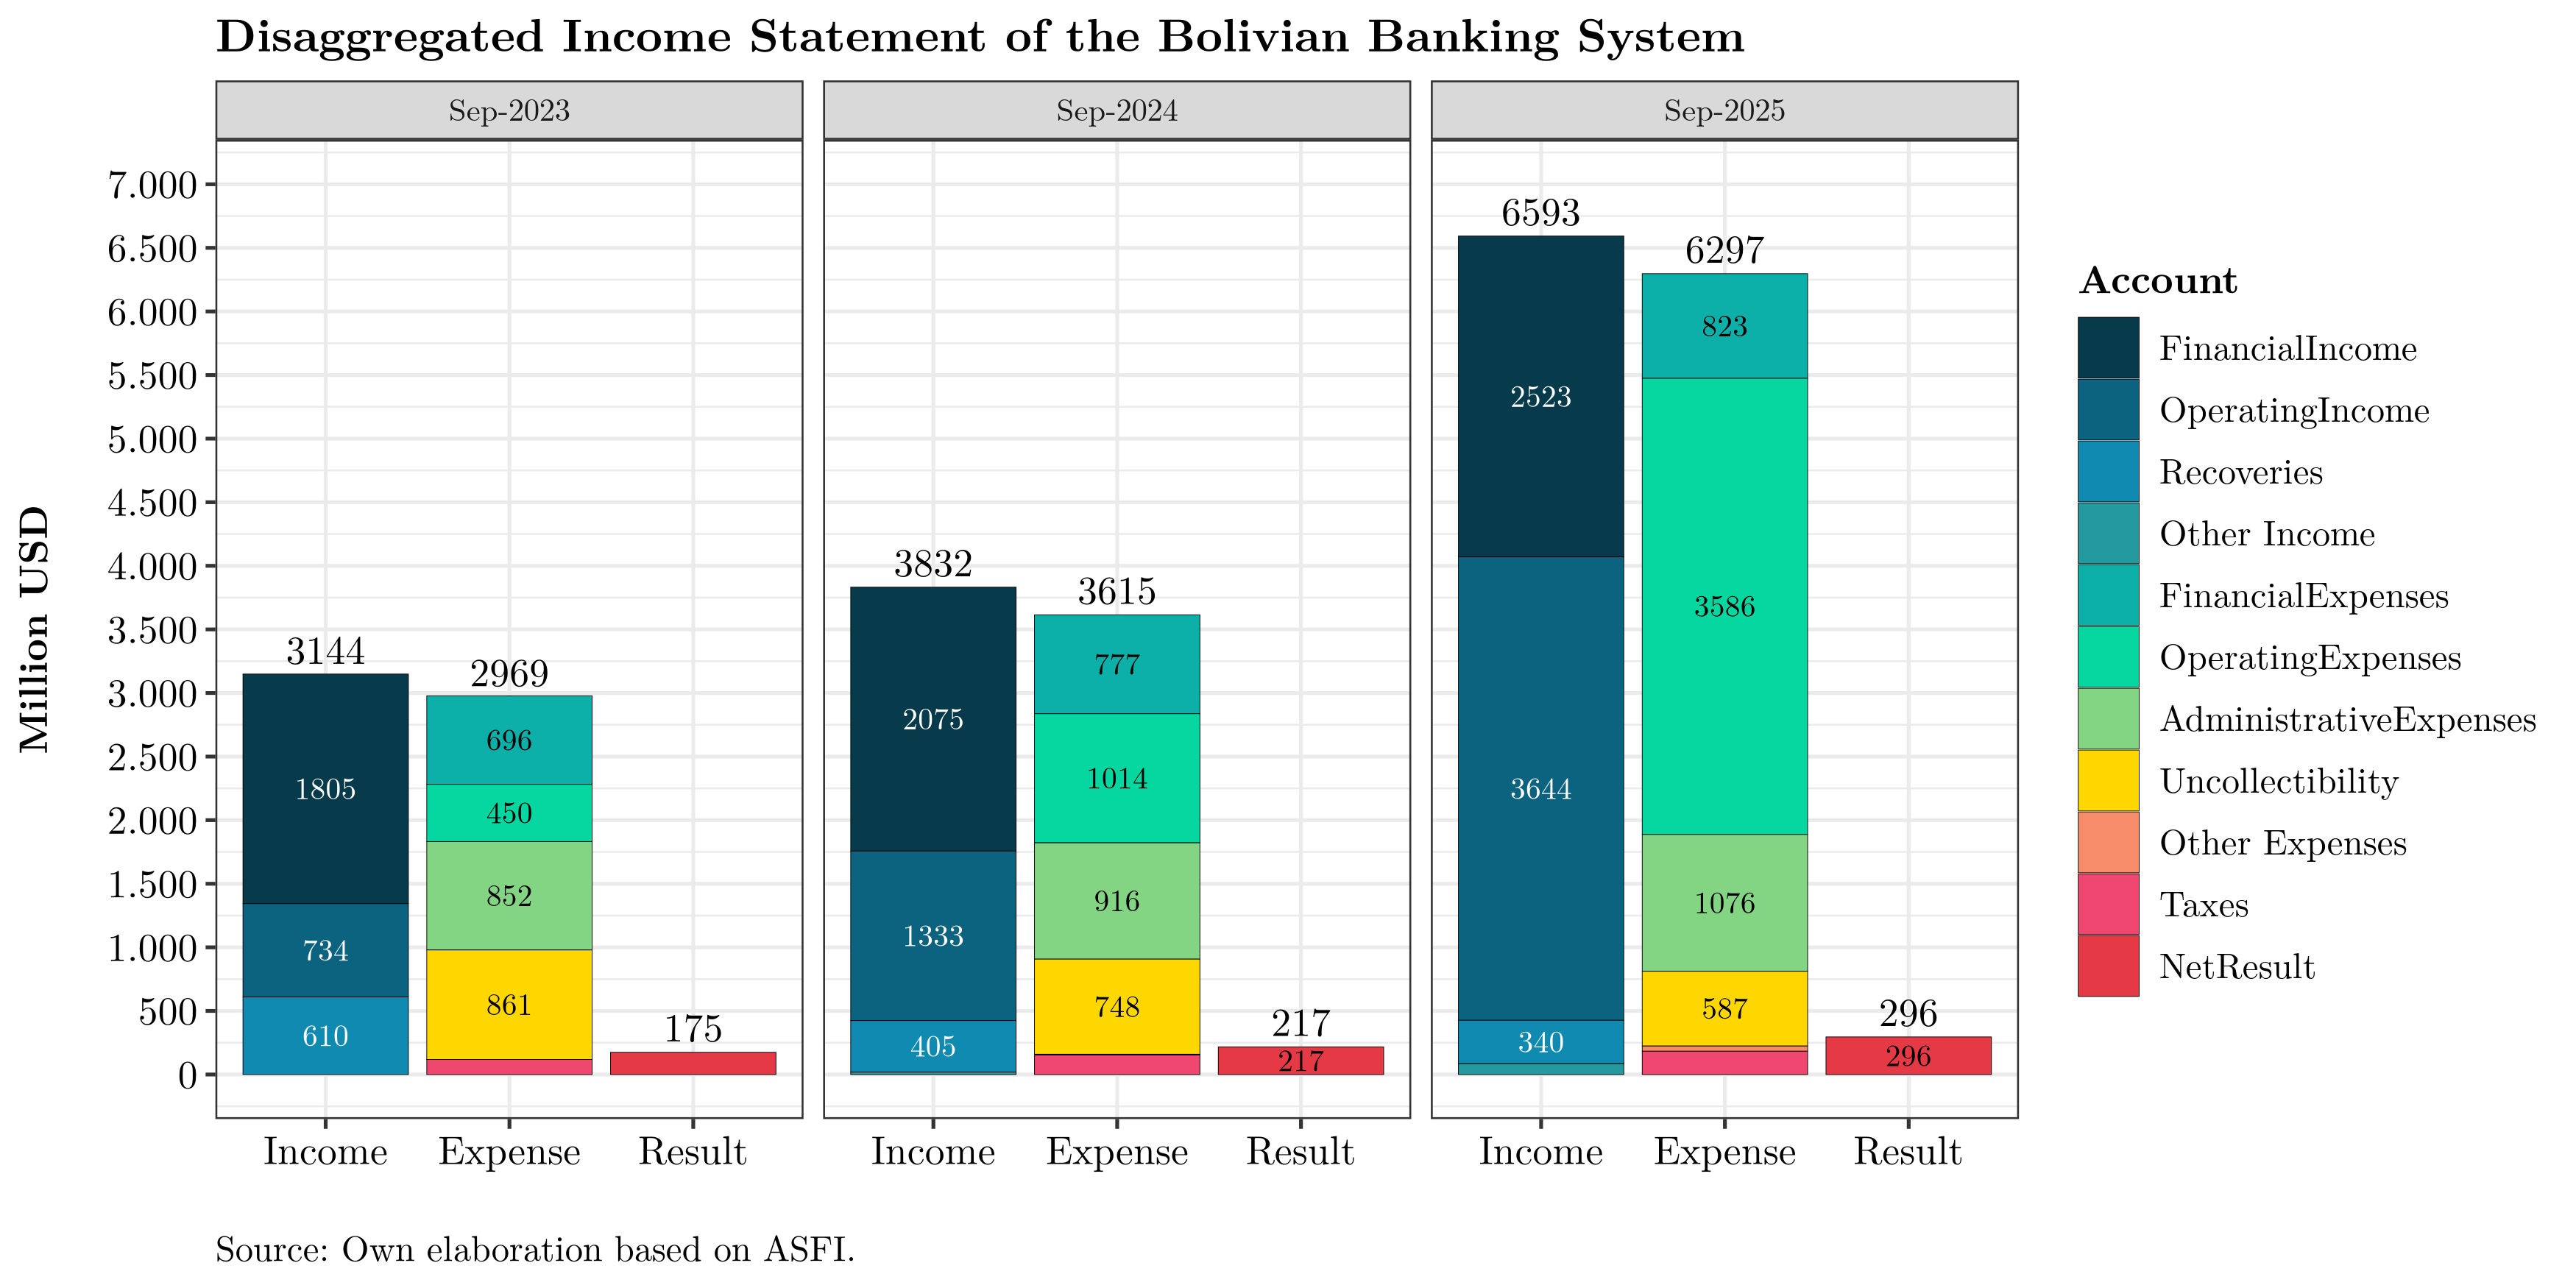
The scale of activity has increased in recent years, and as of September 2025 the system reported a stronger net result than in the same month of previous years. Caution is warranted, however: results should be adjusted for inflation and the exchange rate and assessed relative to capital (and risk).
We also observe a slight shift in income sources—from financial income (loans) toward operating income (fees)—with a corresponding change in costs. Notably, while both operating income and expenses are rising, the latter is growing faster.
Profitability
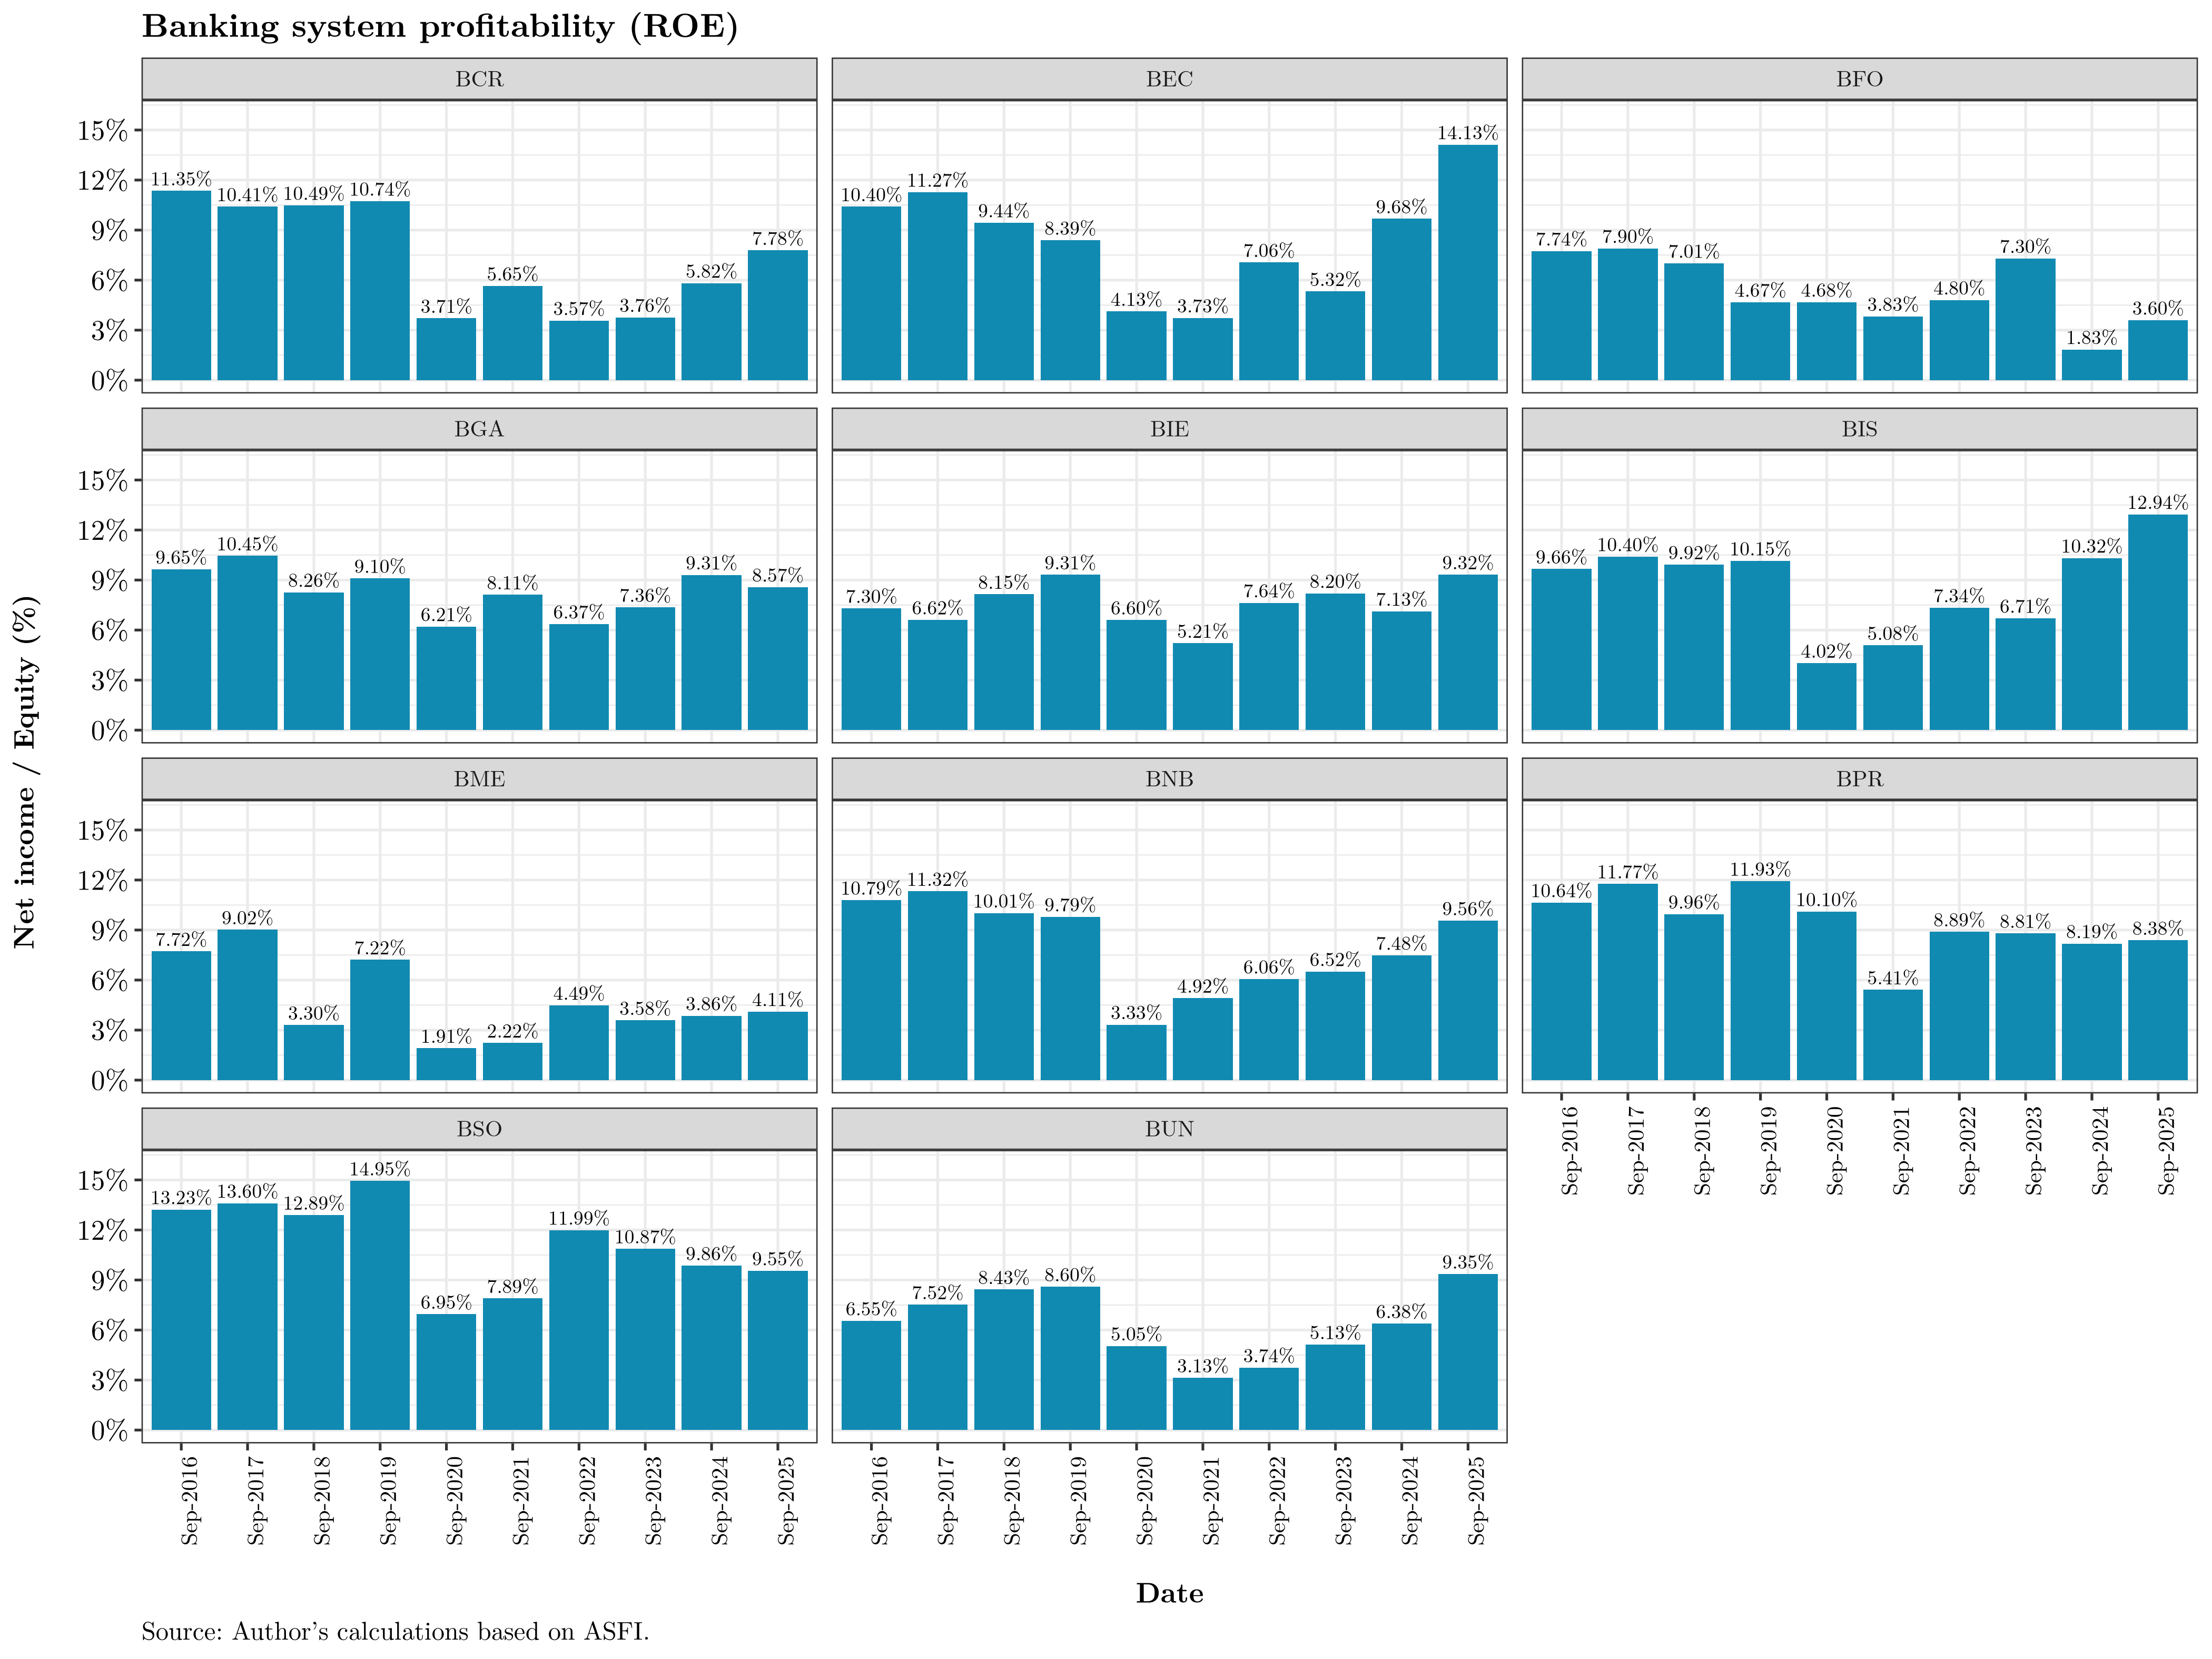
A complementary view focuses on profitability—returns relative to investor capital. The figure below shows the system’s ROE (Return on Equity) at the same cutoff since 2016:
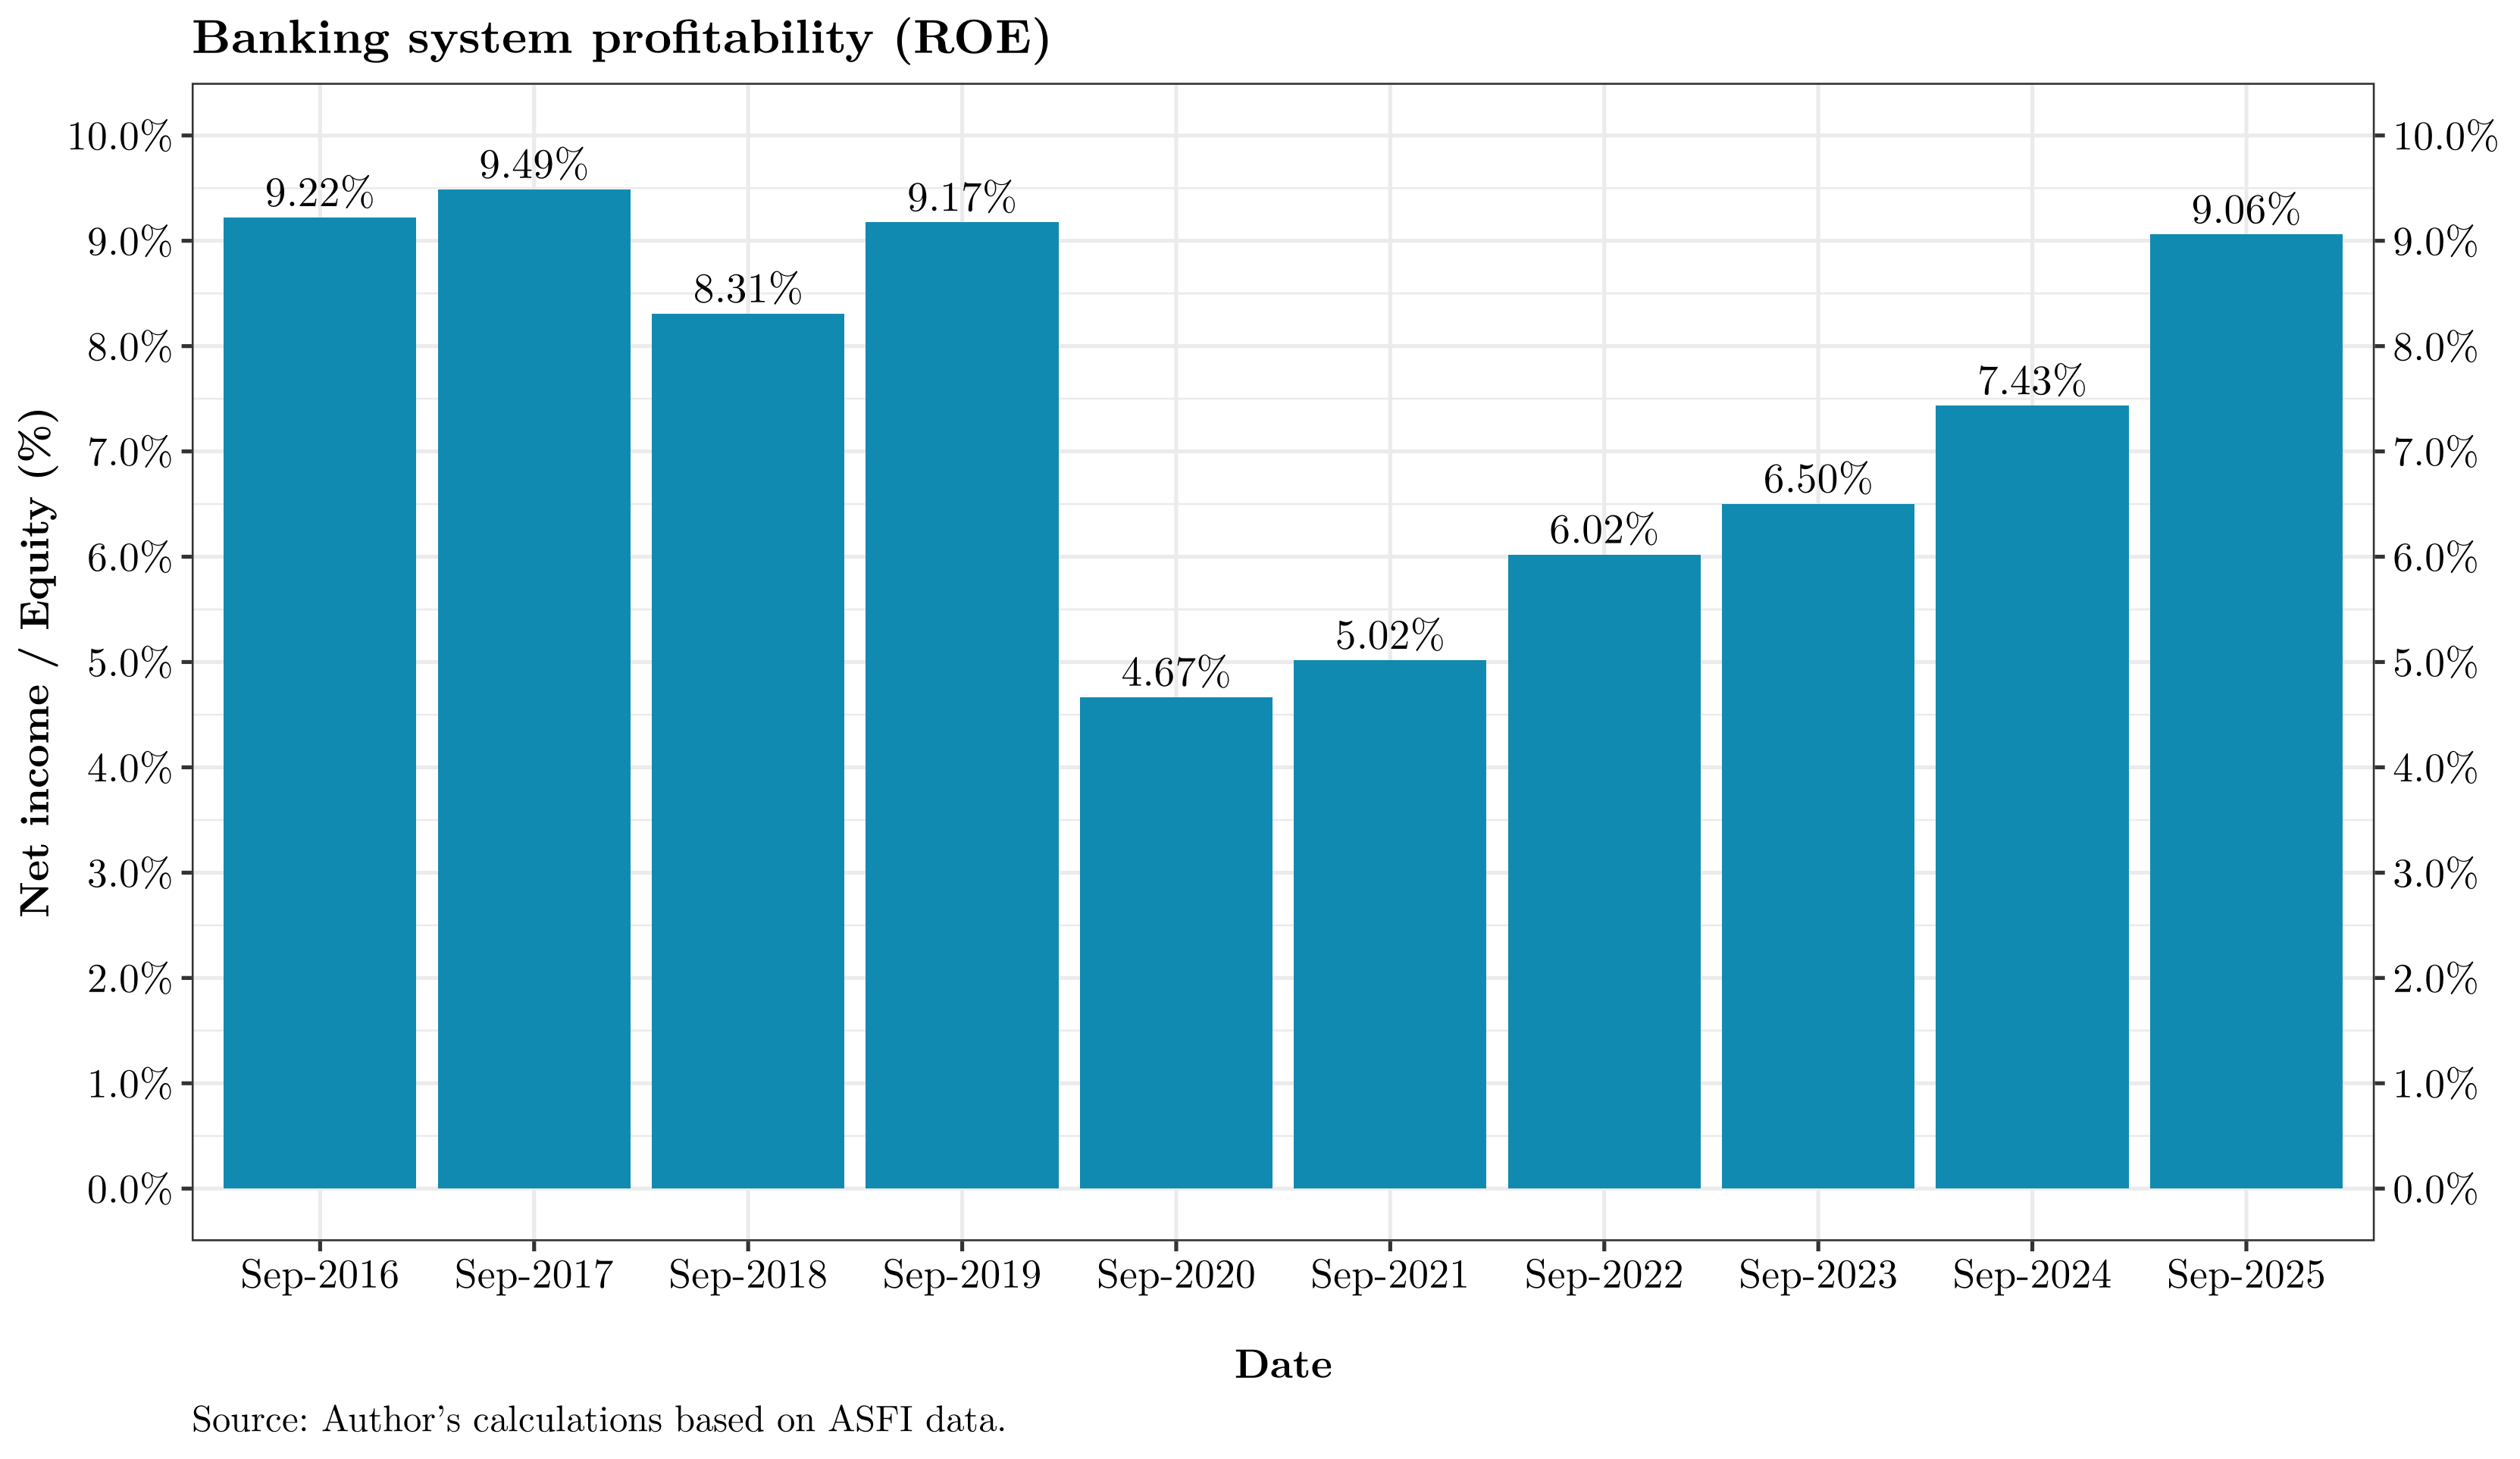
Since the pandemic, the banking system has posted positive and rising profitability, nearly back to pre-pandemic levels. Higher profitability not only supports dividends but also—though not mechanically—increases capital, providing a buffer against losses and capacity to expand lending. Sustained profitability is therefore important.
By institution, profitability is heterogeneous:
Conclusions
1. Nominal expansion, real contraction. Although the banking system’s balance sheet grew 3.6% YoY (about USD 1.479 billion at the official rate), inflation-adjusted figures show a real contraction in both the loan portfolio and public deposits. This reflects a challenging macro environment where inflation erodes local-currency balances and stagnating growth curbs credit demand.
2. Structural shift toward liquid, short-term assets. Asset composition shows a growing preference for cash and temporary investments at the expense of loans. This reconfiguration indicates that banks are prioritizing liquidity and immediate returns over traditional intermediation—a defensive strategy amid heightened macro risk and inflationary pressure.
3. Greater institutional exposure to the BCB and the public sector. Liquidity continues to flow toward the Central Bank of Bolivia (BCB) and, to a lesser degree, the Treasury (TGN). Accounts 124 and 127—exposure to the non-financial public sector and restricted-availability operations—have gained prominence, concentrating a significant share of assets. This concentration raises counterparty risk and may constrain flexibility so long as foreign-currency assets remain restricted.
4. More volatile funding and higher liquidity risk. On the liability side, there is a shift toward current and savings deposits, while time deposits stagnate. This mix heightens vulnerability to sudden withdrawals and episodes of liquidity stress—especially given the concentration of resources at the Gestora Pública and the limited capacity to attract foreign-currency funding.
5. Positive profitability under structural pressure. ROE is positive and recovering toward pre-pandemic levels; however, net interest margins face pressure from rising operating costs, regulated lending rates (social housing and productive credit), and the need to offer higher deposit rates to retain funding. The reprogrammed portfolio—about 15% of total loans—remains the main credit-risk hotspot due to its high likelihood of future deterioration.
Another hypothesis is that firms with access to U.S. dollars may be borrowing in local currency and later repaying with fewer dollars due to inflation and depreciation. Data are not granular enough at this stage to confirm this explanation. ↩︎