Banking in Bolivia as of June 2025: Beginning to Finance the Treasury?
Introduction
As is customary in these columns, we will analyze the performance of the banking system over the past three months, based on the information published by the Financial System Supervisory Authority (ASFI). As always, the analysis is conducted using the Financial Statements (FS) of the institutions and is strictly personal.
However, before beginning, it is worth outlining the macroeconomic context in which banking activity in Bolivia is currently immersed, as it has become a central concern for Bolivians.
Macroeconomic Context
The once “shielded economy” of Bolivia is now experiencing a balance of payments crisis, reflected in a shortage of foreign currency (mainly U.S. dollars) and a sharp decline in the net international reserves (NIR) of the Central Bank of Bolivia (BCB). Moreover, this USD shortage has disrupted the exchange market. While the official exchange rate remains fixed at 6.96 Bs/USD, the parallel rate fluctuates around Bs. 14 per dollar.
Although external factors have played a role in this problem, the sustained fiscal deficit is its main driver. Given the increase in country risk and the unsustainability of public finances, the government has had to finance this deficit through loans from the BCB. As a result, the inability to maintain the official exchange rate, combined with fiscal deficit financing by the central bank, has created the perfect breeding ground for runaway inflation, which as of June 2025 had reached 24% year-on-year1.
Overview: The Balance Sheet
The Balance Sheet provides a snapshot of a financial institution’s position at a given point in time, reflecting the composition of its assets, liabilities, and equity.
In the case of the banking system, assets represent the resources in which banks have invested — such as loans granted, deposits in other financial institutions, and tangible assets like buildings and equipment. Liabilities, on the other hand, represent the bank’s obligations, including customer deposits, borrowings from other financial institutions, and other funding sources. Lastly, equity is the difference between assets and liabilities, representing the institution’s own resources.
Balance Sheet Structure
To provide a better perspective, the following chart presents a summary of the composition of the banking system’s balance sheet at three key points in time: the latest available month, the previous month, and the same month the previous year. This allows for an analysis of structural changes both over the last year and the most recent month:
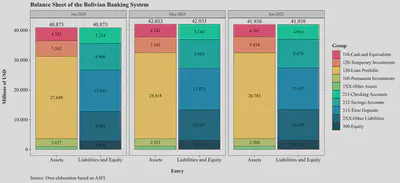
First, compared to June 2024, the balance sheet has expanded significantly — by nearly USD $1.065 billion, equivalent to a 2.6% increase. However, compared to the previous month, growth was negative, decreasing by USD 95 million due to a reduction in the system’s cash and equivalents, accompanied by a similar drop in current account deposits. This will be explored in more detail later.
A summary of growth can be seen in the table below:
| Category | Account | YoY Change (%) | MoM Change (%) |
|---|---|---|---|
| Assets | 110-Cash and Equivalents | -5.8% | -3.3% |
| Assets | 120-Temporary Investments | 3.3% | 1.7% |
| Assets | 130-Loan Portfolio | 4.1% | -0.1% |
| Assets | 160-Permanent Investments | -5.8% | -0.7% |
| Assets | 1XX-Other Assets | 17.0% | 0.5% |
| Liabilities | 211-Current Accounts | -6.5% | -4.8% |
| Liabilities | 212-Savings Accounts | 8.0% | 0.2% |
| Liabilities | 213-Time Deposits | 0.5% | 0.5% |
| Liabilities | 2XX-Other Liabilities | 3.4% | 0.4% |
| Equity | 300-Equity | 10.0% | 0.9% |
Overall, we observe a shift of liquidity from cash holdings to temporary investments, likely due to the better yields offered by the latter. Still, the abrupt monthly drop in cash holdings is striking. Additionally, unlike in the previous quarter, there is a significant decrease in current accounts, which has been offset by growth in savings accounts relative to June 2024. It is also worth highlighting the increase in the system’s accounting equity.
Currency Composition
Another insightful way to examine the balance sheet is by distinguishing between assets and liabilities denominated in local currency versus those in foreign currency:
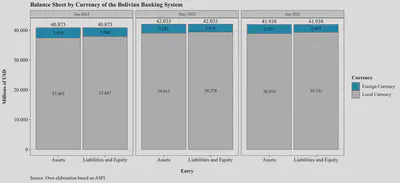
The chart above illustrates the process of “de-dollarization” in the banking system. Over the last year, Bolivian banks have returned USD 388 million in foreign currency. Although on paper they remain in a “long position” — that is, they hold more dollar-denominated assets than liabilities — accessing those resources is not straightforward. A significant share of these assets has been placed at the BCB, either as legal reserve requirements (classified as cash and equivalents) or as contributions to various liquidity funds (CPVIS, FIUSEER, etc.) that serve as collateral for BCB loans in local currency, classified as permanent investments.
This is further illustrated in the following chart, which presents only the foreign currency balances:
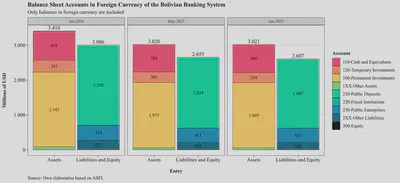
Note that most foreign currency liabilities consist of public deposits (i.e., savings and current accounts). Conversely, foreign currency assets are primarily categorized as permanent investments and cash and equivalents. These permanent investments largely represent dollar resources placed with the BCB. While they have been decreasing, they still represent a significant share of foreign currency assets. In essence, although the banking system nominally holds these dollars, they remain inaccessible because the BCB has yet to return them.
Assets
A financial institution’s assets include cash in vaults and ATMs for daily operations, loans granted (the credit portfolio), investments in financial instruments, and the real estate needed to operate. The loan portfolio continues to be the most important component, as it is the main income source for financial institutions. Sound loan origination and management are therefore crucial for the system’s stability and sustainability.
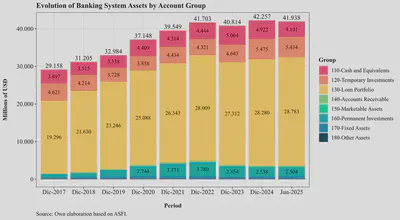
The chart below shows the evolution of banking system assets over the years up to the latest available month. While a significant increase is observed, some fluctuations are also evident. As previously noted, there has been a growing preference for temporary investments over cash holdings:
Viewed by institution:
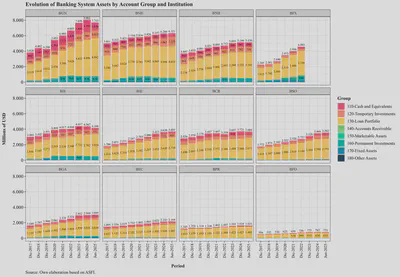
From the above chart, we see a significant decline in Banco Unión’s assets since December 2024, particularly in its cash and equivalents.
Contribution to Asset Growth
Another way to analyze the asset side is to assess the contribution of each account group to year-on-year growth. This helps identify which groups are driving overall asset expansion — and which are offsetting it. The chart below presents this contribution by accounting group from January 2022 onward:
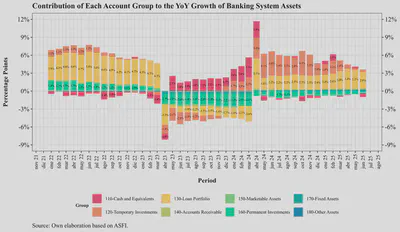
How to read the chart: for example, between June 2024 and June 2025, total assets grew by 2.6%. This can be broken down by account group as follows:
| Account Group | Contribution |
|---|---|
| 110-Cash and Equivalents | -0.6% |
| 120-Temporary Investments | 0.4% |
| 130-Loan Portfolio | 2.8% |
| 140-Accounts Receivable | 0.1% |
| 150-Marketable Assets | 0.0% |
| 160-Permanent Investments | -0.4% |
| 170-Fixed Assets | 0.3% |
| 180-Other Assets | 0.1% |
| Total | 2.6% |
What can we infer from this? Before March 2023, credit growth was the main driver of asset growth, with priority given to lending over liquidity. To a lesser extent, temporary investments were also growing. However, starting in March 2023, the trend shifted. Credit growth slowed, as did permanent investments. Meanwhile, cash and later temporary investments took center stage. This shift reflects materialized risks in the Bolivian economy — notably the collapse of Banco Fassil, triggered by the drastic drop in BCB reserves and the unsustainable fixed exchange rate.
What’s most interesting is that as signs of crisis intensified, banks prioritized the short-term yield of temporary investments. While credit continues to grow, it does so at a slower pace. In other words, given macroeconomic conditions, banks are increasingly focused on short-term profitability — especially since the BCB has been absorbing liquidity from the system (to counteract deficit financing) by offering higher-yielding securities.
Cash and Equivalents
According to the Financial Institutions’ Account Manual, cash and equivalents are defined as:
Cash held by the institution in vaults, sight deposits at the Central Bank of Bolivia, head offices and foreign branches, as well as in domestic and foreign banks and correspondents. It also includes holdings of precious metals, checks, and other immediately collectible documents and pending electronic transfers.
Note that although not discussed in detail here, BCB regulations on required reserves apply to banks’ liquid assets. This means financial institutions must keep (“encaje”) a percentage of customer deposits in BCB accounts. Thus, regulation requires banks to maintain a minimum level of liquid assets proportional to the deposits they collect.
Composition
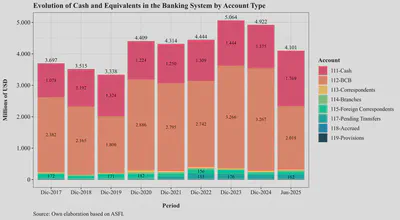
As shown in the following chart, total cash and equivalents have remained relatively stable around USD $4 billion, of which approximately 30% is held in physical cash for daily operations (withdrawals, ATMs, etc.). It is also evident that since December 2024, total cash and equivalents have fallen by around USD $800 million — mainly due to a reduction in BCB deposits:
By institution:
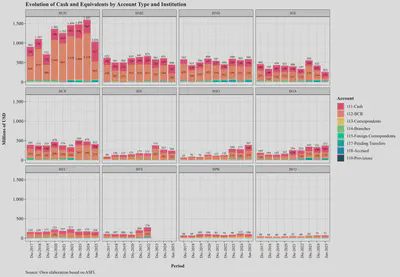
From the chart above, Banco Unión shows the largest drop in cash and equivalents (a 54% decrease so far in the year), though other banks such as Banco Mercantil and Banco Bisa have also reduced their liquidity relative to December 2024.
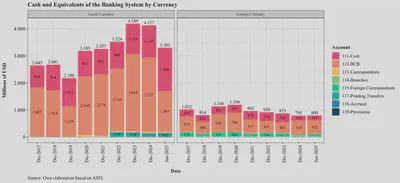
By Currency
Given the drop in international reserves mentioned earlier — and the resulting scarcity of foreign currency in the economy (see here) — it is expected that cash and equivalents in foreign currency would also decline. This is confirmed in the chart below:
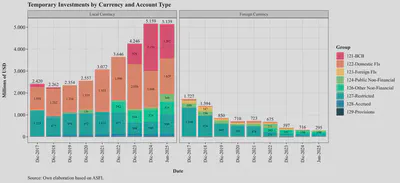
Temporary Investments
According to ASFI’s Account Manual for financial institutions, temporary investments are defined as:
Investments in deposits in other “financial intermediation institutions,” deposits at the Central Bank of Bolivia, and debt securities acquired by the institution; investments made in accordance with its investment policy, with the intention of achieving adequate returns on temporary liquidity surpluses, and which can be converted into cash within no more than thirty (30) days.
Let’s take a closer look.
Composition
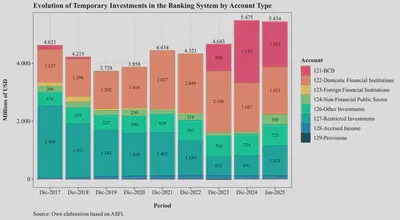
The following chart shows the composition of temporary investments at year-end and for the latest available month. As noted earlier, exposure to BCB instruments increased sharply from December 2023, although by June 2025, such investments decreased by approximately USD 600 million. This drop is offset by growth in account 124, which records investments in debt securities issued by non-financial public entities (TGN bonds, notes, etc.), and account 127, which captures restricted-availability investments — mainly repurchase agreements (repos), often involving the BCB or TGN:
Due to its sharp increase beyond historical norms, the next chart breaks down account 124 — investments in non-financial public sector (NFPS) entities — into its subaccounts:
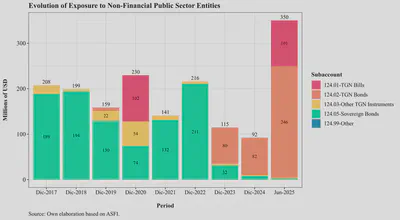
Note the change in this account beginning in 2023, which has intensified in 2025. Although the total banking system exposure is only USD 350 million, this account reflects banks’ relationship with the Treasury (TGN) and should be monitored carefully, especially given current fiscal sustainability concerns.
The next chart shows the evolution of temporary investments by institution and account type:
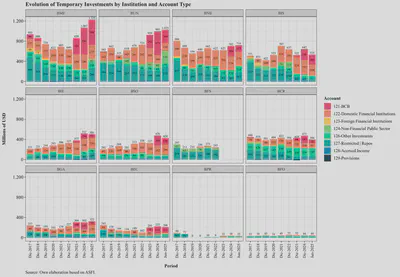
From the chart, both Banco Mercantil and Banco Unión — the two largest holders of temporary investments — have increased their exposure to restricted-availability operations (presumably repos), as well as to the non-financial public sector.
By Currency
It is also insightful to analyze temporary investments by currency. The chart below shows this breakdown over time:
Over time, temporary investments have become increasingly concentrated in local currency and placed with the BCB. This likely reflects a strategy by the central bank to absorb excess liquidity from the financial system — consistent with its monetary policy. As the BCB funds the fiscal deficit, it seeks to offset inflationary pressures by drawing liquidity back into its own instruments.
Loan Portfolio
This section analyzes the behavior of the banking system’s loan portfolio. It is important to note that the portfolio is the primary source of financial income and by far the most significant asset for Bolivian banks.
Growth
A first question is how the portfolio has grown over recent years. This is important from several angles, since both excessive growth and insufficient growth can signal underlying issues. Rapid growth may indicate a credit expansion that, if poorly managed, could lead to solvency problems in the future. On the other hand, weak growth could reflect declining aggregate demand and, consequently, challenges in the real economy.
The chart below shows the year-over-year growth of the loan portfolio — comparing the current month with the same month in the previous year — excluding provisions and accrued interest. A noticeable slowdown is evident, with growth stabilizing around 5% in 2024 and 2025, slightly above the levels observed during the pandemic:
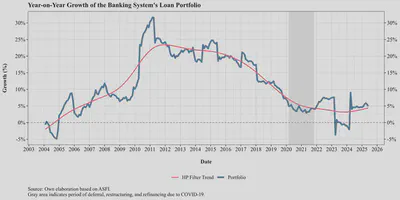
Additionally, the portfolio experienced strong growth during the second half of the 2010s, peaking around March 2011. Since then, although growth has remained positive and in double digits, it has gradually decelerated.
However, as shown in the next chart, not all institutions have slowed their loan disbursements:
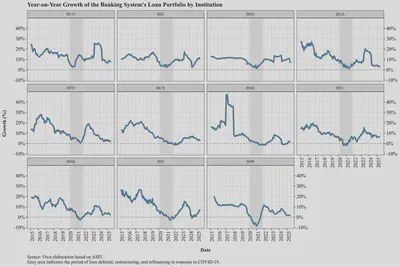
The chart shows that most banks have indeed experienced a significant slowdown in credit growth — in many cases, lower than during the early months of the pandemic. This is a worrying sign, as it reflects the slowdown of the national economy and a weaker demand for credit.
Lastly, in terms of monthly balances, the chart below shows net monthly changes in the loan portfolio:
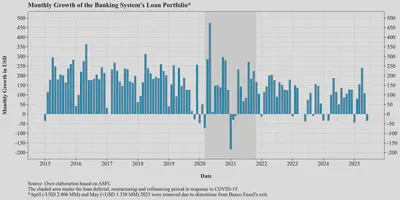
This chart reveals that monthly loan flows have been declining over time, even though they are still reported in U.S. dollars using the official exchange rate.
Growth by Credit Type
It is also useful to examine growth by credit type. The following chart presents year-on-year growth in the loan portfolio broken down by credit type:
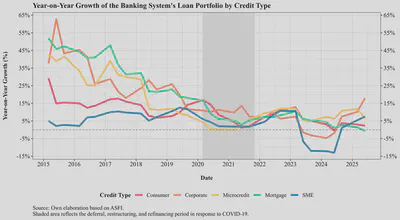
As with the aggregate portfolio, different types of credit have lost momentum — particularly consumer and mortgage loans. However, after a sharp contraction during 2023 and 2024, SME and corporate credit portfolios show a notable recovery.
This trend requires further investigation, as the apparent expansion in SME and corporate credit might not signal economic growth, but rather efforts to sustain business operations in the face of an economic downturn2.
Non-Performing Loans (NPLs)
The non-performing loan ratio (NPL), or simply “delinquency,” includes all operations with over 30 days of missed payments, expressed as a share of the total loan portfolio.
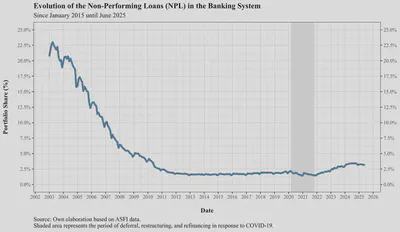
The following chart shows the evolution of the NPL ratio since January 2003. As seen, the NPL ratio peaked at nearly 23% in 2003 — a level that would be considered insolvent for the banking system. This coincided with a particularly complex macroeconomic environment in Bolivia.
Since then, NPLs were brought under control. By 2007, the system returned to single-digit levels, and in 2013 the NPL ratio reached a minimum of 1.55%. From then onward, NPLs rose gradually but remained controlled at around 1.8% — until the pandemic. During the pandemic, loan refinancing, grace periods, and reprogramming measures caused a temporary (and accounting-based) decline in NPLs:
After the pandemic, the NPL ratio began climbing again and shows a clear upward trend, posing challenges for banks and regulators alike. For example, focusing on data since 2015:
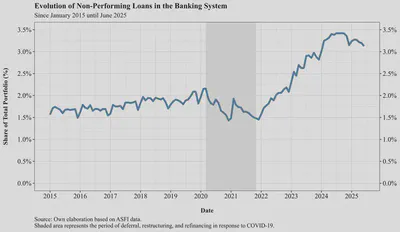
Interestingly, the NPL ratio began to decline in the last quarter of 2024, even though both the loan portfolio and the economy slowed. Several factors might explain this: banks may be lending more cautiously, borrowers might be prioritizing debt repayments, or some non-performing loans may have been reprogrammed — and thus not counted as delinquent.
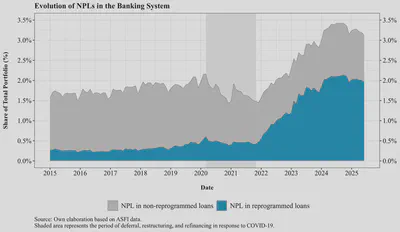
Finally, distinguishing between NPLs in reprogrammed loans and those in standard loans reveals that most delinquencies now stem from reprogrammed loans:
By institution:
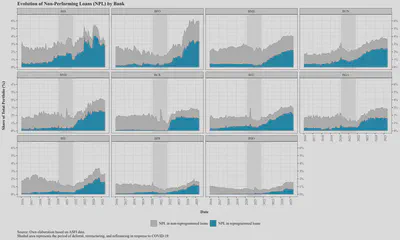
A striking observation is that banks such as Banco Bisa, Banco Económico, and Banco Prodem have nearly all their NPLs in reprogrammed loans. Before the pandemic, this was the opposite — if a customer didn’t pay, the loan was considered delinquent, not reprogrammed. Now, either new loans are not causing repayment problems — which is unlikely given the macro context — or banks are systematically reprogramming loans. If reprogrammed loans are not truly recoverable, this could become a long-term problem.
Additionally, examining NPLs by credit type helps identify issues in specific borrower segments:
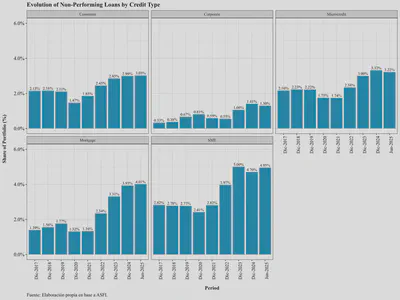
Aside from corporate loans, all segments show increased NPLs — especially mortgage and SME loans.
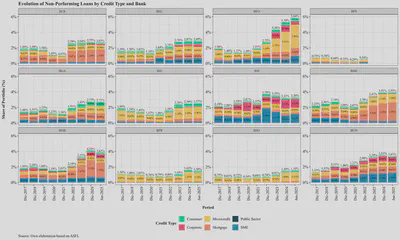
Finally, NPLs by bank and credit type:
Reprogrammed Loans
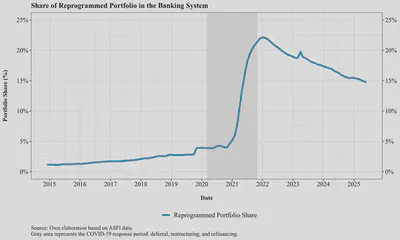
Reprogrammed loans — more prone to default — still represent around 15% of the total portfolio. Although some institutions have attempted to reduce this exposure, others continue with active reprogramming policies. Thus, what was stated last year remains valid:
“In previous years, a loan would be reprogrammed when the borrower indicated that, for some perhaps temporary reason, they would be unable to meet their payment obligations. On a case-by-case basis, institutions would decide whether to modify the original repayment plan by lowering interest rates, extending maturities, or reducing installment amounts to prevent the loan from deteriorating. However, when a client already cannot pay, it becomes riskier to assume they will be able to in the future.”
In recent months, the stock of reprogrammed loans has declined somewhat — as some loans are maturing and because the total loan portfolio continues to grow:
The issue with reprogrammed loans is that they are inherently more likely to default, as they have already shown signs of payment difficulty. Therefore, it is important to monitor not just the portion of the reprogrammed portfolio that is non-performing, but the total stock as well. The next chart shows the reprogrammed loan portfolio in millions of USD, separated by repayment status:
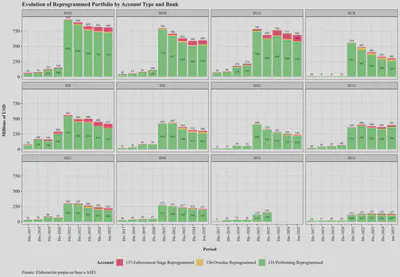
The real concern lies in the performing reprogrammed loans, which are next in line to become delinquent. For some institutions, this category continues to grow.
Permanent Investments
According to the Account Manual for Financial Institutions, permanent investments are defined as:
Deposits in financial intermediation entities, deposits at the Central Bank of Bolivia, debt securities acquired by the institution, and non-marketable debt certificates issued by the public sector. These investments are not easily convertible into cash or, even if liquid, are intended — by the institution’s own investment policy — to be held for more than 30 days.
Composition
The chart below shows the composition of these investments by account type:
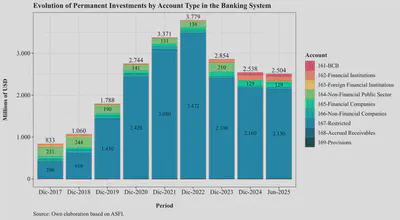
Note that the largest share is concentrated in account 167 — restricted-availability investments, which records:
“Investments in securities issued by domestic or foreign entities […] that, as of the reporting date, are subject to restrictions due to being under repurchase agreements, additional reserve requirements, or pledged as collateral […].”
By institution:
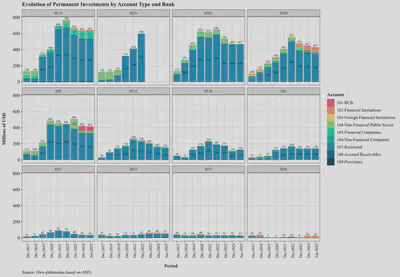
These permanent investments are mainly concentrated in contributions to the CPVIS, CAPROSEN, and FIUSEER funds, among others, managed by the BCB. These funds were created when the legal reserve requirement in foreign currency was reduced for financial institutions. The BCB is obligated to return these contributions in U.S. dollars, but has not yet done so in full, which has generated concern within the banking system.
Liabilities
Liabilities are a key source of funding for financial institutions and are vital to their proper functioning. Liabilities represent obligations (debt) that banks have to the public (deposits), companies (current accounts), and institutional investors.
In recent months, there has been growing speculation about banks’ ability to return funds to the public. As a result, some depositors have approached banks to withdraw their savings. This has posed liquidity challenges for some institutions, which have had to seek immediate sources of funding to meet withdrawal demands.
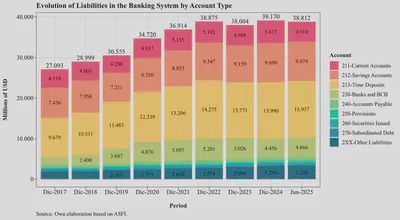
The following chart shows the evolution of total liabilities in the banking system at each December since 2015, along with the most recent quarterly data:
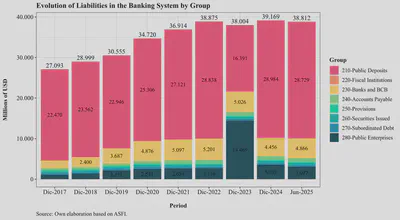
Starting in December 2023, we see a notable increase in account 280, which corresponds to public enterprises. This is due to an accounting reclassification: pension funds previously managed by AFPs were transferred to the state-run Gestora Pública. As shown, nearly 40% of bank funding is now concentrated in a single entity, raising concerns about liquidity risk and market power. However, this reclassification was later reversed, and current data do not allow us to determine the exact share of funding coming from the Gestora.
Another important observation is that, during the year, banking system liabilities declined by USD $357 million compared to December 2024. If banks cannot attract public deposits, they cannot sustain their loan portfolios — their core business and income source. Their options are thus limited to raising deposit interest rates to attract savers or negotiating directly with the Gestora for liquidity, also by offering higher rates.
However, given that social housing and productive credit rates are fixed by regulation, raising passive rates (on deposits) would reduce banks’ profitability.
Alternatively, we can reclassify liabilities by type of deposit:
From the chart above, it is evident that current accounts — primarily held by companies — have experienced a significant contraction so far this year. Other types of deposits have remained relatively stable.
Growth
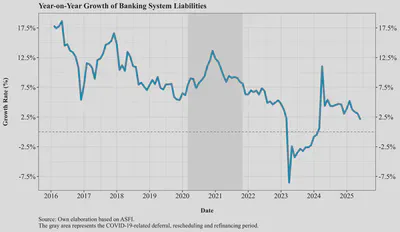
How have banking system liabilities evolved? Overall, liabilities have continued to grow year-on-year (comparing each month with the same month of the previous year), but the growth rate has been declining:
Looking at year-on-year growth by institution:
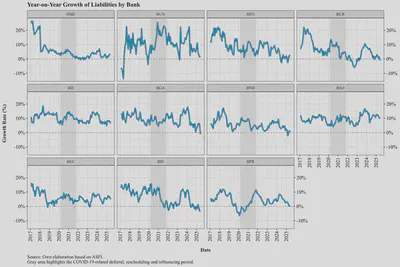
The chart shows that most institutions are struggling to attract funding. While some are still growing relative to the same month the year before, others have seen a contraction in their liabilities.
Contribution to Growth
As we did for the asset side, we can decompose liability growth by deposit type. The chart below shows this evolution disaggregated by account type. This evolution mirrors the behavior seen on the asset side:
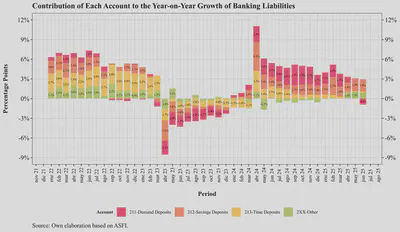
What can we infer? Before March 2023, time deposits were the main driver of liability growth, followed by savings accounts. These deposit types, although more expensive, are also more stable and help banks match the maturities of their loan portfolios.
However, beginning in March 2023 and continuing through the year, current accounts experienced negative growth. Toward the end of the year, time deposits also began to contract. Since April 2024, liabilities have resumed growing — but the growth has been driven by current and savings accounts.
Although this is not inherently negative, it exposes banks to greater liquidity risk, since savings and current accounts are more volatile than time deposits and more likely to be withdrawn in times of uncertainty. This vulnerability was clearly visible in 2023.
The table below shows the contribution of each deposit type to total liability growth over the last 12 months:
| Deposit Type | Contribution |
|---|---|
| 211-Current Accounts | -0.9% |
| 212-Savings Accounts | 1.9% |
| 213-Time Deposits | 0.2% |
| 2XX-Other Liabilities | 0.9% |
| Total | 2.1% |
Income Statement
Lastly, although we will not delve into the details, the chart below presents the financial results of the Bolivian banking system as of June for the last three years:
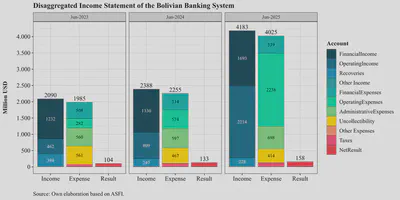
As shown, the size of the business has grown in recent years, and by June 2025 the banking system reported a better net result compared to the same month in previous years. However, these results should be interpreted with caution, as they need to be adjusted for inflation and exchange rate effects, and assessed relative to capital and risk exposure.
That said, there is a slight shift in the source of income — from financial income (from the loan portfolio) toward operating income (fees and commissions), with a corresponding increase in operating costs. In fact, while both operating income and expenses have risen, expenses have grown at a faster rate.
Conclusions
The conclusions are broadly consistent with those of the previous quarter, with some nuances:
1. Greater concentration of banking activity in the short term:
The composition of bank assets shows an increasing preference for short-term instruments, particularly temporary investments. These have gained weight as a share of total assets at the expense of the loan portfolio, reflecting a strategic shift toward more liquid, lower-risk assets. This behavior is strongly driven by a challenging macroeconomic environment where liquidity and risk expectations are especially sensitive.
In addition, some institutions have increased their exposure to debt instruments issued by the General Treasury of the Nation (TGN), totaling USD 350 million as of June 2025. Given current fiscal fragility, this poses an additional risk to the banking system’s financial stability.
2. Growing preference for the Central Bank of Bolivia as counterparty:
Figures show a strong redirection of excess liquidity toward the BCB, in the form of cash, temporary investments, and permanent investments. Banks have concentrated their liquidity in instruments issued by the BCB — including those recorded as “complementary reserves” or “other instruments” — which are not always fully transparent. This creates greater institutional exposure to a single counterparty and reduces counterparty diversification in banks’ portfolios.
3. Slower credit growth and rising risk in reprogrammed loans:
Credit portfolio growth has moderated steadily, stabilizing around 5%, while risk indicators have deteriorated — especially in reprogrammed loans. These now represent a significant portion of total lending (around 15%) and continue to present repayment difficulties. If not properly managed, this could become a latent risk to financial stability.
4. More volatile bank funding, vulnerable to confidence shocks:
On the liability side, total funding has declined by USD 358 million compared to December 2024. Although year-on-year growth remains positive, the composition has shifted toward savings and current accounts — with the latter showing a significant drop since year-end. This exposes banks to greater liquidity risks, as these sources of funding are more susceptible to withdrawals in the face of uncertainty.
5. Financial disintermediation:
The combination of slower credit growth, greater BCB exposure, and increased holdings of internal financial instruments points toward a form of financial disintermediation. In other words, the banking system may be drifting away from its core function of channeling savings into productive investment, and instead acting more like an institutional investor than a lender to the real economy.
This article provides further detail on the topic. ↩︎
One alternative hypothesis is that companies with access to U.S. dollars are borrowing in local currency and planning to repay with devalued currency — due to inflation and depreciation. However, disaggregated data is not available to confirm this. ↩︎