How Reliable Are the Rossi-Hansberg and Zhang (2025) Data for Bolivia?
In a previous post, last week I began exploring the new GDP estimates at a much more granular level than usual (down to 0.25 degrees x 0.25 degrees) developed by Rossi-Hansberg & Zhang (2025). The positive conclusion from that post was that, thanks to these data, new research questions could be addressed—especially in developing countries like Bolivia.
However, for these data to be usable, they must meet minimum quality standards. For instance, if aggregated, they should closely approximate the official Gross Domestic Product (GDP) figures published by the National Institute of Statistics (INE). In this post, I will explore the data further and assess whether they meet these standards.
Quality Control
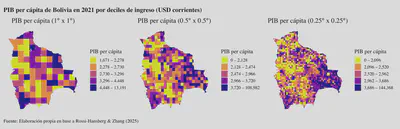
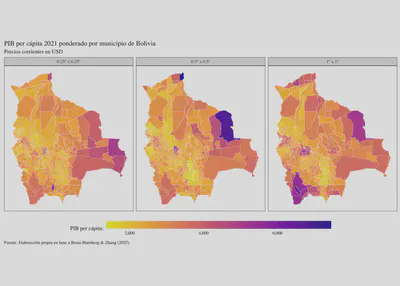
As mentioned in the previous post, the authors have made the data available at resolutions of 1 degree x 1 degree, 0.5 degrees x 0.5 degrees, and 0.25 degrees x 0.25 degrees. These are grid cells that span across the map. To visualize this, below I show Bolivia’s per capita GDP at current prices for 2021 across the different resolutions:
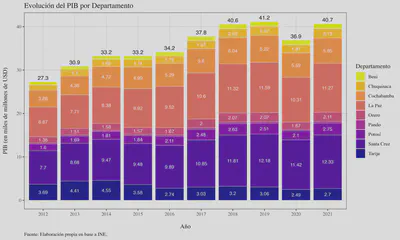
Meanwhile, INE calculates GDP data annually by department:
The first thing we’d like to see is that, regardless of the resolution used, the aggregated data align with the information published by INE—both at the national and departmental levels.
Comparison at the National Level
The first verification consists of aggregating the data at the national level for each resolution and comparing it with INE’s published results:
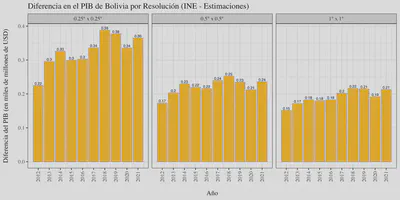
As shown in the graph above, the estimation error decreases as coarser resolutions are used. It’s worth noting that regardless of the resolution, the results are quite similar. Looking at the differences in proportion to GDP helps visualize the scale of estimation error:
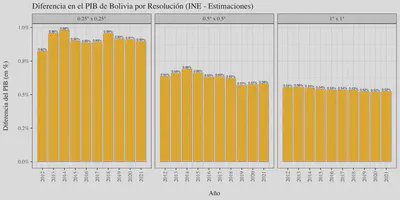
Thus, the estimation error ranges from approximately 0.5% for the 1x1 degree resolution to about 0.95% for the 0.25x0.25 degree resolution. This error is relatively low, and the aggregated estimates are fairly consistent with those published by INE.
Comparison at the Department Level
After confirming consistency at the national level, the next step is to check whether the data are also consistent at the departmental level. The previous exercise is repeated, now aggregating the data by department and comparing with INE’s published results:
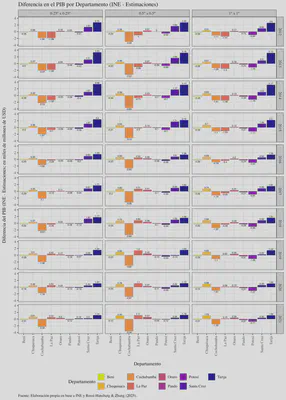
Here, the results become less precise—at least compared to official statistics. Let’s examine this by resolution:
- 0.25 degrees x 0.25 degrees (area-weighted): In this case, the estimates overstate GDP for Cochabamba and La Paz and understate it for Santa Cruz and Tarija, especially in the early years of the sample. Estimates seem to improve from 2019 onward. Still, the overestimation in Cochabamba and underestimation in Santa Cruz persist.
- 0.5 degrees x 0.5 degrees: The results are similar to the previous case but show even greater overestimation for Cochabamba. In extreme cases, the GDP of Cochabamba is overestimated by about 61% (2021), and that of Santa Cruz is underestimated by around 37% (2013).
- 1 degree x 1 degree: In this case, the estimates are fairly close to those published by INE, though there is still a slight overestimation for Cochabamba and slight underestimation for Santa Cruz. These gaps have diminished over time.
The chart above raises some concerns about the data quality, particularly at higher resolutions where more noise might affect the estimates. However, while not perfect, the data—if measured consistently—can still be useful for research purposes.
For instance, the per capita GDP estimates at each resolution level are shown below:
Conclusions
In this post, I explored further the GDP data at resolutions of 1x1 degree, 0.5x0.5 degrees, and 0.25x0.25 degrees developed by Rossi-Hansberg & Zhang (2025). Specifically, I compared the aggregated estimates at the national and departmental levels with official INE data.
The results are generally positive, although the data are less precise at the departmental level. On the other hand, the estimates have tended to improve over time—or at least converge toward those published by INE. While it is not possible to compare the data at the municipal level due to the lack of official figures, the results obtained at the departmental level are rather encouraging.