New Municipal-Level GDP Estimates for Bolivia
New Disaggregated GDP Data
One of the main challenges faced by developing countries like Bolivia is the lack of data to study various phenomena or policies and their impact on development. For instance, given Bolivia’s current context of fiscal unsustainability and the urgent need to reduce public spending (or increase tax revenue), it is necessary to identify which expenditures are more efficient and which are not.
One might argue that building roads, hospitals, or infrastructure for service provision is essential—but how essential? What is the impact of spending one dollar on a school versus on a road or hospital?
To answer such questions, one needs to evaluate the impact that different projects have had in the places where they were implemented. The problem is that, although the policy or project may be identified, it’s often impossible to calculate the impact at a sufficiently granular level (e.g., municipal level).
In this regard, a new research paper from the Becker Friedman Institute at the University of Chicago, titled Local GDP Estimates Around the World and authored by Rossi-Hansberg & Zhang (2025), has produced estimates of Gross Domestic Product (GDP) and per capita income globally from 2012 to 2021. This represents an extremely valuable resource for research and decision-making, particularly for developing countries.
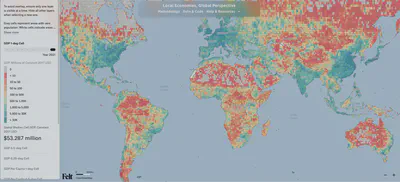
The methodological details can be found on the project’s website, but what’s interesting is that—using machine learning techniques and a set of high-resolution data (including NASA nighttime lights, LandScan population, and European Commission carbon emissions)—they have achieved this feat. What follows is an exploration of this data for Bolivia to see what insights we can draw.
The Case of Bolivia
The authors estimated several metrics (mostly GDP) at three levels: in 1° x 1° cells, 0.5° x 0.5° cells, and 0.25° x 0.25° cells. In this post, I will focus on the 0.25° x 0.25° cell estimates for Bolivia.
A first approach is to map Bolivia’s per capita GDP for the most recent year available, 2021, and observe its spatial distribution. Due to some extreme values, I chose to display the information in income deciles:
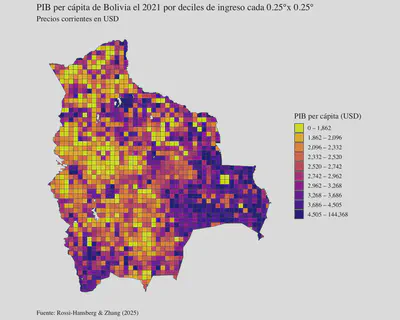
While the map reveals some interesting patterns—such as the concentration of per capita GDP in Santa Cruz and in border regions—the grid-based presentation may feel unnatural. Therefore, after transforming the data (by overlaying it with third-level administrative divisions, i.e., municipalities, and calculating the area-weighted per capita GDP for each cell), the following map is obtained:
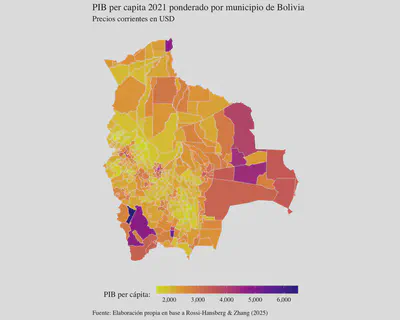
Unlike the previous one, this map shows the average per capita GDP weighted by the area of each municipality. It reveals, for example, that most economic activity is concentrated in capital cities but, more notably, along the country’s borders—an intriguing pattern that could be the subject of future research.
Conclusions
Much remains to be done with this data. First, it is important to verify whether the data makes sense and approximates the estimates published by Bolivia’s National Statistics Institute (INE). Then, from a research perspective, one could study phenomena such as migration, the impact of public investment across municipalities, and more.
However, even just visualizing the data already helps to better understand income distribution in Bolivia and assists policymakers in making more informed decisions.
To be continued…