Banking in Bolivia in 2024: The BCB Takes a Greater Role
Introduction
In early February, Bolivia’s Financial System Supervisory Authority (ASFI) published the banking system’s financial statements as of December 2024. Based on this new data, this post reviews key figures for the Bolivian banking sector.
The main focus is on the asset side—i.e., where banks have invested their capital and the funds they’ve borrowed from the public (liabilities).
Overview: The Balance Sheet
The balance sheet provides a snapshot of a financial institution’s situation at a given moment, showing the composition of its assets, liabilities, and equity.
For the banking system, assets represent the resources banks have invested in—such as loans granted, deposits in other financial institutions, and tangible assets like buildings and equipment. Liabilities reflect the banks’ obligations, including customer deposits and loans from other institutions. Equity is the difference between assets and liabilities, representing the banks’ own funds.
Balance Sheet Structure
To provide better insight, the following chart shows a summary of the banking system’s balance sheet composition at three key points: December 2023, and November and December 2024. This allows us to track changes in financial structure both over the past year and the most recent month:
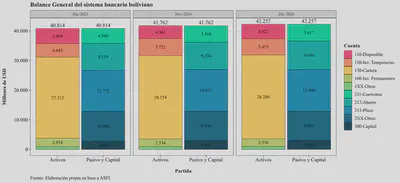
First, relative to December 2023, the balance sheet expanded significantly by nearly USD 1.443 billion.
More importantly, in light of the current economic context, the system expanded by nearly USD 500 million compared to November 2024. This increase was mainly due to a rise in cash holdings and, to a lesser extent, a slight growth in the loan portfolio. There was also a notable shift from temporary investments to cash, which will be discussed in more detail below.
On the liabilities side, the growth was driven by savings accounts (up approximately USD 300 million), followed by checking accounts. In contrast, term deposits declined slightly. It’s difficult to determine the exact cause, especially since deposit data do not distinguish between public and private sector sources. For example, the rise in demand deposits could stem from macroeconomic factors—such as more cash circulating in the economy—or increased precautionary savings and liquidity preference. Additionally, due to the role of the Public Pension Fund Manager (Gestora Pública), some of the demand deposit dynamics may be related to pension flows.
Currency Structure
Another insightful perspective is to analyze the currency composition of assets and liabilities:
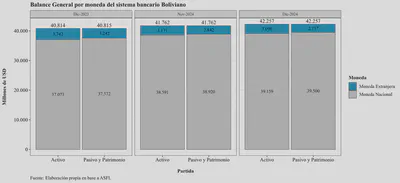
According to the chart, from a purely accounting perspective, banks have been prudent with currency matching, maintaining more foreign-currency assets than liabilities, which helps shield equity from potential devaluation. However, two important points must be considered:
- Decline in foreign-currency balances: From December 2023 to December 2024, both assets and liabilities in foreign currency dropped by over USD 600 million, reflecting reduced exposure to this category. This is linked to Bolivia’s balance of payments issues and the dollar shortage, which have led to fewer USD inflows and increased withdrawals of foreign-currency deposits.
- Use of foreign-currency assets as collateral: Although banks show adequate currency matching on paper, in practice, many of these assets have been pledged as collateral to the Central Bank of Bolivia (BCB) in exchange for local currency liquidity. These operations are intended to promote housing and productive loans. As a result, these assets are not available for deposit withdrawals, adding stress to the system.
This is further illustrated in the next chart, which focuses solely on foreign-currency balances:
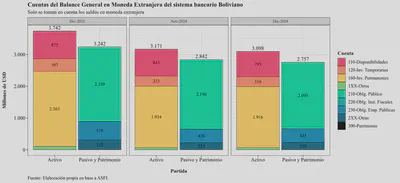
The bulk of foreign-currency liabilities are public obligations (savings and checking accounts), while the assets fall under “permanent investments” and “cash.” The former refers to investments in guarantee funds for subsidized loans, and the latter includes both cash held by banks and reserves at the BCB to comply with legal reserve requirements.
Assets
Bank assets include cash in vaults and ATMs, loans granted (the loan portfolio), investments in financial instruments, and real estate needed for operations. The loan portfolio remains the most important component, as it is the main source of revenue for financial institutions. Proper origination and management of this portfolio are crucial for the system’s stability and profitability.
Amid the current economic slowdown and declining Net International Reserves (NIR), banks have increased their cash holdings—both as cash and short-term investments. This is a response to the need for liquidity to handle potential unexpected withdrawals. Thus, liquidity management has become a top priority that requires continuous monitoring.
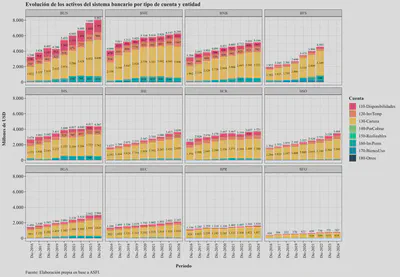
The following chart shows the evolution of bank assets from December 2016 to December 2024. There has been significant growth, despite fluctuations. Notably, despite the economic slowdown, the system has fully recovered to the asset level observed in December 2022, suggesting that the exit of Banco Fassil has been fully absorbed.
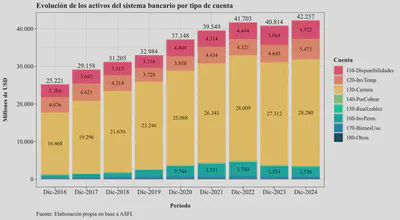
Breakdown by institution:
Cash Holdings
As defined in the Chart of Accounts for Financial Institutions, cash holdings include:
Cash held in vaults, balances with the Central Bank of Bolivia, head office and foreign branches, correspondent banks (domestic and international), as well as precious metals. It also includes checks, other immediately collectible instruments, and pending electronic payment orders.
It is worth noting that although outside the scope of this post, the BCB’s legal reserve requirement applies to liquid assets, forcing institutions to “hold” a portion of their deposits at the central bank. As such, banks are required to maintain a minimum level of liquid assets proportional to their deposit liabilities.
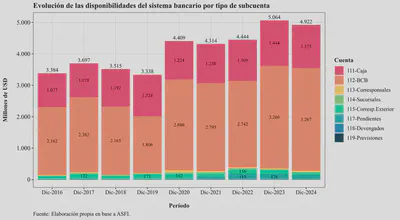
Composition
The chart below shows that the banking system’s cash holdings have remained stable, around USD 5 billion, of which approximately 30% is held in cash for daily operations (withdrawals, ATMs, etc.).
Breakdown by institution:
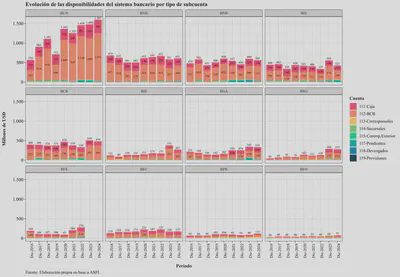
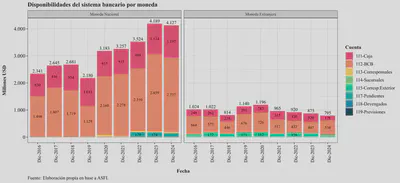
By Currency
Given the earlier-mentioned decline in NIR and the resulting foreign exchange shortage (see here), it is expected that foreign currency cash holdings have declined. This is reflected in the chart below:
Temporary Investments
According to ASFI’s Chart of Accounts for Financial Institutions, temporary investments are:
Investments in deposits at other financial institutions, the Central Bank of Bolivia, and debt instruments. These are made with the intention of earning returns on temporary liquidity surpluses and can be converted into cash within 30 days.
Let’s examine these further:
Composition
The chart below shows the composition of temporary investments as of December for each year from 2016 to 2024:

As seen, temporary investments have averaged around USD 4.2 billion, although 2024 saw a significant increase compared to recent years. There has been a greater concentration of these investments in the BCB. These can include fixed-term deposits, treasury bills, bonds, and other debt securities. The trend suggests the BCB is offering better short-term rates, leading banks to prefer BCB instruments. The following image shows which specific temporary investments increased in 2024:
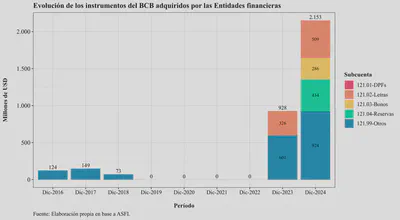
As shown, the BCB has used various instruments to absorb liquidity from the financial system. However, attention should be paid to instruments categorized as “Complementary Reserves” and “Others,” as they do not clearly specify the instruments’ characteristics or associated risks. This could lead to financial disintermediation, as banks prefer BCB instruments over loans to the real economy.
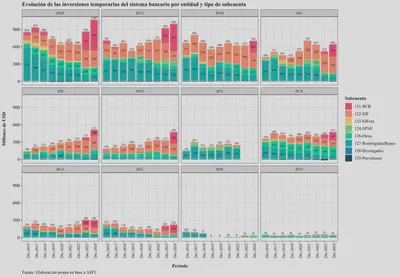
By institution, it’s evident this is a systemic trend, not isolated to one bank. The chart below shows the evolution of temporary investments by entity and account type:
By Currency
It’s also useful to look at temporary investments by currency. The chart below shows their composition over time:
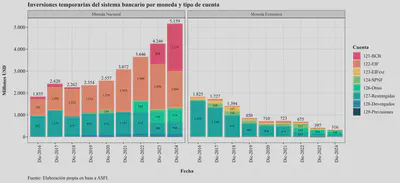
Over time, temporary investments have increasingly concentrated in local currency. Notably, restricted operations in foreign currency—once the most important—have become one of the least significant since 2016.
Loan Portfolio
This section analyzes the behavior of the banking system’s loan portfolio. Note that the loan portfolio is the primary source of financial income and the main asset of Bolivian banks.
Portfolio by Credit Type
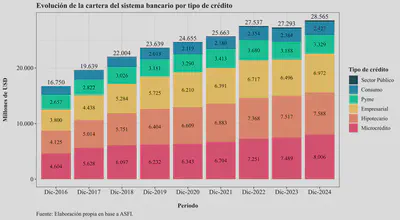
One way to analyze the loan portfolio is by credit type. As seen in the chart below, the portfolio has grown steadily since 2016, although it slowed in 2022 and 2023 due to the exit of Banco Fassil from the system:
Growth
A key question is how the loan portfolio has grown in recent years. This is important for several reasons—both excessive and insufficient growth may signal underlying issues. Rapid growth could indicate a credit expansion that, if poorly managed, may lead to solvency problems. On the other hand, slow growth could signal contracting aggregate demand and underlying weakness in the real economy.
The following chart shows year-over-year portfolio growth (current month compared to the same month the previous year), excluding provisions and accrued interest receivables. It reveals that growth has slowed and stabilized around 5% in 2024—slightly above levels seen during the COVID-19 emergency:
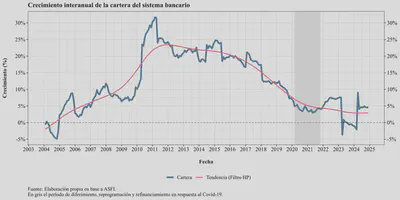
Additionally, the portfolio saw strong growth during the second half of the 2010s, peaking around March 2011. After that, although it remained in positive double digits, growth gradually decelerated.
This suggests a slowdown in lending, though not necessarily a contraction at the individual bank level. The problem is that Banco Fassil was still part of the system in early 2023, so the base for comparison included its portfolio. However, as shown below, not all banks have slowed credit placement:
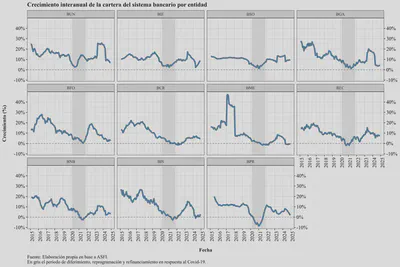
The above chart shows a notable slowdown in most banks, with many growing more slowly than during the pandemic’s early months. This trend should be closely monitored, as it reflects reduced national economic activity and weaker credit demand.
In terms of absolute balances, the following chart shows monthly changes in the loan portfolio:
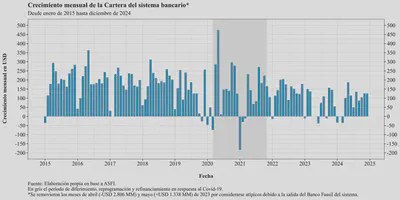
This chart reveals that monthly credit flows have diminished over time, despite being expressed in U.S. dollars at the official exchange rate.
Growth by Credit Type
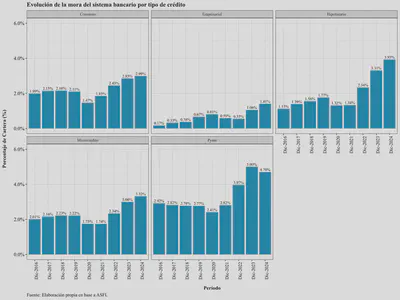
Finally, it is also useful to assess portfolio growth by credit type. The following chart shows year-over-year growth by credit category:
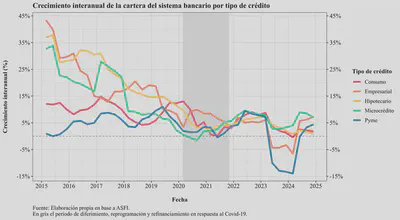
As with the aggregate portfolio, most credit types have lost momentum. SME and business loans were most affected, though both categories have recently returned to positive growth after several quarters of contraction. Meanwhile, mortgage and consumer credit growth has steadily decelerated, suggesting a loss of household purchasing power and tighter access to credit1.
Non-Performing Loans (NPL)
The non-performing loan (NPL) ratio includes all loans that are more than 30 days past due, expressed as a share of total loans.
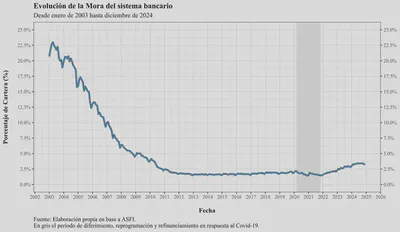
The chart below shows the historical evolution of the NPL ratio since January 2003. In 2003, NPLs peaked around 23%—enough to deem the banking system insolvent. The early 2000s were a particularly difficult period for Bolivia’s economy.
Since then, NPLs have been mostly under control. By 2007 the ratio fell below 10%, reaching a low of 1.55% in 2013. From then on, the ratio rose gradually but remained around 1.8% until the pandemic, when refinancing, extensions, and restructuring led to a temporary accounting decline in NPLs:
After the pandemic, NPLs have resumed their upward trend, posing challenges for banks and regulators. For example, focusing on data since 2015:
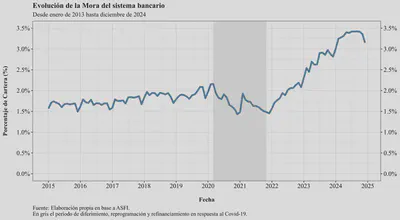
If not contained, rising NPLs could lead to solvency issues. In times of macroeconomic uncertainty, even a perception of financial weakness can trigger a bank run. It is therefore essential for authorities to monitor this indicator and act proactively.
Although the ratio stabilized slightly in late 2024 and even declined, macroeconomic risks—including diesel shortages, dollar scarcity (and the resulting rise in the parallel exchange rate), and forest fires—could eventually drive NPLs back up.
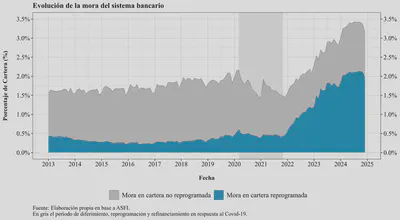
When separating NPLs into those arising from restructured loans and those from the rest of the portfolio, we see that the majority stem from the former. That is, restructured loans are the primary source of repayment issues for banks:
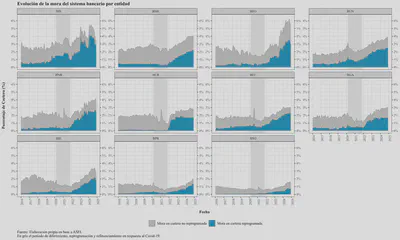
By institution:
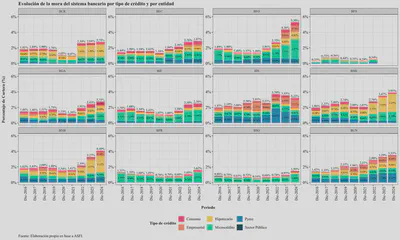
Looking at NPLs by credit type helps identify which borrower segments are most vulnerable:
Except for SME loans, NPLs have increased notably across credit segments—especially for mortgages and business loans.
NPLs by institution and credit type:
Restructured Portfolio
The restructured portfolio—more prone to default—remains around 15% of total loans. While some institutions have tried to reduce it, others continue to restructure. As I noted in a previous blog post, “[…] in previous years, a loan was restructured when the borrower indicated a (likely temporary) inability to pay. Case by case, banks would adjust the payment plan—lowering rates, extending terms, or reducing installments to prevent deterioration. However, if the client cannot pay now, the likelihood they can do so in the future is lower.”
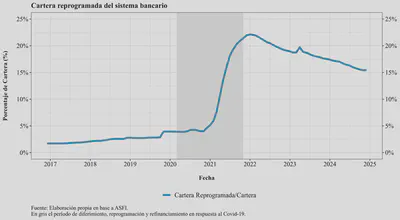
First, the restructured portfolio has been declining in recent months, both because of maturing loans and overall portfolio growth:
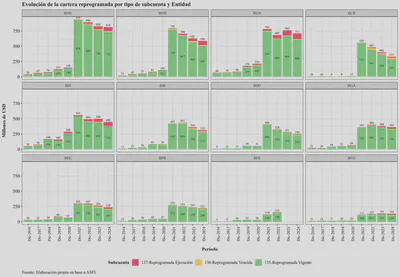
The issue with restructured loans is their higher likelihood of default. It’s important to monitor not only the troubled portion but the entire restructured portfolio. Below is the portfolio in USD millions, broken down by loan status:
Credit Concentration
Another important indicator is the concentration of credit in the banking system. In times of crisis, financial institutions often stop seeking new clients and instead grow by increasing lending to existing customers. This leads to more complex credit access, as banks become more conservative in their risk assessments, which is usually associated with slower economic growth:
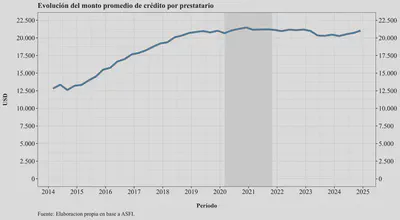
As shown above, there is a slight upward trend in the average loan amount per borrower, which could indicate that banks are concentrating their portfolios among fewer clients. However, the evidence is not conclusive and a more detailed analysis is needed to confirm whether portfolio concentration is indeed increasing.
Permanent Investments
According to the Chart of Accounts for Financial Institutions, permanent investments are:
Deposits in financial intermediaries, deposits in the Central Bank of Bolivia, debt securities acquired by the entity, and non-tradable public sector debt certificates. These are not easily convertible into cash or, even if liquid, are intended—by policy—to be held for more than 30 days.
Composition
The following chart shows the composition of permanent investments by account type:
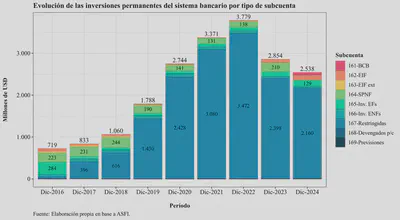
Note that the highest concentration is in account 167, which refers to “restricted availability investments.” These include “securities issued by national or foreign entities […] whose availability is restricted at the reporting date due to repurchase agreements, additional reserve requirements, or because they have been pledged as collateral.”
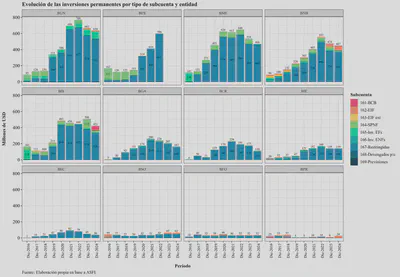
By institution:
Liabilities
Liabilities are a critical source of funding for financial institutions and are essential for their proper functioning. Liabilities include debts that banks owe to the public (deposits), businesses (checking accounts), and institutional investors.
In recent months, there has been speculation about banks’ ability to return funds to the public, prompting some customers to request withdrawals. This has challenged institutions, which have had to quickly find resources to repay savers.
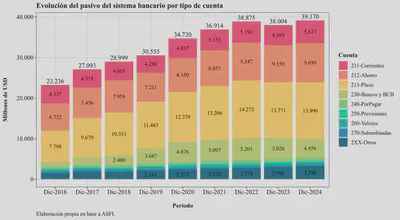
The following chart shows the evolution of banking system liabilities as of each December since 2015, with the latest available quarterly data added:
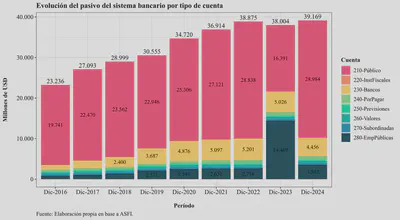
Starting in December 2023, note the increase in account 280, which is reserved for public enterprises. This is due to a reclassification from pension fund administrators (AFPs) to the Public Pension Fund Manager (Gestora Pública). Nearly 40% of the banking system’s funding is now concentrated in a single entity, posing liquidity management risks due to its significant market power. This reclassification was reversed in mid-2024, as shown in the graph.
Overall, banking system liabilities have grown modestly, averaging about USD 93 million per month. If banks cannot attract funds from the public, they cannot sustain credit portfolio growth—their main business and income source. Options include raising interest rates to attract deposits or negotiating directly with the Gestora for funding—also by offering higher rates. However, due to fixed rates on housing and productive loans, raising deposit rates could squeeze bank profitability.
Liabilities can also be broken down by deposit type:
From the chart above, we can see that savings accounts declined slightly compared to the previous December, while term deposits and checking accounts increased—the former significantly. This may be due to banks negotiating with the Gestora or large firms to retain treasury balances, offering higher rates as inflation and dollar scarcity erode the boliviano’s purchasing power. Thus, banks must compensate clients to keep funds deposited instead of moving them into alternative assets that may serve better as stores of value.
Growth
How have banking system liabilities evolved? In general, liabilities have continued to grow year-over-year, although at declining rates:
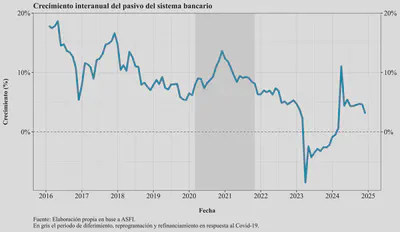
This chart should be interpreted with caution. As with the loan portfolio, after Banco Fassil’s liquidation, the comparison base includes larger previous values, while deposits have not yet fully recovered to pre-liquidation levels.
Year-over-year growth by institution:
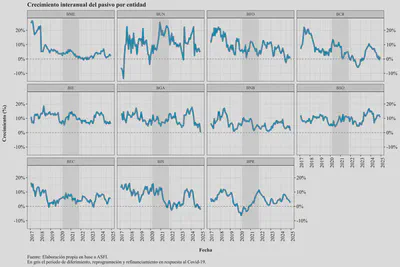
This shows that most institutions are struggling to attract new funds. While they are still growing compared to the same month the previous year, the growth rates are lower than in past years.
Year-over-year growth by deposit type:
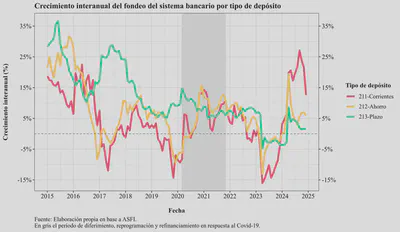
Except for checking accounts—which grew strongly after nearly a year of decline—growth in savings and term deposits has slowed in recent months. Whether this is driven by public sector activity (e.g., the Gestora) or private behavior (e.g., companies and individuals), it is clear that banks are struggling to attract funds—particularly term deposits—thereby limiting their ability to expand credit.
Income Statement
Finally, without delving into detail, the chart below presents the financial results of the Bolivian banking system as of September for the past three years:
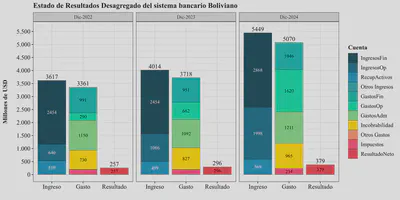
We see that business volume has grown, and by December 2024 the system posted a net result better than in the same month of previous years. However, these results should be interpreted with caution. They need to be adjusted for inflation and exchange rate effects and compared relative to the capital (and risk) assumed.
That said, there has been a shift in income sources—from financial income (loans) to operating income (fees)—with corresponding cost adjustments. Operating expenses have grown faster than operating income.
One improving item is uncollectibility—provisioned loans expected to be unrecoverable—which has declined in recent years, suggesting a better-quality portfolio. Still, due to recent restructurings and refinancing, this figure may be underestimated.
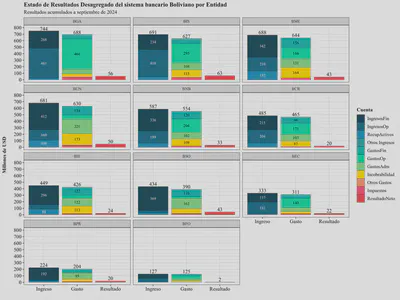
By institution:
Profitability
Another way to assess performance is by profitability—comparing returns to the capital invested in banks. The following chart shows the Return on Equity (ROE) for the Bolivian banking system at year-end since 2016:
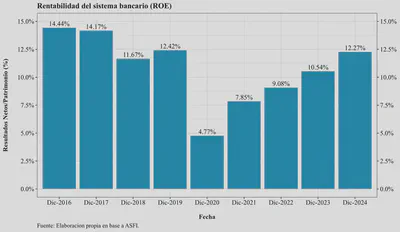
Since the pandemic, ROE has remained positive and rising, but still below pre-pandemic levels. Higher profitability not only means more dividends for shareholders, but also—though not automatically—greater capital, which serves as a buffer against losses and supports credit expansion. Therefore, sustained profitability is vital for the system.
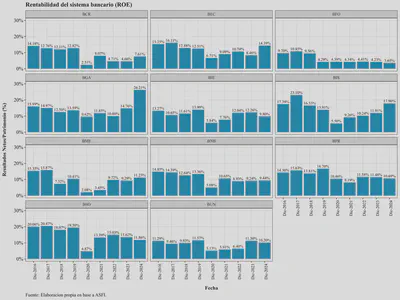
ROE by institution reveals significant variation:
Conclusion
Bolivia remains in a slow-moving crisis that is gradually materializing in the financial system, particularly the banking sector. Twin deficits (fiscal and external), accelerating inflation, and high social unrest that hinders production and growth are the main macroeconomic challenges. Within this context, the following is observed in the banking system:
- Balance Sheet Expansion: USD 1.443 billion growth in 2024, primarily to increase local currency liquidity, followed by loans. On the liability side, funding came mostly from savings growth, not term deposits as in previous years.
- Credit Growth: Still expanding, but slowing to 5% annually. Weaker performance is observed across all loan types—especially mortgage and consumer loans.
- Greater Liquidity and BCB Dependence: Liquidity increased, with a shift from temporary investments to cash. Meanwhile, temporary investments grew sharply in BCB instruments, which may not bode well for the broader economy.
- Stagnant Deposits: Deposit growth continues but has lost momentum.
- Credit Risk: NPLs fell slightly to 3.2% but remain high historically and are trending upward. Moreover, 15% of the loan book remains restructured—more prone to default.
- Profitability Recovery: ROE is positive and rising but still below pre-pandemic levels, with commissions gaining relative weight over loan income.
- Macroeconomic Risks: Fiscal deficits, dollar scarcity, and inflation threaten financial stability—limiting credit to the real economy and increasing BCB dependence.
For example, banks may prefer short-term, rising-rate deposits at the BCB rather than lending at “social” interest rates that do not compensate for inflation risk—especially for mortgages, which must be issued at long-term fixed rates. ↩︎